Skip to content

Manish Goel Stocks

Redefining Investing …

Menu

  • Home Page
  • Blogs
  • Past Performance
  • About
  • Multibagger® Trademark
  • Awards & Certificates
  • Contact/Subscribe Now
  • Latest News

Blog

Book Value Per Share (BVPS) Compounding: Warren Buffett’s 53-Year Berkshire Yardstick
Hero infographic on BVPS compounding with four blocks: left column 'Trader' above 'Drift' in gray; right column 'COMPUNDER' (green) above 'Speculator' (orange) on a dark blue background, title text at top.

Most retail Indian investors stare at the share price 50 times a day and never look at the book value once a year. That single habit is why 9 out of 10 of them lose money in F&O (per the

Manish GoelMay 2, 2026 Blog Read more

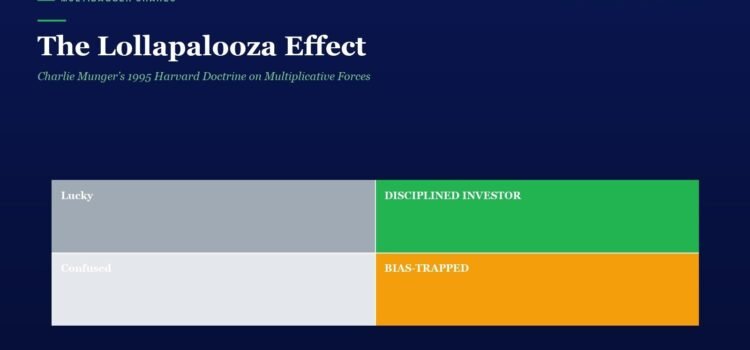
The Lollapalooza Effect: Charlie Munger’s 1995 Harvard Doctrine on Multiplicative Forces

The Lollapalooza Effect title with a four-quadrant infographic: top-left 'Lucky' in light gray, top-right 'DISCIPLINED INVESTOR' in green, bottom-left 'Confused' in pale gray, bottom-right 'BIAS-TRAPPED' in orange, all on a dark blue background.

📅 Published May 02, 2026 (Saturday) There is a kind of investment outcome — both spectacular wealth-creation and spectacular wealth-destruction — that no single explanation ever fully accounts for. The 2008 Lehman collapse was not “just” leverage. The 2018 IL&FS

Manish GoelMay 2, 2026 Blog Read more

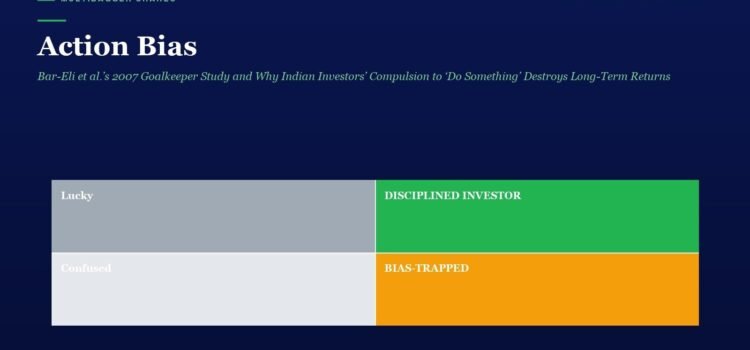
Action Bias: Bar-Eli et al.’s 2007 Goalkeeper Study and Why Indian Investors’ Compulsion to ‘Do Something’ Destroys Long-Term Returns

Hero section showing 'Action Bias' and a 2x2 grid of investor mindsets: Lucky (gray), Disciplined Investor (green), Confused (light gray), Bias-Trapped (orange).

The behavioural mistake that quietly destroys more long-term wealth in Indian retail portfolios than any other is not loss aversion, herd mentality or even recency bias — it is the simple, hard-wired compulsion to do something when the right answer

Manish GoelMay 1, 2026 Blog Read more

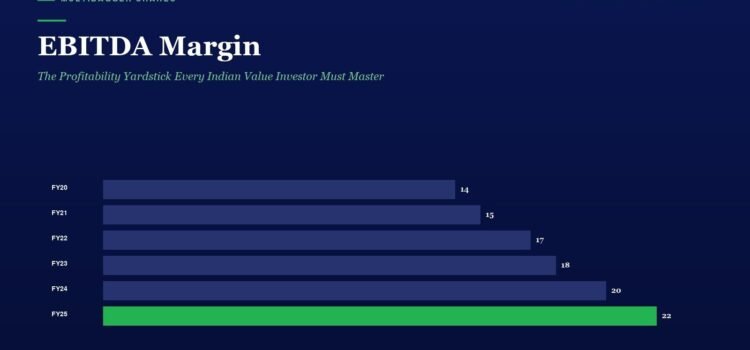
EBITDA Margin: The Profitability Yardstick Every Indian Value Investor Must Master

Infographic showing EBITDA Margin by fiscal year from FY20 to FY25; bars rise from 14 to 22, with FY25 bar colored green.

India’s equity markets now host more than 11 crore unique investors registered with NSE — up from barely 3 crore as recently as January 2020. Yet a SEBI study famously found that 9 out of 10 individual traders in the

Manish GoelMay 1, 2026 Blog Read more

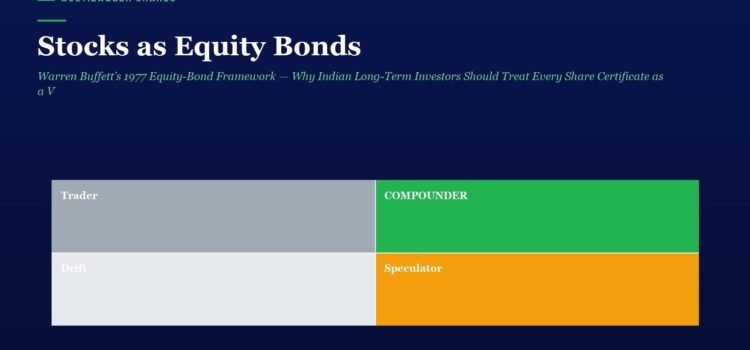
Stocks as Equity Bonds: Warren Buffett’s 1977 Equity-Bond Framework — Why Indian Long-Term Investors Should Treat Every Share Certificate as a Variable-Coupon Bond

Hero header with title 'Stocks as Equity Bonds' and subtitle, plus a 2x2 color grid labeled Trader, Compounder, Drift, Speculator.

One of the most useful sentences ever written about equity investing is buried in a 1977 Fortune essay titled “How Inflation Swindles the Equity Investor”. Warren Buffett, then 47, made an argument almost no Indian retail investor has internalised half

Manish GoelMay 1, 2026 Blog Read more

Pre-Mortem Analysis: Gary Klein’s 2007 HBR Discipline for Imagining Failure Before You Invest

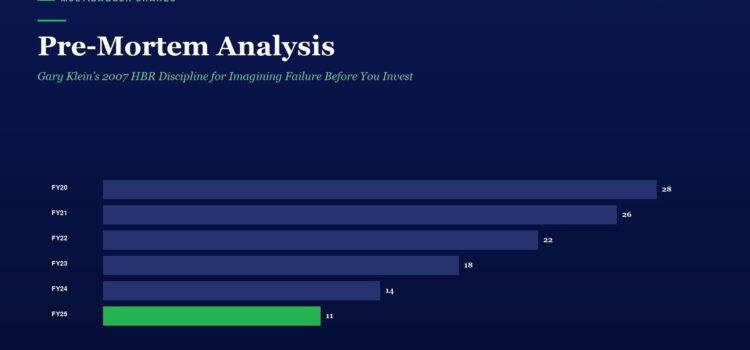
Pre-Mortem Analysis infographic with a horizontal bar chart of yearly values FY20–FY25; purple bars show 28, 26, 22, 18, 14, and a green bar for FY25 with 11.

If you can imagine, in vivid and unflattering detail, the precise way an investment will fail before you ever click “Buy” — and write that obituary down in the first person — you have already deactivated more than half of

Manish GoelApril 30, 2026 Blog Read more

Return on Capital Employed (RoCE): The Single Most Important Profitability Metric for Indian Value Investors

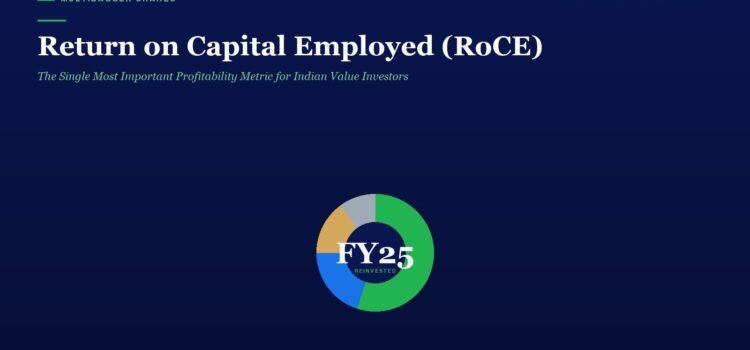
Hero banner with dark blue background, large title 'Return on Capital Employed (RoCE)' and a green subtitle; a colorful segmented donut chart labeled 'FY25 Reinvented' sits centered.

The 2024–25 SEBI study on the equity Futures & Options segment confirmed something most retail investors still refuse to internalise — 9 out of 10 individual traders incurred net losses, with aggregate trader losses crossing ₹1.8 lakh crore over three

Manish GoelApril 30, 2026 Blog Read more

Second-Level Thinking: Howard Marks’s First-Chapter Discipline for Indian Value Investors

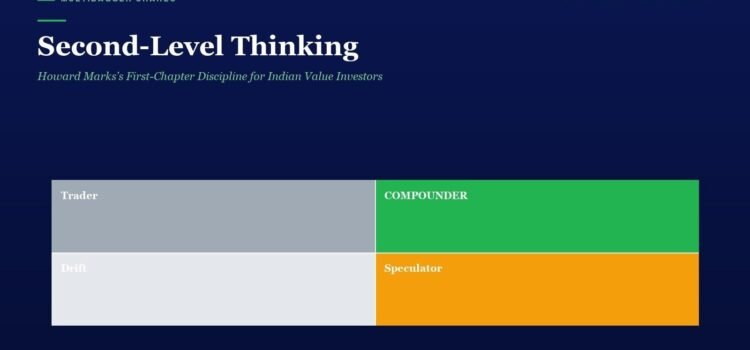
Hero section with dark blue background, title 'Second-Level Thinking' and a four-block diagram labeled Trader, Compounder, Drift, and Speculator.

Published: 30 April 2026 (Thursday) — Multibagger Shares — Manish Goel Most Indian investors I meet on Dalal Street are intelligent, well-read, and sincerely trying to compound their savings. Yet the majority will earn returns that lag the Nifty 50

Manish GoelApril 30, 2026 Blog Read more

Representativeness Heuristic: Why Indian Investors Confuse “Looks Like the Next Multibagger” with Probability

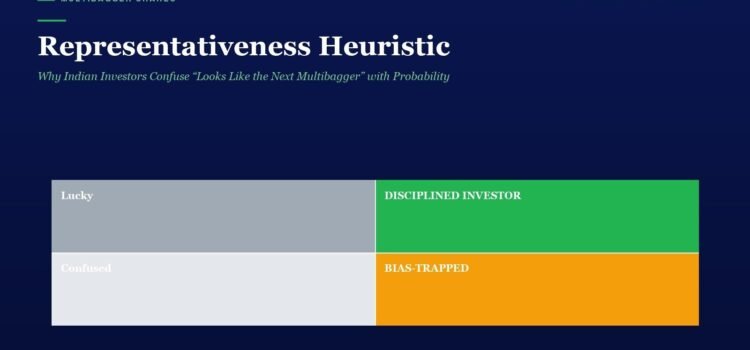
Infographic showing four quadrants: Lucky (gray), Disciplined Investor (green), Confused (light gray), Bias-Trapped (orange).

Read time: 12 minutes. Reading level: serious long-term investor. The single most expensive shortcut in your stock-picking process is the one you don’t notice you are taking — judging a stock by how much it looks like another stock that

Manish GoelApril 29, 2026 Blog Read more

Capex-to-Depreciation Ratio: The 60-Second Reinvestment-Discipline Filter Every Indian Value Investor Must Master

Dark blue hero banner with the headline 'Capex-to-Depreciation Ratio' and a green subtitle, featuring a centered multicolor donut chart labeled 'FY25' on a navy background.

Every Indian investor has heard Warren Buffett’s famous line that “the most important number in financial statements is the one we never see.” That number is reinvestment. Specifically: how much capital a business is putting back into the ground each

Manish GoelApril 29, 2026 Blog Read more

Mr. Market: Benjamin Graham’s 1949 Parable for Treating Daily Quotes as Offers, Not Verdicts

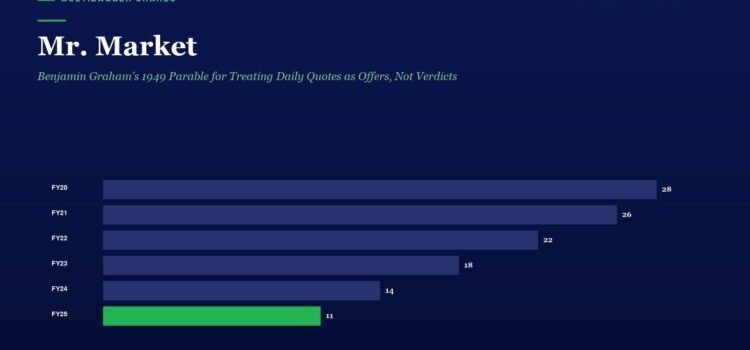
Infographic titled 'Mr. Market' with a dark blue background showing a horizontal bar chart of yearly values: FY20 28, FY21 26, FY22 22, FY23 18, FY24 14, and FY25 11 (FY25 bar in green).

Benjamin Graham wrote the most useful four pages in the entire history of investing in 1949, and the average Indian investor in 2026 still hasn’t read them. Chapter 8 of The Intelligent Investor introduces an imaginary business partner named Mr.

Manish GoelApril 29, 2026 Blog Read more

Status-Quo Bias: Samuelson & Zeckhauser’s 1988 Cognitive Anchor That Keeps Indian Investors Stuck in Regular MF Plans, Old Brokers and Drifting Allocations

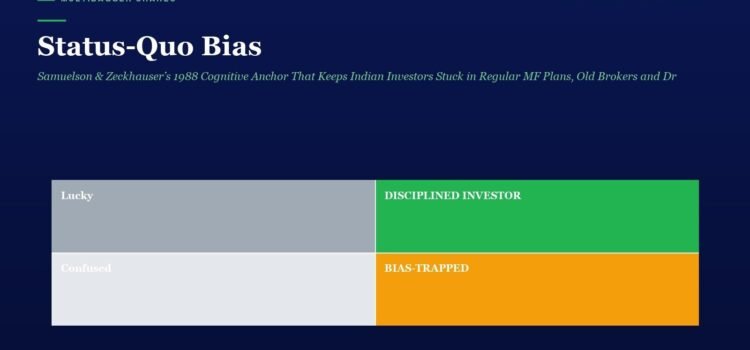
Hero: Status-Quo Bias with a four-quadrant grid on a navy background, labeled Lucky (gray), Disciplined Investor (green), Confused (light gray), Bias-Trapped (orange).

Every Indian retail investor has felt it — the strange paralysis of leaving things exactly as they are. The same mutual fund SIP from 2017, untouched. The same demat broker even after rates collapsed. The same Regular Plan despite knowing

Manish GoelApril 28, 2026 Blog Read more

Interest Coverage Ratio: The 30-Second Solvency Filter

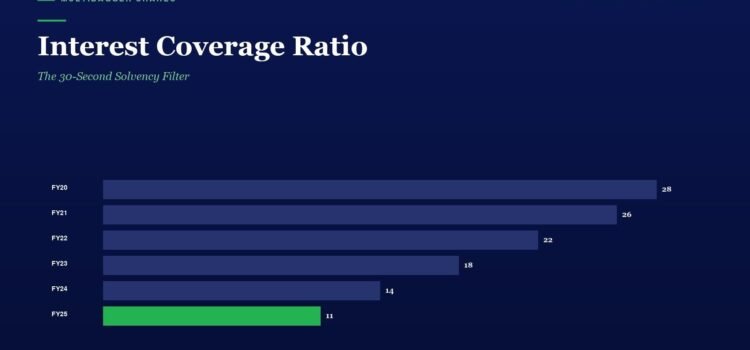
Infographic: Interest Coverage Ratio bar chart showing FY20 to FY25 with values 28, 26, 22, 18, 14, and 11 (FY25 in green).

The Securities and Exchange Board of India’s landmark 2024 study found that 9 out of 10 individual traders in the equity Futures & Options segment lost money — with aggregate net losses crossing ₹1.81 lakh crore over three years. As

Manish GoelApril 28, 2026 Blog Read more

The Maximum Pessimism Rule: Sir John Templeton’s Contrarian Doctrine for Indian Value Investors

Bold headline 'The Maximum Pessimism Rule' with a four-block color infographic showing Trader, Compounder, Drift, and Speculator on a dark blue background.

Sir John Templeton, the man who turned a $10,000 borrowed cheque in 1939 into a global mutual-fund empire, distilled his entire stock-buying philosophy into one sentence: “The time of maximum pessimism is the best time to buy, and the time

Manish GoelApril 28, 2026 Blog Read more

Free Cash Flow Margin: The One Number That Separates Real Profits From Accounting Illusions

Hero banner with a dark blue background, headline 'Free Cash Flow Margin', subtitle, and a colorful donut chart labeled 'FY25 Reinvented'.

Most Indian retail investors stop their fundamental analysis at net profit. They look at the bottom line, multiply by a P/E ratio, and decide whether the stock is “cheap” or “expensive.” But seasoned value investors – the kind who actually

Manish GoelApril 27, 2026 Blog Read more
  • « Previous
  • Next »

Translate:

My Portfolio CAGR is 112% as on 31.10.2024
My Contract Note of 28.06.2024 showing A.K. Spintex buying at 185 average

Telegram Link - https://telegram.me/longtermequityy

Manish Goel in ABP Live
Manish Goel in LiveMint
Bhopal Samachar

My Other Posts

  • The Share-Price Illusion: Why a ₹10 Share Is Not Cheap and a ₹1,00,000 Share Is Not Costly
  • The Cube of Gold That Cannot Grow: Warren Buffett’s Famous Lesson on Assets That Work and Assets That Just Sit
  • The Voting Machine and the Weighing Machine: Benjamin Graham’s Famous Lesson on Why Popularity Fades and Profits Win
  • Never Invest with Borrowed Money: Warren Buffett’s Simplest Rule for Surviving the Stock Market
  • Whose Report Card Are You Filling? Warren Buffett’s Inner Scorecard for the Everyday Investor
  • Know What You Own: Peter Lynch’s Two-Minute Test Before You Buy Any Stock
  • The Investor Who Never Has to Sell: Benjamin Graham’s Safety-Cushion Rule
  • Only When the Tide Goes Out: Warren Buffett’s Famous Lesson on How Good Times Hide Weak Companies
  • When Everyone at the Party Has a Stock Tip: Peter Lynch’s Famous Cocktail Party Theory
  • Why Good Companies Do Foolish Things: Warren Buffett’s ‘Institutional Imperative’ in Plain English
  • Forget the Forecast: Why the Best Investors Ignore the Economy and Watch the Business Instead
  • The Toll Booth Business: Why Some Companies Quietly Collect a Small Fee From a Huge Crowd
  • Boring Is Beautiful: Why Dull, Overlooked Businesses Often Make the Best Investments
Economic Times Industry Leaders Award for Manish Goel
In last 5 years, Out of my these shortlisted 30 companies, Hazoor Multiprojects Multiplied 21 Times in 2 Years, and Sangam Advisors (Waaree Renewables Technologies ltd) Multiplied 450 Times in 5 Years.
Copyright © 2026 Manish Goel Stocks. All rights reserved. Theme Spacious by ThemeGrill. Powered by: WordPress.
  • Home Page
  • Blogs
  • Past Performance
  • About
  • Multibagger® Trademark
  • Awards & Certificates
  • Contact/Subscribe Now
  • Latest News