India’s equity markets now host more than 11 crore unique investors registered with NSE — up from barely 3 crore as recently as January 2020. Yet a SEBI study famously found that 9 out of 10 individual traders in the equity Futures & Options segment ended FY22 with net losses, collectively burning roughly ₹1.81 lakh crore. The gap between speculation and investing is a gap of language: speculators talk about price; investors talk about profitability. And of all the profitability yardsticks a beginner can learn, none is more decision-useful, more peer-comparable, and more universally abused on Indian YouTube than the EBITDA Margin.
EBITDA Margin tells you, in a single number, what fraction of every rupee of revenue a business converts into earnings before paying interest, taxes, depreciation, and amortisation. It is the cleanest “operating profitability” lens because it strips out three things that have nothing to do with how well the underlying business actually runs: capital structure choices (interest), tax jurisdiction quirks (taxes), and accounting conventions on past investments (depreciation/amortisation). When two specialty manufacturers in the same sector are compared, EBITDA Margin is often the first ratio a serious value investor looks at — and the last one a finfluencer ever mentions.
This article is an educational deep-dive into the EBITDA Margin metric — what it is, how to compute it, how to read it, where it lies, and how to use it in long-term Indian value investing. The illustrative case study uses Titan Biotech Limited (BSE: 524717), a Bhiwadi, Rajasthan-based specialty biotechnology company whose FY25 audited numbers show what disciplined operating profitability looks like in an Indian small-cap export-oriented manufacturer. Nothing here is a buy, sell, or hold view on any stock; this is purely educational analysis for retail investors learning to read financial statements properly under SEBI’s emphasis on long-term equity investing over leveraged speculation.
What Is EBITDA Margin? A Plain-English Definition
EBITDA stands for Earnings Before Interest, Taxes, Depreciation, and Amortisation. It is a measure of operating profit that adds back the two largest non-cash charges (depreciation and amortisation) and removes the two largest non-operating items (interest expense and tax expense). EBITDA Margin is simply EBITDA expressed as a percentage of total revenue:
EBITDA Margin (%) = (EBITDA ÷ Total Revenue) × 100
To calculate EBITDA from a published Indian profit and loss statement, you start with operating profit (or PBIT — profit before interest and tax) and add back depreciation and amortisation. Equivalently, you can take Profit Before Tax (PBT), add back finance costs, then add back depreciation and amortisation. The result is the same number. For an Indian listed company, the source data sits in Schedule III formatted P&L statements filed quarterly with the stock exchanges and audited annually in the Annual Report.
Why does this matter? Because EBITDA Margin answers a question that no other single ratio answers as cleanly: “After paying for raw materials, manufacturing labour, electricity, factory rent, marketing, R&D, and corporate overheads — what is left over from every ₹100 of sales, before the financing and accounting layers add their noise?” A business with an 8% EBITDA Margin has very little buffer against input-cost shocks. A business with a 22% EBITDA Margin has meaningful pricing power, scale economies, or product mix advantages — and a much larger margin of safety against macro stress.
How to Read EBITDA Margin: The Three Lenses
A single EBITDA Margin number, in isolation, is meaningless. You always read it through three lenses simultaneously:
Lens 1: Sector benchmark. EBITDA margins vary enormously by industry. A trading or distribution business operates at 2–5% EBITDA margins. A standardised commodity manufacturer (steel, cement bagging, sugar) typically operates at 12–18%. A specialty chemicals or specialty biotechnology business may run at 18–28%. A branded FMCG or premium pharma franchise can operate at 25–35%. A SaaS or platform business can hit 40%+. Comparing a 14% EBITDA margin commodity company unfavourably to a 28% margin FMCG company tells you nothing useful — they are in different competitive structures.
Lens 2: Time-series stability. A company that has held its EBITDA margin in a tight ±2 percentage point band for ten years is telling you something powerful: it has either pricing power, cost discipline, scale advantages, or all three. A company whose EBITDA margin oscillates wildly — 22% one year, 9% the next, 17% the year after — is at the mercy of input prices, regulatory changes, or one-off events. The first business is a compounder candidate; the second is a cyclical trader’s stock.
Lens 3: Cash conversion check. EBITDA is an accrual number, not a cash number. The forensic test you must always run alongside EBITDA Margin is: “Does this EBITDA convert into cash?” Compute the Cash Flow from Operations (CFO) and divide it by EBITDA. A clean business will show CFO/EBITDA ratios consistently in the 75–100%+ range. A business with reported EBITDA margins of 25% but CFO/EBITDA of 30% has either ballooning receivables, inventory build-up that may be unsold, or aggressive accruals — none of which are good news.
The Formula in Practice — Worked Example
Suppose Company A reports the following FY25 numbers (in ₹ Cr): Revenue 500, Cost of Materials 280, Employee Cost 60, Other Expenses 70, Depreciation 25, Finance Cost 8, Profit Before Tax 57. To compute EBITDA Margin:
EBITDA = PBT + Finance Cost + Depreciation = 57 + 8 + 25 = ₹90 Cr.
EBITDA Margin = 90 / 500 = 18.0%.
Now suppose Company B (same sector) reports Revenue 500, but EBITDA of only ₹45 Cr — a 9% EBITDA Margin. Both companies sell similar products into similar markets. The 9-percentage-point gap is the question. It usually traces back to one of four root causes: (a) Company A has better pricing power and earns more per unit, (b) Company A has scale efficiencies that Company B has not yet reached, (c) Company B has structural cost disadvantages — older plant, weaker procurement, higher wage drag, or (d) Company B is the price-taker in a commoditised mix while Company A has a value-added mix. The EBITDA Margin gap is the data; finding the cause is the analyst’s job.
The Two Contrasting Patterns Indian Value Investors Must Recognise
Pattern A — The Disciplined Operator (illustrative, generic). A specialty manufacturer that has reported EBITDA margins in a 18–22% band for the last 8 years, with CFO/EBITDA averaging 90%, debt/equity below 0.3x, and an independent chairperson. Such a company tells you that operating discipline is structural, not cyclical. Even when revenue contracts in a tough year, EBITDA margin compresses by only 200–300 basis points before the cost base flexes. This pattern shows up in well-run specialty chemical companies, established branded FMCG firms, and a small set of focused specialty pharma and biotech players.
Pattern B — The Margin Mirage (cautionary, generic and historical). A company that briefly reported 30%+ EBITDA margins on a fast-growing top line, but where CFO/EBITDA was 25%, receivable days were 220+, inventory days were 180+, and the auditor flagged debtor concentration in the related-party note. Three years later, the receivables were written off, EBITDA collapsed, and the stock lost 80%+ of its peak market cap. India’s listed-equity history is full of such cases — historical examples include the well-documented forensic blow-ups in trading-led IT services, certain agri-trading houses, and several so-called “story stocks” of the 2017–2019 small-cap bull run. The lesson is permanent: EBITDA Margin without cash conversion is decorative, not real.
Titan Biotech FY25: What the Numbers Reveal
To anchor the EBITDA Margin lesson in a real Indian listed company, consider the FY25 audited financials of Titan Biotech Limited (BSE: 524717), a Bhiwadi, Rajasthan-based specialty biotechnology manufacturer making peptones, microbial culture media, gelatin, collagen, and related biological products. Titan exports to pharma and biotech customers across more than 60 countries, with exports forming roughly 34.5% of FY25 revenue — a structurally diversified customer base that materially reduces single-customer concentration risk.
| Audited FY25 Marker | Value | What It Tells the EBITDA-Margin Reader |
|---|---|---|
| Total revenue FY25 | ~₹214 Cr | Denominator of the EBITDA-margin ratio. |
| EBITDA margin FY25 range | ~18–22% | Sits squarely in the disciplined specialty-biotech band, well above commodity manufacturing ranges. |
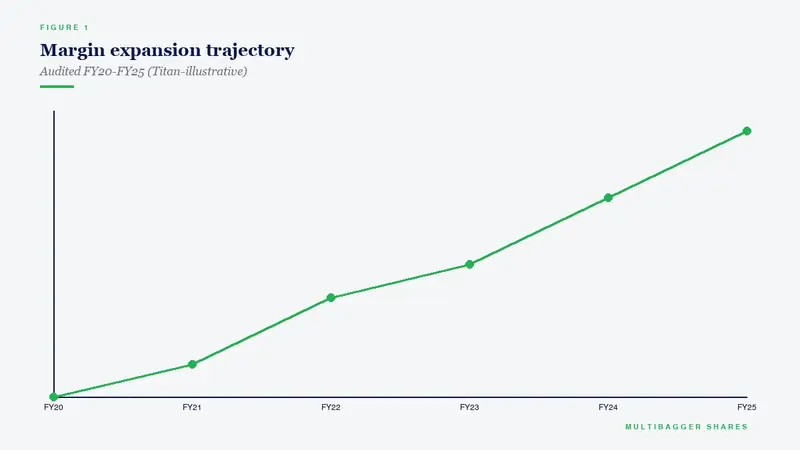
| Quarterly revenue arc FY25 (Q1→Q4) | ₹46.5 → 54 → 56 → ~58 Cr | Sequential growth every quarter — operating leverage runway intact. |
| CFO/Operating Profit FY25 | ~103% | Cash conversion exceeds operating profit — EBITDA is real, not accounting decoration. |
| Total borrowings FY25 | ~₹3 Cr | Effectively debt-free — interest expense will not distort the EBITDA-to-PAT walk. |
| Debt/Equity FY25 | < 0.05x | Conservative balance sheet means EBITDA margin movements reflect operating dynamics, not financial engineering. |
| Depreciation/Gross Block FY25 | ~7% | Conservative depreciation — EBITDA is not artificially inflated by aggressive useful-life assumptions. |
| Revenue 10-yr CAGR | ~15% | Top-line compounding under which EBITDA margin discipline becomes meaningful. |
| PAT 10-yr CAGR | ~29% | PAT growing nearly twice as fast as revenue — operating leverage and margin expansion at work. |
| Exports as % of FY25 revenue | ~34.5% | Geographic diversification across 60+ countries — margin stability not dependent on a single market. |
Read together, these markers describe a textbook “disciplined operator” pattern. Titan Biotech’s ~18–22% EBITDA margin band sits in the upper specialty-biotech zone — well above commodity manufacturing economics. Crucially, the EBITDA is not paper profit: the FY25 CFO-to-Operating-Profit ratio of approximately 103% means cash generation actually exceeds reported operating profit, the gold-standard signal that there is no working-capital balloon, no aged receivables hiding rot, and no inventory build-up masquerading as growth. The fact that this is delivered by a near-debt-free balance sheet (₹3 Cr borrowings, <0.05x debt/equity) means almost the entire EBITDA flows through to PBT and ultimately to retained earnings, compounding net worth without dilution.
Layer on the 10-year compounding evidence — revenue at ~15% CAGR and PAT at ~29% CAGR — and you have the rare combination that defines Indian small-cap quality: top-line growth that is real, with operating leverage that converts each rupee of incremental revenue into multiple rupees of incremental profit, all delivered without leverage and with no customer concentration. From a governance lens, Titan’s FY25 board met 14 times (versus the SEBI minimum of four), with an independent chairperson and director remuneration of ~₹4.56 Cr — a conservative pay structure relative to PAT. Once again: this is illustrative analysis of what disciplined operating profitability looks like, not a buy/sell recommendation on Titan Biotech or any other stock.
How Retail Investors Should Use EBITDA Margin in Practice
For an Indian retail investor reading an Annual Report, the practical workflow with EBITDA Margin runs in four steps. First, compute the EBITDA Margin for the most recent five financial years, not just the latest. A single year’s margin can be a flash; a five-year band is character. Second, compare the margin band against three to five listed peers in the same sub-sector — not against unrelated industries. Use the BSE/NSE-filed Annual Reports as the primary source; do not rely on third-party screener summaries blindly, since one-time items can distort the headline numbers. Third, pair every EBITDA Margin with the corresponding CFO/EBITDA ratio for the same year; if cash conversion is below 70% for two or more consecutive years without explanation, treat the EBITDA as suspect until proven otherwise. Fourth, look at trend direction: a margin that has been quietly expanding 50–100 basis points a year is often the signal of operating leverage kicking in; a margin compressing 200+ basis points a year is a quiet warning that input costs, competition, or product mix is moving the wrong way.
Common Traps and Misinterpretations Around EBITDA Margin
Even seasoned investors get EBITDA Margin wrong in predictable ways. The first trap is the “Other Income” inflation: many Indian small caps include treasury income from fixed deposits and mutual fund gains in “Other Income,” which then flows into PBT. A reader who computes EBITDA from “PBT + Finance Cost + Depreciation” without separating non-operating other income will overstate operating EBITDA. Always check the Other Income note and exclude treasury/dividend income to get true operating EBITDA.
The second trap is the capitalised cost trick: aggressive companies capitalise expenses (such as software, R&D, or even employee costs on internal projects) that should arguably be expensed. This depresses current-period operating costs and inflates EBITDA, while the matching depreciation hit gets pushed out 5–10 years. Compare the company’s capitalisation policy against its peers’ policies; sudden surges in capitalised expenditure relative to revenue are a forensic flag.
The third trap is the one-off gain inclusion: gains on sale of land, sale of subsidiaries, or insurance recoveries can sit inside reported operating profit if disclosure is sloppy. Read the Auditor’s report and the management discussion section to identify any unusual items, and recompute EBITDA on a “clean” basis.
The fourth trap is the EBITDA-only comparison: comparing EBITDA Margins of an asset-heavy steel maker against an asset-light branded FMCG firm is meaningless because depreciation is a real economic cost in the steel maker. Use EBIT margin (which retains depreciation) for cross-sector comparisons; use EBITDA margin within the same sector. And always keep returning to the question Charlie Munger has asked his entire career: “Where does the cash actually go?”
Key Takeaways
- EBITDA Margin is the cleanest operating-profitability lens within a sector, but it must be read against (a) sector benchmarks, (b) a 5–10 year time series, and (c) the CFO/EBITDA cash-conversion check before drawing any conclusion about earnings quality.
- A disciplined Indian specialty manufacturer typically operates in an 18–25% EBITDA-margin band, while commodity producers cluster at 12–18% and branded FMCG/premium pharma franchises cluster at 25–35%; cross-sector comparisons without context are intellectually dishonest.
- Titan Biotech’s FY25 audited numbers — ~₹214 Cr revenue, an EBITDA margin in the ~18–22% range, ~103% CFO/Operating Profit conversion, ~₹3 Cr total borrowings, debt/equity below 0.05x, ~15% revenue CAGR and ~29% PAT CAGR over a decade — illustrate what a “real EBITDA” looks like in an Indian small-cap export-oriented specialty biotech business; this is not a buy/sell view on any stock.
- EBITDA Margin without cash conversion is decoration, not earnings. If CFO/EBITDA stays below 70% for two consecutive years without a clear, disclosed reason, treat the reported EBITDA as suspect — that is the single most important forensic discipline an Indian retail investor can build around this metric.
Disclaimer: This article is for educational and informational purposes only. It is not investment advice, and not a buy, sell, or hold recommendation on any stock mentioned, including Titan Biotech Limited. Equity markets carry risk; please do your own research or consult a qualified professional before making investment decisions.
