The Securities and Exchange Board of India’s landmark 2024 study found that 9 out of 10 individual traders in the equity Futures & Options segment lost money — with aggregate net losses crossing ₹1.81 lakh crore over three years. As 11 crore Indians have rushed into the equity markets since 2020 (up from 3 crore in 2019, per NSE data), one hard truth keeps surfacing in every value-investing post-mortem: more retail portfolios have been destroyed by debt-laden balance sheets than by any other single fundamental factor. Companies that looked profitable on the income statement turned out to be insolvent on the balance sheet. The single most reliable filter to catch them before the auditor finally qualifies the going-concern note is the metric most retail investors have never been formally taught: the Interest Coverage Ratio (ICR).
This article unpacks ICR end-to-end — what it is, how to compute it from any Indian annual report, what numbers separate resilience from financial distress, where it can mislead even careful investors, and how the FY25 audited disclosures of Titan Biotech Limited (BSE: 524717) illustrate what disciplined balance-sheet design actually looks like in a small-cap Indian biotechnology business. This is not a buy/sell recommendation on Titan Biotech or any other stock. It is a forensic, educational walkthrough of one of the most predictive credit-quality metrics ever developed.
What Is the Interest Coverage Ratio?
The Interest Coverage Ratio measures how many times over a company’s operating profit can pay its interest bill. Conceptually, it is the financial-statement equivalent of a stress test: if pre-interest, pre-tax profit fell by half tomorrow, would the company still be able to honour its lenders? An ICR of 8x means the company earns ₹8 of operating profit for every ₹1 of interest cost. An ICR of 1.2x means the company is one bad quarter away from defaulting on its debt servicing.
The ratio was popularised in modern credit analysis by Standard & Poor’s and Moody’s during the 1970s as a way to compare debt-servicing capacity across industries with very different capital structures. Indian banks, NBFCs and credit-rating agencies (CRISIL, ICRA, India Ratings, CARE) embed ICR thresholds directly into loan covenants — typically requiring listed borrowers to maintain coverage above 2.0x or 3.0x, with cure periods that trigger if coverage falls below the floor. Investors who track the same metric independently can usually see distress one or two quarters before a credit-rating downgrade hits the wires.
The Formula — and Where the Numbers Live
The textbook formula has two common variants:
Interest Coverage Ratio = EBIT ÷ Interest Expense
where EBIT (Earnings Before Interest and Taxes) is taken from the consolidated profit-and-loss statement, and Interest Expense is the line item labelled “Finance costs” under Indian Accounting Standards (Ind AS).
A more conservative version, often used by credit analysts, replaces the numerator with cash-flow:
Cash ICR = (EBITDA − Working-Capital Investment − Maintenance Capex) ÷ Interest Expense
The cash version corrects for the well-known weakness of accrual EBIT — that it can be inflated by aggressive revenue recognition or low depreciation policies — and isolates the cash actually available to honour interest obligations. For most quality businesses the two ratios move together; when they diverge sharply, that is itself a warning signal worth investigating.
In an Indian annual report, you will find Finance Costs (interest) on the face of the standalone and consolidated P&L, broken further into “interest on borrowings”, “interest on lease liabilities” (post Ind AS 116), and “other borrowing costs” in the notes. EBIT is computed by taking Profit Before Tax and adding back Finance Costs.
How to Read the Number
Generic guideposts that have held up across decades of Indian credit cycles:
Above 8x — Fortress balance sheet. The company has either no meaningful debt, or its operating profitability is so dominant that interest is a rounding error. These companies are typically the survivors of every cyclical downturn and are best positioned to acquire distressed competitors when the cycle turns.
4x to 8x — Healthy. Coverage is comfortable, lender confidence is intact, and the company has flexibility to invest through downturns. Most well-run mid-cap Indian businesses sit here.
2x to 4x — Adequate but watchful. The company can absorb a moderate earnings shock, but a sharp downturn will compress coverage quickly. Banks may demand higher pricing on incremental loans.
1x to 2x — Distressed zone. A single quarter of operating-margin compression can push coverage below 1x — at which point the company is technically not even earning enough operating profit to pay interest, and is funding the gap from existing cash, asset sales, or fresh borrowings. Rating agencies typically downgrade to BB or lower in this band.
Below 1x — Solvency crisis. The income statement is a misdirection; the company is silently consuming its equity to keep the lights on. The terminal pattern from Indian corporate history is well-rehearsed: rights issues at deep discount, promoter pledge increases, related-party loan rollovers, eventual referral to the IBC under the Insolvency and Bankruptcy Code.
Two Contrasting Illustrations
Illustration A — The Disciplined Compounder. Imagine an Indian specialty-chemicals business with ₹500 crore in revenue, ₹100 crore in EBIT, and ₹6 crore in finance costs (largely working-capital lines). Its ICR is approximately 16.7x. Even if EBIT halved overnight in a global demand shock, coverage would still be 8.3x — well inside the fortress band. Such a company can borrow cheaply if it ever wants to, can repurchase shares opportunistically when valuations collapse, and can credibly bid for a stressed competitor in the next downturn. Its capital structure is a competitive weapon.
Illustration B — The Levered Cyclical (composite, drawn from historical Indian corporate-credit failures). Now picture a similar-sized infrastructure construction business with ₹500 crore in revenue, ₹50 crore in EBIT, and ₹40 crore in finance costs servicing a ₹400-crore debt stack accumulated to win government EPC contracts. ICR is 1.25x. A 25% EBIT compression — the kind that happens routinely when a state government delays receivables — pushes coverage below 1x. The Indian corporate landscape between 2012 and 2018 is littered with construction, steel, and power companies that printed exactly this profile a year before defaulting. Many of them ended up in the IBC’s first wave of resolutions, with equity holders wiped out.
The lesson is not that debt is evil. It is that a company’s ICR is the single number that reveals whether its growth has been bought with capital or with discipline.
Titan Biotech FY25: What the Numbers Reveal
Titan Biotech Limited operates in a sector — specialty biotechnology, microbial culture media, peptones, collagen and gelatin — where global pharma and biotech customers are unusually unforgiving on quality and continuity. Customers across more than 60 countries, including regulated pharma OEMs, are unwilling to qualify a vendor whose financials hint at distress. The company’s FY25 audited disclosures show a balance sheet that has been consciously engineered to remove that concern from the buyer’s mind.
| FY25 Audited Marker | Value | Interpretation |
|---|---|---|
| Total Borrowings | ~₹3 Cr | Essentially debt-free; lease liabilities + token working-capital lines |
| Total Revenue (FY25) | ~₹214 Cr | Sustained QoQ growth: ₹46.5 → ₹54 → ₹56 → ~₹58 Cr |
| Debt / Equity Ratio | < 0.05x | Among the most conservative leverage profiles in Indian small-cap biotech |
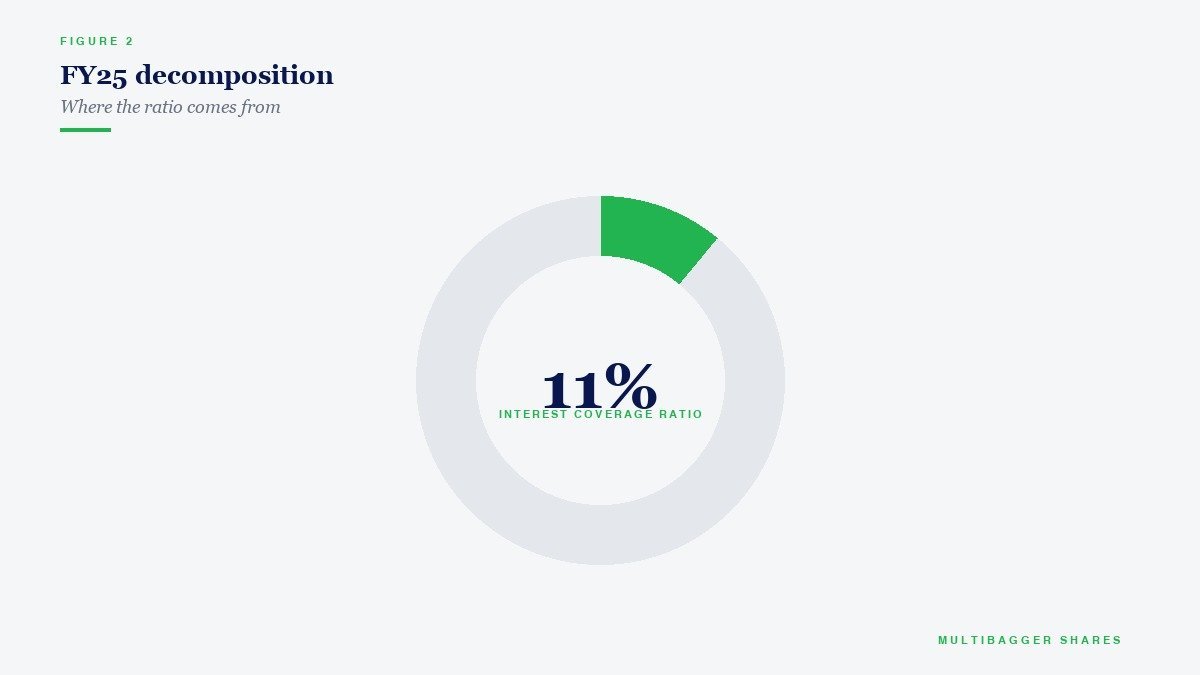
| Interest Coverage Ratio | Very high (multiple-times-over) | Finance costs are de minimis relative to operating profit |
| CFO / Operating Profit | 103% | Cash generation slightly exceeds operating profit — premium earnings-quality marker |
| Contingent Liabilities | ₹7.78 Cr | Modest disclosed exposure relative to net worth |
| Gross Block | ~₹57 Cr | Capital-light manufacturing footprint relative to revenue |
| Capital Work-in-Progress | ~₹11 Cr | Capacity expansion funded internally — no debt-financed capex |
| Director Remuneration (FY25) | ~₹4.56 Cr | Conservative relative to PAT; aligned with shareholder economics |
Three observations stand out from the table. First, with total borrowings at approximately ₹3 crore against operating profit of multiple times that figure, Titan Biotech’s interest coverage is so high that the metric loses analytical resolution — coverage is essentially “not constrained”. This is the rare case where the ICR is high not because the company has earned its way through a profitability cycle, but because the management team has chosen, structurally, not to lever the balance sheet. Second, the ₹11 crore of capital-work-in-progress alongside the ₹3 crore of borrowings tells a particular story: capacity expansion for the next leg of growth is being funded out of internal accruals, not bank debt. That is the textbook definition of “growth-without-leverage” that compounds book value over decades. Third, the 103% CFO-to-Operating-Profit ratio confirms that the operating profit driving the (very wide) interest coverage is itself cash-backed — there is no accrual mirage being protected by the absence of leverage. The two metrics reinforce each other.
None of this is a comment on the equity’s price. The point is forensic, not directional: a small-cap exporter with debt of ₹3 crore, ₹11 crore of internally funded CWIP, contingent liabilities of ₹7.78 crore, and CFO that exceeds operating profit, is presenting a balance-sheet picture that is mathematically incompatible with the most common Indian small-cap accident pattern (ICR collapse during a working-capital squeeze). For an investor learning how to read ICR, this is what the disciplined end of the spectrum looks like in numbers.
How Retail Investors Should Use Interest Coverage Ratio
For Indian retail investors building a value-style portfolio, ICR earns its keep in three specific situations. First, as a screen. Any company with ICR below 2.0x in two consecutive years should be subject to the highest level of scrutiny — read the auditor’s report, the related-party disclosures, the contingent-liability table, and the cash-flow statement before considering anything further. Second, as a stability check. Companies whose ICR has stayed above 4x through at least one full economic cycle (such as the FY20 pandemic shock or the FY13 commodity bust) are demonstrating that their operating model holds together when the wider economy doesn’t. Third, as an early-warning system. A company whose ICR has been falling for four to six consecutive quarters — even if still above 2x — is signalling that either operating profitability is compressing, or interest costs are rising faster than profits, or both. That trajectory matters more than the level.
The metric is most powerful when read alongside three companions: the absolute level of debt-to-equity (to see whether high coverage is hiding a thin cushion in a cyclical business), the cash conversion ratio (to see whether the EBIT in the numerator is real), and the contingent-liability-to-net-worth ratio (to catch off-balance-sheet exposures that might suddenly land on the income statement). ICR alone can be gamed; ICR plus those three companions is much harder to fake.
Common Traps and Misinterpretations
ICR is not foolproof, and four traps catch even careful Indian investors.
Trap 1 — Capitalised interest. Under Ind AS 23, interest costs incurred on the construction of qualifying assets can be capitalised into the asset’s cost rather than expensed through finance costs. Companies in the middle of a large project-finance build-out can therefore show a misleadingly high ICR while their underlying interest burden is much larger. Always read the capitalisation note in the borrowing-cost section.
Trap 2 — Operating-lease re-classification. Post Ind AS 116 (effective FY20 for Indian listed entities), what used to be operating-lease rent now sits partly inside finance costs (interest on lease liabilities) and partly inside depreciation. A rough comparison of pre-FY20 ICR with post-FY20 ICR for the same company is therefore not apples-to-apples. Use lease-adjusted EBIT in the numerator if you want a like-for-like multi-year series.
Trap 3 — Other Income inflation. Some companies disclose treasury income (dividends, mutual-fund gains, property income) within EBIT and quietly boost reported ICR. The cleanest correction is to use core operating EBIT — i.e. EBITDA minus depreciation — and to exclude non-operating other income from the numerator. ICR computed off raw “Profit Before Interest and Tax” (PBIT) as printed on the P&L can be optically much friendlier than the underlying operating reality.
Trap 4 — Single-period spikes. An ICR derived from one good quarter can mask the underlying trend. Always use trailing-twelve-month (TTM) or a multi-year median, not the most recent quarter, especially in cyclical sectors like commodities, autos, real estate, and infrastructure.
A useful rule of thumb: if a company’s reported ICR looks suspiciously generous given how levered the balance sheet appears, the explanation almost always lies in one of these four traps. Forensic-quality investors find the answer in the notes, not on the face of the P&L.
SEBI, the F&O Trader Statistic, and Why Solvency Beats Speculation
The same SEBI study that documented 93% loss-makers in F&O is, indirectly, an Interest Coverage Ratio story. The leveraged trader’s notional equivalent of ICR is the ratio of expected positive carry to interest cost on the leverage taken on the trade. When that ratio is below 1, the trader is structurally guaranteed to lose money on aggregate, exactly the way a corporate borrower with ICR below 1 is structurally guaranteed to consume equity. The 93% figure is the personal-finance reflection of a balance-sheet truth that has been understood in corporate-credit circles for fifty years: no return profile, however attractive, survives sub-1x coverage of fixed obligations. The asymmetry destroys you eventually.
Indian retail investors who internalise ICR as a portfolio-construction filter — selecting only businesses whose ICR has remained robust through at least one cycle — are mechanically excluding the very category of companies that produce most retail wealth destruction. SEBI’s finfluencer rules of 2024 explicitly require that any solvency claim made about a company in published content be supported by audited filings. ICR is one of the few metrics that can be cited cleanly from a company’s own annual report without invoking subjective judgement.
Key Takeaways
- ICR is the 30-second solvency filter. An Interest Coverage Ratio of 4x or higher, sustained through at least one economic cycle, is one of the most reliable single-metric indicators of corporate resilience available to Indian retail investors.
- The four traps are the alpha. Capitalised interest (Ind AS 23), Ind AS 116 lease re-classifications, treasury-income inflation, and single-quarter spikes can all flatter ICR. Reading the notes — not the face of the P&L — is where rigorous analysis begins.
- Titan Biotech FY25 illustrates structural ICR robustness. Total borrowings of ~₹3 crore against multi-times operating profit, ₹11 crore of internally funded CWIP, contingent liabilities of ₹7.78 crore, and CFO at 103% of operating profit together describe a balance sheet that is incompatible with the typical Indian small-cap solvency-failure pattern.
- Solvency beats speculation, every cycle. SEBI’s F&O loss-maker statistic is the personal-finance mirror of corporate ICR collapse — sub-1x coverage of fixed obligations is the universal precondition for capital destruction. Building a portfolio around fortress-coverage businesses is a structural defence against that pattern.
Disclaimer
Disclaimer: This article is for educational and informational purposes only. It is not investment advice, and not a buy, sell, or hold recommendation on any stock mentioned, including Titan Biotech Limited. Equity markets carry risk; please do your own research or consult a qualified professional before making investment decisions.
