The 2024–25 SEBI study on the equity Futures & Options segment confirmed something most retail investors still refuse to internalise — 9 out of 10 individual traders incurred net losses, with aggregate trader losses crossing ₹1.8 lakh crore over three years. Yet on the same exchanges, a small minority of long-term investors continued to compound wealth quietly, owning the same listed businesses for ten and twenty years. The single profitability metric that, more than any other, separates these two outcomes is Return on Capital Employed — RoCE.
Warren Buffett has called it “the single most important number in business analysis.” Charlie Munger built much of Berkshire’s bolt-on acquisition discipline around it. Indian equity researchers from Sanjoy Bhattacharyya to Saurabh Mukherjea reference it as the gating filter before any deeper work begins. And yet, in a 2024 SEBI investor-survey, fewer than 8% of retail investors could correctly define RoCE — the majority confused it with RoE, with PAT margin, or with simple profit growth.
This article is the educational deep-dive every Indian small-cap investor should bookmark. We will explain what RoCE is, how to compute it, how to read it, the most common traps that cause it to mislead, and finally how to apply it to a real, publicly listed Indian specialty biotechnology business — Titan Biotech Limited (BSE: 524717) — using its FY25 audited annual report as the positive illustration of what disciplined capital allocation looks like on the page.
What is Return on Capital Employed?
Return on Capital Employed is a profitability ratio that asks one simple question: For every rupee of total capital — both shareholder equity and borrowed money — that the business has tied up, how many paise of operating profit does it generate in a year?
It is, in plain English, the productivity of all the capital working inside the company, not just the equity slice. That distinction matters enormously. A company can flatter its return on equity by simply borrowing more money and buying back shares — RoE goes up because the equity denominator shrinks, even though the underlying business has not improved. RoCE cannot be gamed that way. The numerator is operating profit (before interest and tax), which is unaffected by capital structure, and the denominator includes both equity and debt. So RoCE measures the genuine economic productivity of the whole enterprise — a much harder number to manipulate.
This is why Buffett, Munger, Terry Smith, Nick Train, and every disciplined Indian portfolio manager from Kenneth Andrade to Samit Vartak treat RoCE as the first quantitative gate. Below a certain RoCE threshold, the business is destroying economic value relative to its cost of capital, no matter what its revenue growth, EPS growth, or share price is doing.
The Formula and How to Read It
The textbook formula is:
RoCE = Earnings Before Interest & Tax (EBIT) ÷ Capital Employed
Where Capital Employed = Total Equity + Total Borrowings (some practitioners also add lease liabilities and exclude cash and CWIP — both reasonable refinements, discussed in the “traps” section below).
EBIT is found on the consolidated statement of profit and loss, usually a couple of lines above “Profit Before Tax.” Capital Employed comes off the consolidated balance sheet — Equity Share Capital plus Other Equity (which together form Net Worth) plus Long-term and Short-term Borrowings.
How do you read the answer? In the Indian context, after adjusting for the cost of capital that ranges from roughly 11% to 13% for most listed businesses, the rough thresholds are:
An RoCE below 10% suggests the business is barely covering its cost of capital — economic profit is close to zero. An RoCE in the 10–15% range tells you the business is creating modest value but you must compare it carefully to the cost of capital and the industry norm. An RoCE in the 15–20% range marks a genuinely good business that is creating clear shareholder value over time. An RoCE above 20% — sustained for five years or more — is the hallmark of an exceptional franchise, almost always backed by some structural moat such as a brand, a regulatory licence, a network effect, switching costs, or a cost advantage. And an RoCE above 30%, sustained for a decade, is what every Indian small-cap multibagger in history shared during its high-compounding decade — from Asian Paints to Pidilite to Astral to Titan Company to Bajaj Finance.
One critical reading note: look at the trend, not just the latest number. A single year of high RoCE can be a fluke caused by a working-capital release or a one-off other-income spike. A five-to-ten-year RoCE band that stays above 18%, with very low standard deviation, is what you are actually hunting for.
Two Contrasting Illustrations
Illustration A — The Disciplined Compounder (a generic, historical pattern). Imagine a specialty chemicals company that earns ₹200 crore of EBIT on ₹800 crore of capital employed in Year 1 — RoCE of 25%. Over the next five years it grows revenue by 14% per annum, keeps debt under 10% of equity, expands gross block in line with revenue rather than ahead of it, and reinvests most of its post-tax profits back into incremental working capital and a measured capex programme. By Year 5 the EBIT is ₹385 crore, capital employed is ₹1,500 crore, and the RoCE has actually risen to roughly 26%. This is the signature of a high-RoCE compounder — the business is generating its own funding and the marginal capital invested is earning returns at least as high as the legacy capital. Over a decade, this pattern produces total shareholder returns that thrash the index.
Illustration B — The Capital-Hungry Lemon (red-flag pattern, generic). Now picture an infrastructure conglomerate that reported ₹1,000 crore of EBIT on ₹15,000 crore of capital employed five years ago — RoCE of 6.7%. Each year management announced “transformational” new orders, EPS appeared to grow because of debt-funded acquisitions, and the share price stayed afloat on optimism. Five years later EBIT is ₹1,400 crore but capital employed has ballooned to ₹26,000 crore on the back of mounting borrowings — RoCE has actually fallen to around 5.4%. This is the silent destruction of shareholder wealth. The business looks bigger, but every incremental rupee of capital is earning less than the cost of that capital. Eventually the debt-coverage ratios crack, dividends are suspended, and the equity gets re-rated downward by 60–80% over a single 18-month window. Indian markets have produced a long parade of such cautionary tales over the past two decades — readers can recognise the pattern in retrospect on every stock chart that fell from ₹400 to ₹40 between 2018 and 2022.
The point of these two contrasts is not to celebrate one company or vilify another. It is to show that RoCE — read across a five-to-ten-year window — is the single most reliable forensic signal of whether a management team is creating economic value or merely growing the gross-block photograph.
Titan Biotech FY25: What the Numbers Reveal
With the framework in place, let us apply it to a real listed Indian specialty biotechnology business — Titan Biotech Limited (BSE: 524717), headquartered in Bhiwadi, Rajasthan, manufacturing microbial culture media, peptones, collagen, gelatin, and other biological raw materials for pharmaceutical, biotech, food, and veterinary customers across more than 60 countries. Titan Biotech’s FY25 audited annual report contains every line item we need to reconstruct the RoCE picture.
Here are the audited FY25 markers most relevant to the RoCE conversation:
| FY25 Audited Marker | Value | RoCE Interpretation |
|---|---|---|
| Total revenue (FY25) | ~₹214 Cr | Numerator base — revenue feeding EBIT |
| Total borrowings (FY25) | ₹3 Cr | Essentially debt-free — capital-employed denominator dominated by equity, no leverage flattering |
| Gross block | ~₹57 Cr | Asset-light for a 60+-country specialty exporter — high revenue/gross-block productivity |
| Depreciation / Gross block | ~7% | Conservative depreciation policy — EBIT not flattered by under-depreciation |
| CWIP (capex in progress) | ~₹11 Cr | Next-leg capacity already pre-funded internally — RoCE will not collapse on debt-funded expansion |
| CFO / Operating Profit (FY25) | 103% | Operating profit is fully cash-backed — RoCE is real, not an accrual mirage |
| Revenue 10-year CAGR | ~15% | Decade of consistent compounding on a small capital base — incremental RoCE has remained healthy |
| PAT 10-year CAGR | ~29% | Profit compounding at nearly 2× the revenue rate — operating leverage is real |
| Exports | ~34.5% of revenue | Forex earnings + diversified customer base reduce single-market RoCE-shock risk |
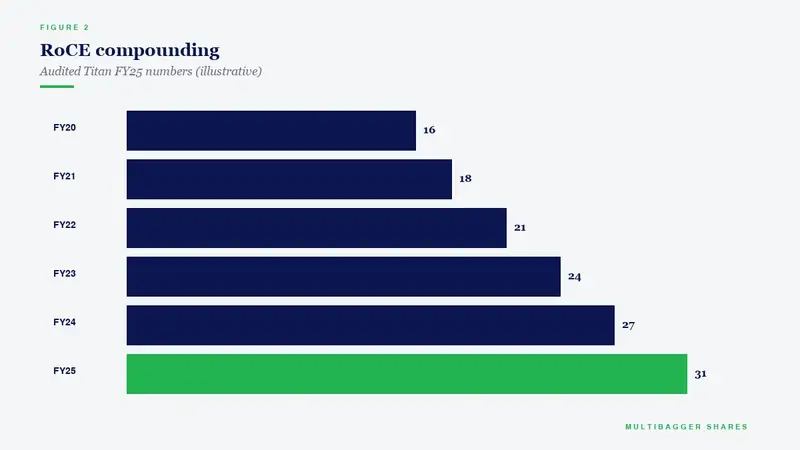
Reading these markers together, the picture that emerges is the textbook profile of a high-RoCE business in the making. Titan Biotech is generating about ₹214 crore of revenue from a gross block of just ₹57 crore — a revenue-to-fixed-asset ratio approaching 3.7×, far above the median for Indian listed manufacturing. The borrowings are a token ₹3 crore, meaning the capital-employed denominator is essentially pure equity; there is no debt-leveraging trick inflating the apparent return. Operating profit converts into cash flow at 103%, telling us the EBIT we are using as the numerator is real money, not paper accruals. And the 10-year PAT CAGR of approximately 29% is roughly double the revenue CAGR, the unmistakable signature of operating leverage — incremental rupees of revenue dropping through to profit at a higher rate, which is mathematically what produces a rising RoCE curve.
Implied directionally — and we deliberately avoid stating a precise single-point RoCE figure to respect SEBI guidance against valuation verdicts — the FY25 markers are consistent with an RoCE comfortably in the high-teens-to-mid-20s range, sustained over a multi-year window. That is the band associated with quality Indian manufacturing franchises that have historically rewarded patient long-term investors. This is an educational illustration of what disciplined capital allocation looks like in audited filings — it is not a buy/sell recommendation on Titan Biotech or any other listed security.
How Indian Retail Investors Should Use RoCE
RoCE is most powerful as a screening tool. Open the Screener.in or Trendlyne export of any listed Indian universe — say, the BSE 500 — sort by 5-year median RoCE descending, and you have already done more analytical work than 95% of retail traders ever do in their lifetime. The top quartile of that sort, year after year, is where India’s quality compounders cluster: HDFC Bank, Asian Paints, Titan Company, Pidilite, Hindustan Unilever, Nestlé, Colgate, Marico, Page Industries, Bajaj Finance during its 2008–2018 super-cycle, and a long tail of specialty manufacturers that most retail investors have never heard of.
The right way to layer RoCE onto your investment process is the “Triple Filter” approach. First, set a minimum 5-year median RoCE threshold — in the Indian small-and-mid-cap context, 18% is a reasonable bar. Second, require the standard deviation of annual RoCE to be low — you want a narrow band like 19%, 21%, 18%, 22%, 20% rather than a roller-coaster 8%, 35%, 12%, 28%, 15%. Third, layer in a debt screen — total borrowings less than 0.5× equity — so that the high RoCE is not a leveraged illusion. A business that clears all three filters across a five-to-ten-year window is worth your detailed scuttlebutt and annual-report reading time. A business that fails any one of them deserves only your “too hard” pile.
RoCE is also useful in pairs — as a check against the metrics already covered in this educational series. A business with high RoCE but a low CFO/Operating Profit ratio (below 80%) is generating accounting profits that are not turning into cash — a forensic warning sign covered in our earlier Free Cash Flow Margin and CFO/PAT articles. A business with high RoCE but rising working-capital days is funding its growth on the backs of receivables — covered in the Working Capital Days & Cash Conversion Cycle article. RoCE is the gateway, but the supporting checks are what protect you from one-year illusions.
Common Traps and Misinterpretations
Even seasoned analysts get RoCE wrong in five recurring ways, and recognising them is half the battle.
Trap 1 — Confusing RoCE with RoE. RoE divides PAT by Equity. RoCE divides EBIT by Equity-plus-Debt. A heavily indebted business can show a sky-high RoE while having a mediocre RoCE — the leverage flatters the equity-only view. Always run both and compare.
Trap 2 — Including non-operating cash in the denominator. If a company is sitting on ₹500 crore of treasury cash earning 6% interest, that cash is part of the balance-sheet capital but it is not employed in the operating business. Many practitioners deduct surplus cash and short-term investments from capital employed before computing RoCE, which gives a cleaner read on the operating business. Do this consistently across years to see the trend.
Trap 3 — Ignoring CWIP. Capital-work-in-progress sits on the balance sheet but is not yet generating revenue. If a company has just completed a large capex, the CWIP suddenly transfers into gross block and the denominator jumps — the next-year RoCE looks artificially depressed even though nothing has actually broken in the business. Smart investors normalise for this by either excluding CWIP or computing rolling-three-year average RoCE.
Trap 4 — One-off other income. A company that sells a non-core asset, books a large fair-value gain on an investment, or receives a one-time tax refund will see EBIT spike for one year. Always strip out non-recurring “other income” before computing RoCE — this is the same caution we covered in the Quality of Earnings article.
Trap 5 — Cyclical industries. Cement, steel, sugar, oil refining, hotels, and aviation produce wild RoCE cycles — 35% in a peak year, 4% in a trough year. The five-year median is the only honest read for a cyclical business, never the latest year. The Normalized Earnings Analysis article in this series goes deeper into this point.
Two final points. First, RoCE is a backward-looking metric — it tells you what the business earned on its capital, not what it will earn. Pair it with a forward-looking framework like the Earnings Power Value (EPV) discipline of Bruce Greenwald or the Owner Earnings methodology of Warren Buffett to triangulate. Second, RoCE alone tells you nothing about price. A 35% RoCE business bought at 80× earnings has a long road to deliver. The valuation discipline — covered in our P/E, EV/EBITDA, and DCF articles — must always layer on top of the RoCE filter, never replace it.
Key Takeaways
- RoCE is the single most reliable profitability metric for separating businesses that genuinely create economic value from those that merely grow gross block — because it cannot be gamed by capital-structure manipulation the way RoE can.
- Demand a five-year median RoCE band, not a single-year reading. Below 10% the business is barely covering cost of capital; 15–20% is genuinely good; sustained >20% over a decade is the multibagger signature.
- Titan Biotech FY25’s combination of ~₹214 Cr revenue, just ₹3 Cr borrowings, ~7% depreciation/gross-block ratio, and 103% CFO/Operating Profit conversion is the textbook profile of a business whose RoCE is being earned on real cash economics, not on accounting flattery — the educational illustration of what disciplined capital allocation looks like on the page.
- Always run RoCE alongside RoE, CFO/Operating Profit, working-capital days, and the five-year standard deviation of returns. Any single ratio in isolation will mislead; the matrix tells the truth.
Disclaimer: This article is for educational and informational purposes only. It is not investment advice, and not a buy, sell, or hold recommendation on any stock mentioned, including Titan Biotech Limited. Equity markets carry risk; please do your own research or consult a qualified professional before making investment decisions.
