Skip to content

Manish Goel Stocks

Redefining Investing …

Menu

  • Home Page
  • Blogs
  • Past Performance
  • About
  • Multibagger® Trademark
  • Awards & Certificates
  • Contact/Subscribe Now
  • Latest News

Blog

The Bias Blind Spot: Pronin, Lin & Ross (2002)
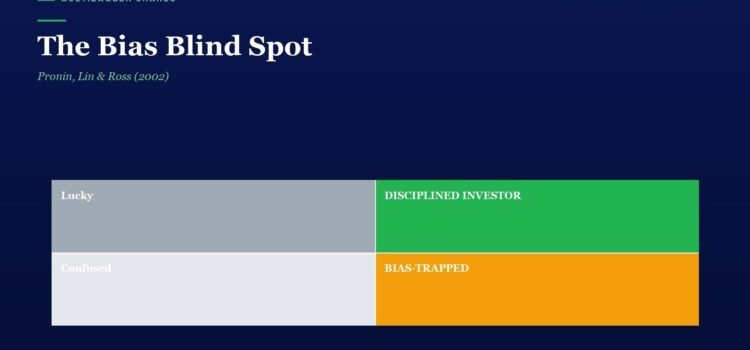
Title 'The Bias Blind Spot' with a two-by-two color grid labeled Lucky, Disciplined Investor, Confused and Bias-Trapped

In April 2002, Stanford social psychologist Emily Pronin and her colleagues Daniel Lin and Lee Ross published a paper in the Personality and Social Psychology Bulletin with a deceptively simple title: “The Bias Blind Spot: Perceptions of Bias in Self

Manish GoelMay 18, 2026 Blog Read more

Vigil Mechanism & Whistleblower Policy Disclosures: SEBI LODR Regulation 22 and Companies Act §177(9)

Horizontal timeline from FY21 to FY25 on a dark blue background, showing milestones: Compliance, Disclosure, Audit clean, Board change, All boxes.

Table of Contents Toggle The Most Powerful Governance Signal That 99% of Indian Retail Investors Never Read What Is a Vigil Mechanism? The Regulatory Framework: Three Overlapping Indian Laws The Five-Component Disclosure Checklist Every Indian Investor Should Run Two Contrasting

Manish GoelMay 18, 2026 Blog Read more

Buffett’s Four Filters: The 1977 Berkshire Letter Acquisition Checklist Refined in the 1994 Owner’s Manual

Hero section introducing Buffett's Four Filters with a four-block infographic: Trader (gray), Compounding (green), Drift (light gray), Speculator (orange).

Warren Buffett does not actually invest. He filters. The investment is what remains after four filters have eliminated everything that does not belong. He has said this so often, in so many letters and at so many annual meetings, that

Manish GoelMay 18, 2026 Blog Read more

The Ostrich Effect: Karlsson, Loewenstein & Seppi’s 2009 NBER Bias Behind Why Indian Investors Stop Checking Their Portfolios During Corrections

Hero header with the title 'The Ostrich Effect' and a 2×2 color grid labeled: Lucky (gray), Disciplined Investor (green), Confused (light gray), and Bias-Trapped (orange).

For more than a decade, behavioural economists have documented a peculiar — and counter-intuitive — pattern in how human beings handle financial pain. When markets rise, investors check their portfolios obsessively. When markets fall, they stop checking altogether. This is

Manish GoelMay 17, 2026 Blog Read more

Board Meeting Frequency: SEBI LODR Regulation 17(2) and the Forensic Governance Engagement Test

Timeline graphic on a dark blue background labeled 'Board Meeting Frequency' showing FY21 to FY25 milestones with green dots: FY21 Compliance, FY22 Disclosure, FY23 Audit clean, FY24 Board change, FY25 All boxes.

India’s retail investor base has gone from roughly 3 crore unique PAN holders at NSE in March 2019 to over 11 crore in 2025 — a near four-fold expansion in six years. Yet SEBI’s own landmark 2024 study on individual

Manish GoelMay 17, 2026 Blog Read more

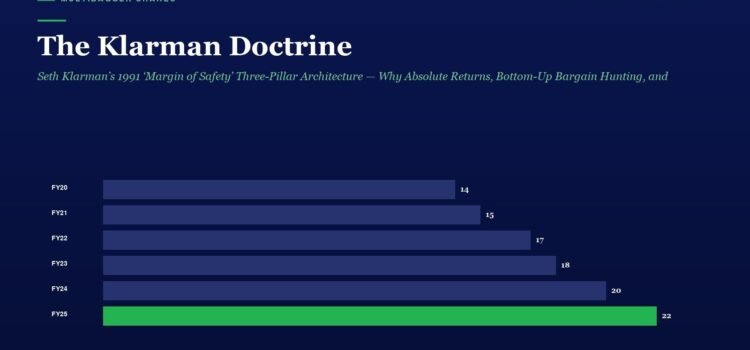
The Klarman Doctrine: Seth Klarman’s 1991 ‘Margin of Safety’ Three-Pillar Architecture — Why Absolute Returns, Bottom-Up Bargain Hunting, and Risk Aversion Define the Real Value Investor’s Edge

Infographic titled The Klarman Doctrine with a horizontal bar chart of yearly returns FY20–FY25 (14, 15, 17, 18, 20, 22) in blue/green on a dark blue background.

Seth Klarman is the most successful value investor most Indian retail investors have never heard of. His 1991 book Margin of Safety is out of print, second-hand copies routinely trade for thirty thousand rupees on eBay, and his Baupost Group

Manish GoelMay 17, 2026 Blog Read more

Myopic Loss Aversion (Benartzi & Thaler 1995): Why Indian Retail Investors Sabotage Long-Term Returns by Checking Portfolios Too Often

Infographic slide showing a 2x2 grid of investor archetypes: Lucky (gray), Disciplined Investor (green), Confused (light gray), and Bias-Trapped (orange).

In 1995, two behavioural economists — Shlomo Benartzi and Richard Thaler — published a paper that won Thaler the 2017 Nobel Memorial Prize in Economic Sciences. Its title was deceptively simple: “Myopic Loss Aversion and the Equity Premium Puzzle”. The

Manish GoelMay 16, 2026 Blog Read more

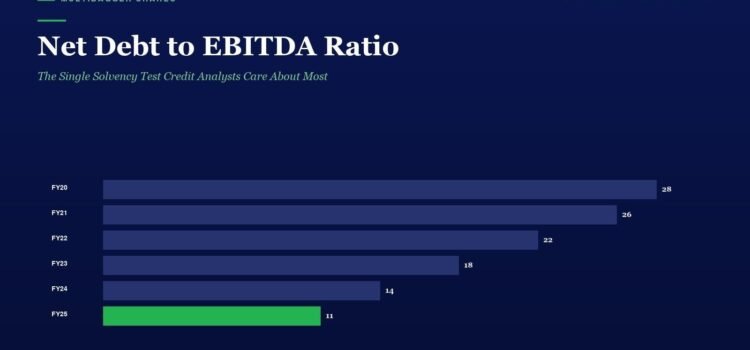
Net Debt to EBITDA Ratio: The Single Solvency Test Credit Analysts Care About Most

Infographic bar chart of net debt to EBITDA ratio by fiscal year from FY20 to FY25, with values 28, 26, 22, 18, 14, and 11 (FY25 highlighted in green).

Table of Contents Toggle Why this one ratio explains more about a company’s survival odds than any other line on the balance sheet What is Net Debt to EBITDA? A plain-English definition The formula — and the four moving pieces

Manish GoelMay 16, 2026 Blog Read more

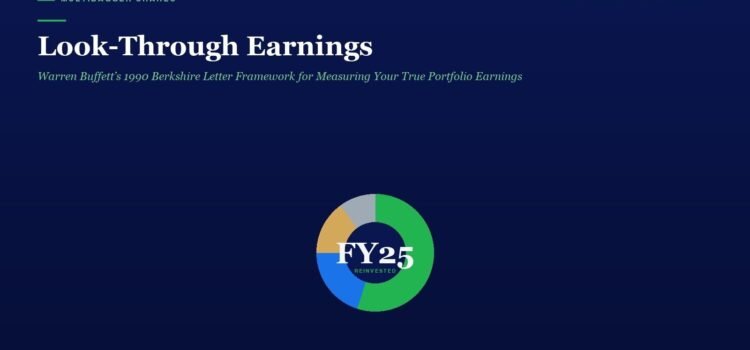
Look-Through Earnings: Warren Buffett’s 1990 Berkshire Letter Framework for Measuring Your True Portfolio Earnings

Hero header with title 'Look-Through Earnings' and subtitle, featuring a central multicolor donut chart labeled FY25 reinvested on a dark blue background.

Open a brokerage statement in India today and you will see one earnings number that the system insists is “yours” — the dividend credit. Everything else — the buybacks, the retained profits, the capex funded out of internal accruals, the

Manish GoelMay 16, 2026 Blog Read more

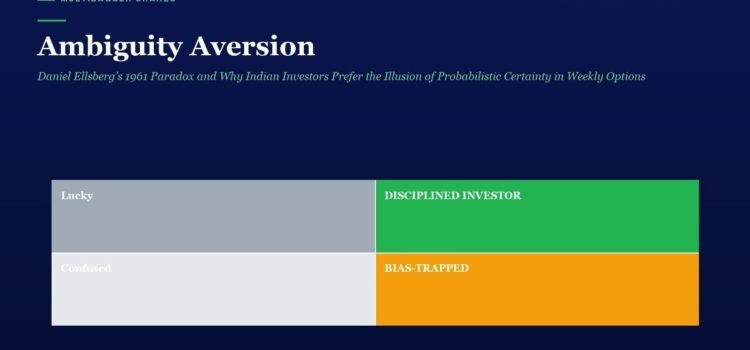
Ambiguity Aversion: Daniel Ellsberg’s 1961 Paradox and Why Indian Investors Prefer the Illusion of Probabilistic Certainty in Weekly Options Over the Honest Uncertainty of Long-Term Equity

Two-by-two chart of investor types: Lucky (top-left), Disciplined Investor (top-right), Confused (bottom-left), Bias-Trapped (bottom-right).

One paragraph summary. Daniel Ellsberg published a four-page paradox in 1961 that did to Leonard Savage’s expected-utility theory what Kahneman and Tversky would later do to rational-choice theory. Given a choice between an urn whose composition is known and one

Manish GoelMay 15, 2026 Blog Read more

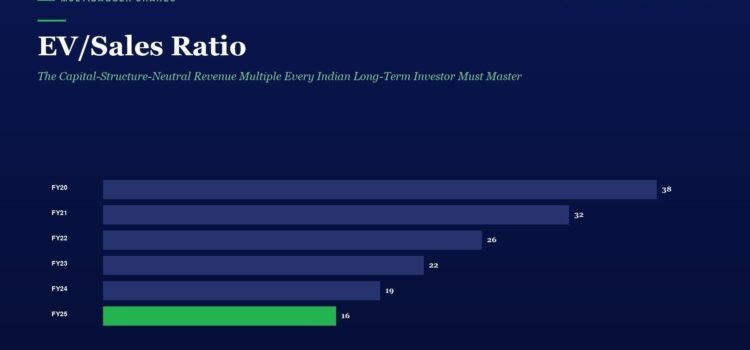
EV/Sales Ratio: The Capital-Structure-Neutral Revenue Multiple Every Indian Long-Term Investor Must Master

Bar chart titled EV/Sales Ratio showing FY20 38, FY21 32, FY22 26, FY23 22, FY24 19, FY25 16; FY25 bar highlighted in green.

The number of registered investors on the National Stock Exchange has multiplied from roughly 3 crore in 2020 to more than 11 crore by early 2026 — a once-in-a-generation broadening of equity ownership in India. Yet the same SEBI study

Manish GoelMay 15, 2026 Blog Read more

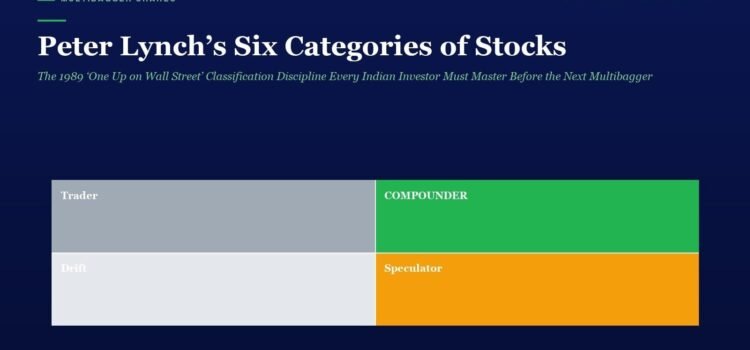
Peter Lynch’s Six Categories of Stocks: The 1989 ‘One Up on Wall Street’ Classification Discipline Every Indian Investor Must Master Before the Next Multibagger Hunt

Header text 'Peter Lynch’s Six Categories of Stocks' with a four-block grid: Trader (gray), Compounder (green), Drift (light gray), Speculator (orange).

If you have ever stared at a list of forty Indian stocks in your demat and felt a low-grade panic — “what exactly am I holding, and what should I expect each one to do?” — then you are exactly

Manish GoelMay 15, 2026 Blog Read more

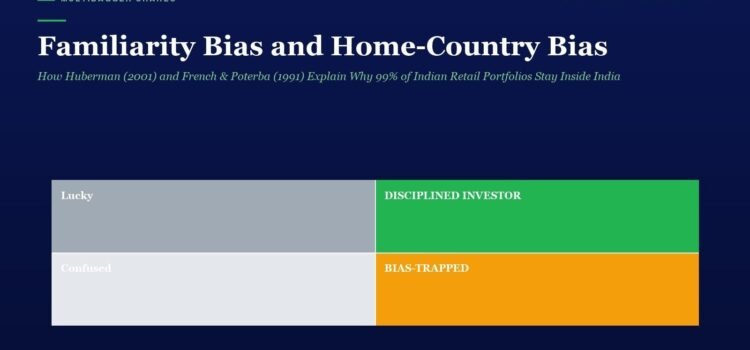
Familiarity Bias and Home-Country Bias: How Huberman (2001) and French & Poterba (1991) Explain Why 99% of Indian Retail Portfolios Stay Inside India

Hero header reading 'Familiarity Bias and Home-Country Bias' with pale green subtitle on a dark blue background; below is a four-panel infographic: top-left gray 'Lucky', top-right green 'Discipined Investor', bottom-left light gray 'Confused', bottom-right orange 'Bias-Trapped'.

An investor in Mumbai who buys only Mumbai-listed equities, who concentrates 18% of his portfolio in his employer’s shares, who has never opened a Liberalised Remittance Scheme account, and who has zero exposure to the United States, Europe, Japan, or

Manish GoelMay 14, 2026 Blog Read more

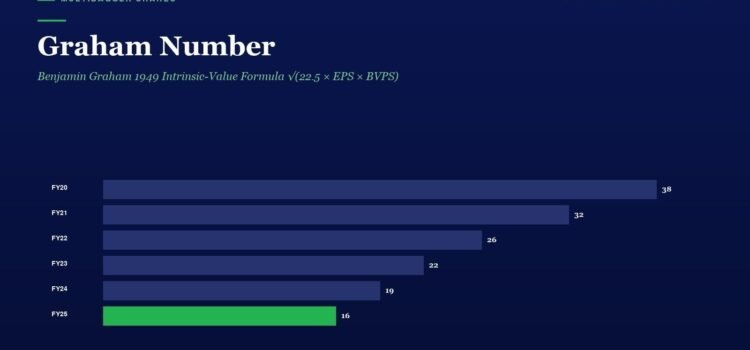
Graham Number: Benjamin Graham 1949 Intrinsic-Value Formula √(22.5 × EPS × BVPS)

Horizontal bar chart titled 'Graham Number' showing yearly values from FY20 to FY25 on a dark blue background; bars (FY20: 38, FY21: 32, FY22: 26, FY23: 22, FY24: 19, FY25: 16) with FY25 bar in green.

Among India’s 11 crore registered equity investors as of early 2026, fewer than one in fifty can write down Benjamin Graham’s square-root intrinsic-value formula from memory. That single statistic explains why so much of the ₹1.81 lakh crore of cumulative

Manish GoelMay 14, 2026 Blog Read more

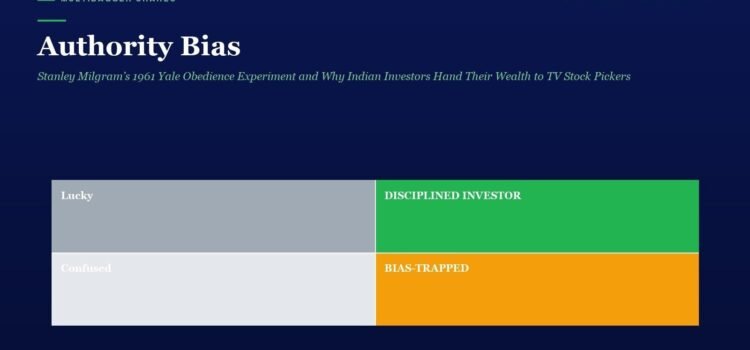
Authority Bias: Stanley Milgram’s 1961 Yale Obedience Experiment and Why Indian Investors Hand Their Wealth to TV Stock Pickers

Two-by-two color grid showing four investor attitudes: Lucky (gray), Disciplined Investor (green), Confused (light gray), Bias-Trapped (orange) — from an article titled Authority Bias.

If you have ever bought a stock within ten minutes of a celebrity portfolio manager naming it on a business-news channel, you have not made a research-driven decision. You have obeyed an authority figure. The instinct is so deep, so

Manish GoelMay 14, 2026 Blog Read more
  • « Previous
  • Next »

Translate:

My Portfolio CAGR is 112% as on 31.10.2024
My Contract Note of 28.06.2024 showing A.K. Spintex buying at 185 average

Telegram Link - https://telegram.me/longtermequityy

Manish Goel in ABP Live
Manish Goel in LiveMint
Bhopal Samachar

My Other Posts

  • The Share-Price Illusion: Why a ₹10 Share Is Not Cheap and a ₹1,00,000 Share Is Not Costly
  • The Cube of Gold That Cannot Grow: Warren Buffett’s Famous Lesson on Assets That Work and Assets That Just Sit
  • The Voting Machine and the Weighing Machine: Benjamin Graham’s Famous Lesson on Why Popularity Fades and Profits Win
  • Never Invest with Borrowed Money: Warren Buffett’s Simplest Rule for Surviving the Stock Market
  • Whose Report Card Are You Filling? Warren Buffett’s Inner Scorecard for the Everyday Investor
  • Know What You Own: Peter Lynch’s Two-Minute Test Before You Buy Any Stock
  • The Investor Who Never Has to Sell: Benjamin Graham’s Safety-Cushion Rule
  • Only When the Tide Goes Out: Warren Buffett’s Famous Lesson on How Good Times Hide Weak Companies
  • When Everyone at the Party Has a Stock Tip: Peter Lynch’s Famous Cocktail Party Theory
  • Why Good Companies Do Foolish Things: Warren Buffett’s ‘Institutional Imperative’ in Plain English
  • Forget the Forecast: Why the Best Investors Ignore the Economy and Watch the Business Instead
  • The Toll Booth Business: Why Some Companies Quietly Collect a Small Fee From a Huge Crowd
  • Boring Is Beautiful: Why Dull, Overlooked Businesses Often Make the Best Investments
Economic Times Industry Leaders Award for Manish Goel
In last 5 years, Out of my these shortlisted 30 companies, Hazoor Multiprojects Multiplied 21 Times in 2 Years, and Sangam Advisors (Waaree Renewables Technologies ltd) Multiplied 450 Times in 5 Years.
Copyright © 2026 Manish Goel Stocks. All rights reserved. Theme Spacious by ThemeGrill. Powered by: WordPress.
  • Home Page
  • Blogs
  • Past Performance
  • About
  • Multibagger® Trademark
  • Awards & Certificates
  • Contact/Subscribe Now
  • Latest News