If you have ever stared at a list of forty Indian stocks in your demat and felt a low-grade panic — “what exactly am I holding, and what should I expect each one to do?” — then you are exactly the reader Peter Lynch wrote One Up on Wall Street (1989) for. Long before the words “screener,” “factor model,” or “quant filter” entered Indian retail vocabulary, Lynch — manager of the Magellan Fund from 1977 to 1990, where he compounded capital at 29.2 percent a year — proposed a deceptively simple discipline: before you ever talk about price, classify the company.
His insight was that the same stock can be brilliant or disastrous depending on what kind of business it actually is. A 25 P/E is a steal in a true fast grower; the same multiple is a trap in a fading slow grower. A 30 percent drawdown in a stalwart is a refill opportunity; an identical drawdown in an asset play needs an entirely different worksheet. The whole edifice of Indian retail mistakes — over-paying for cyclicals at peak earnings, abandoning compounders during a bad quarter, mistaking a turnaround for a stalwart — collapses into one diagnosis: the investor never bothered to ask which category the stock belongs to.
The Six Categories, Plainly Stated
Lynch’s framework partitions every public company on earth into one of six buckets. The bucket determines the question you must ask, the multiple you should accept, and the catalyst you should monitor. Get the bucket right and the rest of investing becomes mechanical; get the bucket wrong and even Buffett’s checklist will not save you.
1. Slow growers. Mature companies whose revenue and earnings grow at roughly the rate of GDP — call it 4 to 8 percent annually in India. They typically pay generous dividends because there is little to reinvest in. Indian examples one might think of: large utilities, mature FMCG distribution arms, public-sector heavyweights past their growth phase. The ONLY reason to own a slow grower is the dividend yield. If the dividend stops growing or gets cut, the entire investment thesis collapses. Lynch’s discipline: don’t pretend a slow grower is a fast grower because the chart had a good month.
2. Stalwarts. Large, established quality businesses that grow earnings at 10 to 12 percent annually. The Indian retail mind tends to associate this with the largest FMCG and consumer-staples names. They rarely become true ten-baggers from current size, but they offer something almost as valuable: durable downside protection. The right way to own a stalwart, per Lynch, is to buy on a 30 to 50 percent decline, hold for 30 to 50 percent gain, and rotate. Stalwarts are the portfolio’s shock absorbers, not its rocket fuel.
3. Fast growers. Aggressive young or mid-sized companies growing at 20 to 25 percent or more annually. This is where Lynch made most of his ten-baggers. The Indian small-cap and select mid-cap landscape is unusually rich in this category — many promoter-driven specialty manufacturers, niche export businesses, and disciplined branded-products companies fit this profile. The risk is straightforward: fast growers either keep growing fast or they don’t. The moment growth decelerates without a structural reason, the multiple compresses violently. Lynch’s question: can the company keep doing what it just did, in markets large enough to absorb it, without taking on disproportionate financial risk?
4. Cyclicals. Companies whose sales and profits rise and fall with predictable patterns tied to the broader economy or commodity cycles. Steel, cement, automobiles, oil refiners, sugar — the Indian roster is long and well-known. The deadliest mistake retail investors make in this bucket is to fall in love with peak earnings. A cyclical at trailing 8x P/E with record EPS is rarely cheap; it is usually expensive at the top of its own cycle. Lynch’s discipline: in cyclicals, a high P/E often signals the bottom of the cycle (because earnings have collapsed) and a low P/E often signals the top.

5. Turnarounds. Companies that have been knocked down — sometimes deservedly — and might recover. They can produce spectacular returns when they work, total losses when they don’t. Examples include companies emerging from one-off scandals, cleaning up balance sheets after a bad capex cycle, or repairing a broken segment under new management. Turnarounds are Lynch’s “no-correlation” bucket — their performance is mostly independent of the market index, which is why they are useful. But the diligence bar is severe: the investor needs an explicit, measurable thesis on what specifically will improve, by when, and what the cash buffer is in the meantime.
6. Asset plays. Companies whose value is not in current earnings but in something hidden — surplus real estate, a forgotten subsidiary, a tax-loss carryforward, a long-amortised brand, an under-utilised capex. The market often misses these because they don’t show up in screeners that filter on PAT growth or P/E. Asset plays in India have historically clustered around old textile mills sitting on metro-city land, conglomerates with unconsolidated stakes, and companies whose capacity expansions have not yet ramped. The work is forensic: read the notes to accounts and the schedule of fixed assets, not the front page.
Why the Categories Matter More Than the Multiples
The deepest insight in Lynch’s framework is not which bucket is “best.” It is that buckets demand different exit triggers. A stalwart that has rallied 40 percent should be partially sold. A fast grower compounding earnings at 25 percent should be left alone. A cyclical at peak EPS should be reduced even if it looks “cheap.” A turnaround that has actually turned should be re-rated against the stalwart bucket; if it now belongs there, the fast-grower mindset of “let it run” is exactly the wrong instinct.
This is why the same Indian retail investor who confidently held an FMCG stalwart through six years of underperformance will panic-sell a fast grower after a single weak quarter — because the investor never had a clear category in mind. The bucket framework is not academic. It is the operational discipline that prevents you from applying turnaround psychology to a stalwart, or stalwart psychology to a cyclical.
Lynch was emphatic that companies migrate between buckets over time. Yesterday’s fast grower becomes today’s stalwart. A long-time stalwart that loses its growth rate may slip to slow grower. A cyclical at the top of its earnings curve can mimic a fast grower for two reporting cycles before reverting. The investor’s job is to revisit the category every annual report and ask, honestly, whether the company still belongs where it was filed.
How Titan Biotech’s FY25 Numbers Illustrate the Stalwart-to-Fast-Grower Continuum
Take Titan Biotech (BSE: 524717), a specialty-biotech manufacturer that exports to roughly 60 countries, as a clean educational illustration. The audited FY25 numbers map onto Lynch’s framework with unusual clarity, and the exercise demonstrates how the categories work in practice rather than as abstract theory.
The company’s ten-year revenue compound annual growth rate sits near 15 percent, with a corresponding ten-year PAT CAGR around 29 percent. By Lynch’s own definitions, a 15 percent top line places it above the 10 to 12 percent stalwart band and inside the 20-plus percent fast-grower band on earnings. This profile of mid-teens revenue with high-twenties earnings is exactly what Lynch called “operating leverage on a disciplined manufacturing base” — the bottom line growing meaningfully faster than the top because incremental capacity drops more profit per rupee of sales.
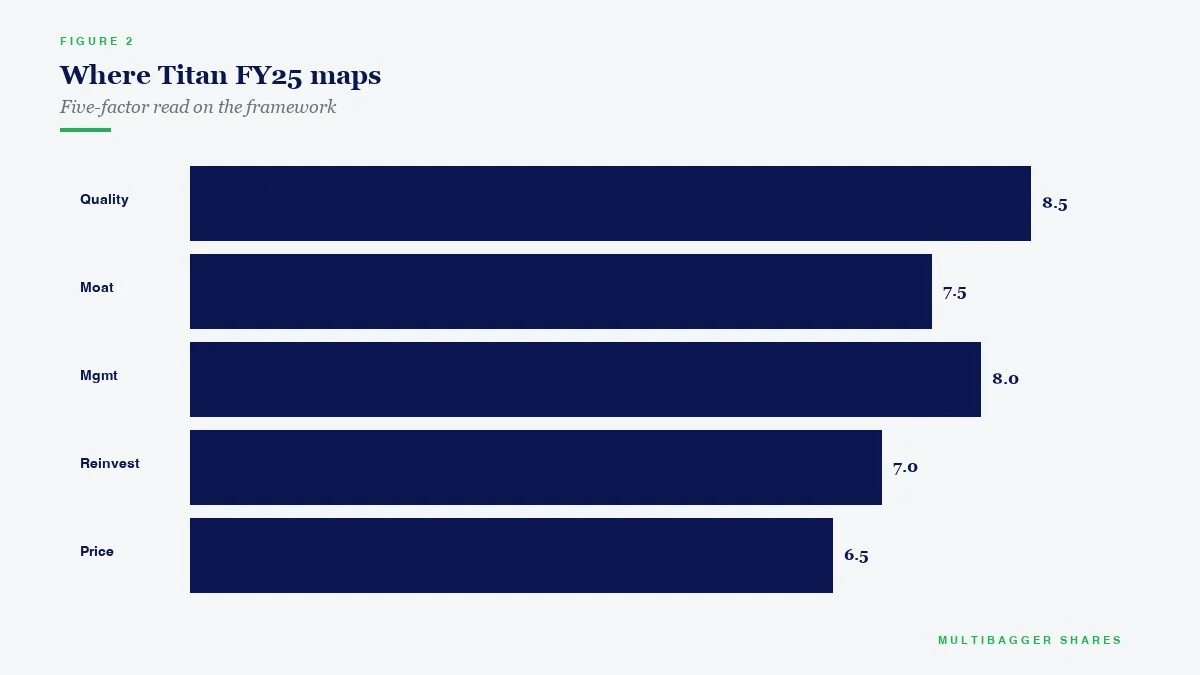
FY25 EBITDA margin of approximately 18 to 22 percent on a specialty-biotech base shows the kind of pricing discipline a stalwart would deliver, while the growth rates point to a fast grower. The ratio of cash flow from operations to operating profit at roughly 103 percent is, in Lynch’s vocabulary, the single most important credibility check: a fast grower whose CFO consistently lags reported EBITDA is almost always inflating its growth. Here the cash conversion comfortably exceeds the reported profit, which is what the framework wants to see.
Total borrowings of around three crore rupees against a strong net worth means the balance sheet is, for practical purposes, unleveraged. Lynch’s repeated warning about fast growers was that the failure mode is almost always financial: the company keeps borrowing to fund growth, the cycle turns, and the leverage destroys the equity. A near-debt-free fast grower side-steps that failure mode entirely. Capacity utilisation around 75 to 80 percent and capital work-in-progress near 11 crore rupees on a gross block of about 57 crore rupees signal a company still building runway rather than one that has exhausted it — a diagnostic Lynch would describe as “the next leg already paid for.”
Promoter holding above 70 percent, a chairperson-independent governance structure, and conservative managerial remuneration around 4.56 crore rupees against PAT round out the picture of a company whose capital allocation profile genuinely matches the fast-grower-with-stalwart-discipline classification rather than the more common Indian small-cap mistake of fast-grower growth funded by fast-grower leverage.
The Lynch exercise here is straightforward. A stalwart classification would imply 10 to 12 percent steady earnings growth, low single-digit revenue growth, and dividend-led return; a fast-grower classification would imply 20-plus percent earnings growth, 15-plus percent revenue growth, expanding capacity, and reinvestment-led return. Titan Biotech FY25’s audited profile sits cleanly inside the fast-grower bucket on growth metrics, while exhibiting stalwart-quality discipline on the balance sheet, governance, and cash-conversion fronts. That hybrid is exactly what Lynch identified as the most desirable variant of the fast-grower category: high growth without the financial fragility that usually accompanies it.
The Practical Takeaway for Indian Long-Term Investors
Pull up your portfolio this weekend and assign every holding to one of Lynch’s six buckets. Be honest. The compounder you bought in 2019 may have migrated from fast grower to stalwart. The cyclical you label “growth” because earnings doubled in two years is almost certainly mis-classified. The “turnaround” that has now genuinely turned should be re-tested against the stalwart benchmark before you continue to hold it on turnaround logic. The asset play you have not revisited since purchase needs a fresh inventory of what hidden value remains and what has already been unlocked.
Once every position has a clean category, three operational rules fall out almost automatically. First, your exit trigger differs by bucket — partial profits in stalwarts, leave fast growers alone while growth holds, reduce cyclicals at peak earnings, hold turnarounds only as long as the specific repair thesis is intact. Second, your position-sizing differs — stalwarts and the cleanest fast growers can carry larger weights; turnarounds and asset plays should be smaller, because the failure mode is total. Third, your monitoring cadence differs — stalwarts need a quarterly glance, fast growers need careful tracking of growth deceleration, cyclicals need commodity-cycle awareness, turnarounds need monthly milestone tracking, and asset plays need patience measured in years.
The framework is not glamorous and it does not promise a ten-bagger by next Diwali. What it does is impose a discipline that prevents the most expensive Indian retail mistake of all: applying the wrong mental model to a stock you already own. Lynch wrote that the average investor’s edge over the professionals is the freedom to wait, the freedom to concentrate, and the freedom to ignore the index. That edge is only realisable once you know, with clarity, what kind of stock each holding actually is.
Disclaimer: This article is for educational and informational purposes only. It is not investment advice, and not a buy, sell, or hold recommendation on any stock mentioned, including Titan Biotech Limited. Equity markets carry risk; please do your own research or consult a qualified professional before making investment decisions.
