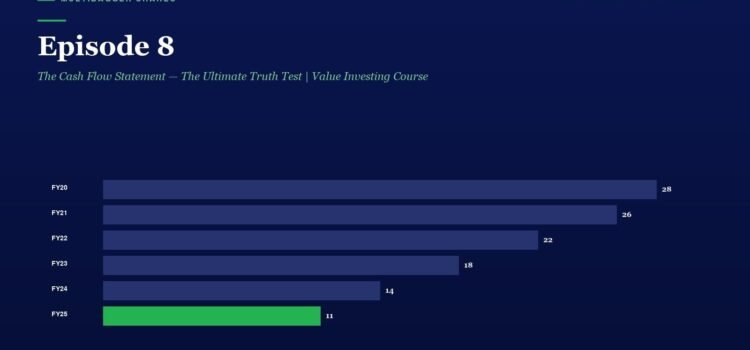
Contingent Liabilities

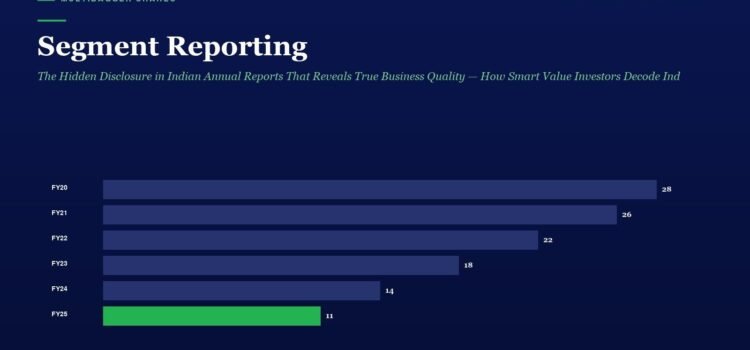
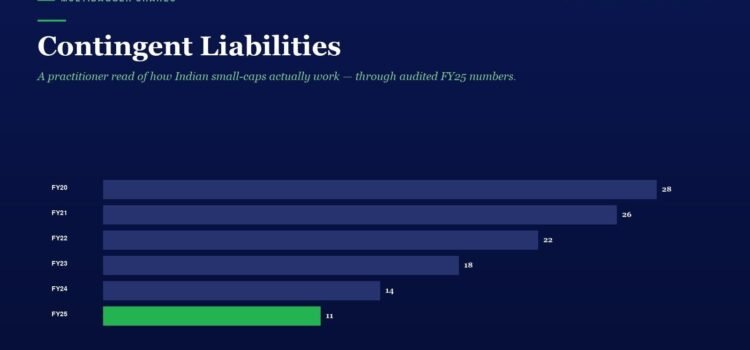
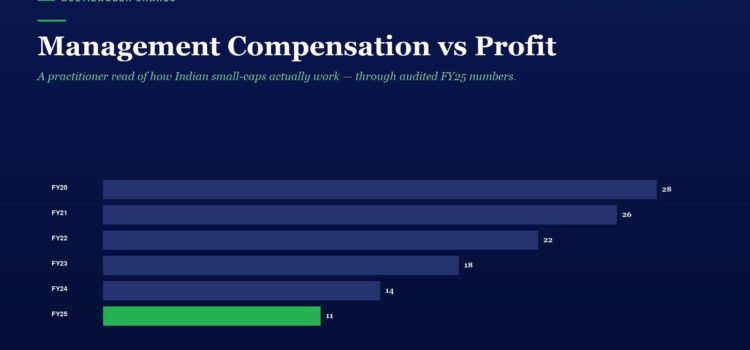
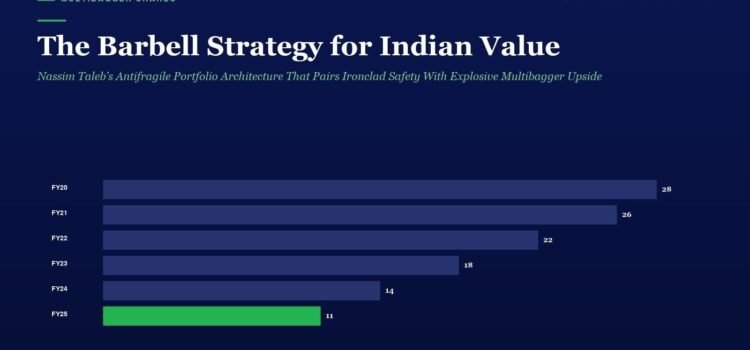
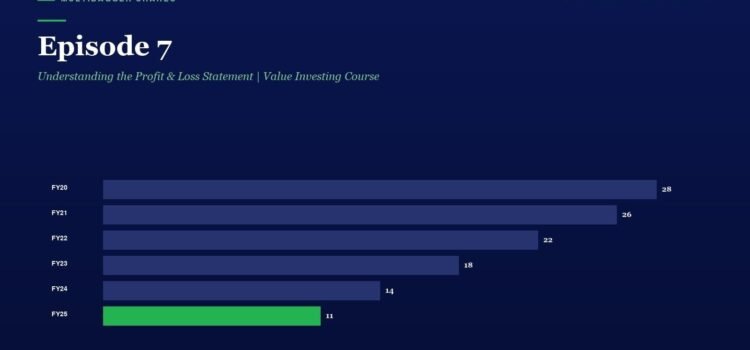
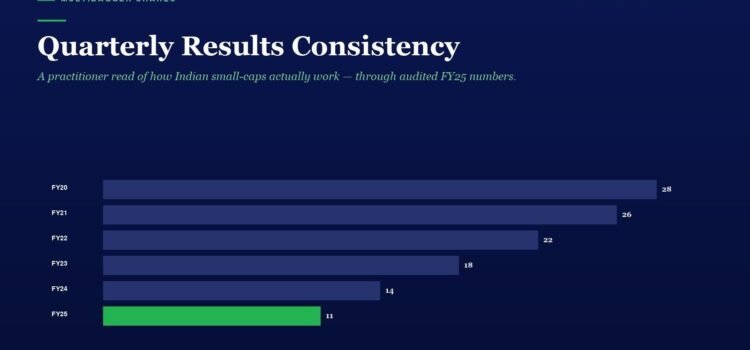
Bar chart titled Contingent Liabilities showing FY20 to FY25 values: FY20 28, FY21 26, FY22 22, FY23 18, FY24 14, FY25 11; the FY25 bar is highlighted in green.

Every investor obsesses over the Profit & Loss statement. A few smart ones dig into the Balance Sheet. But almost nobody — and I mean nobody outside of forensic accountants and seasoned value investors — reads the one disclosure that

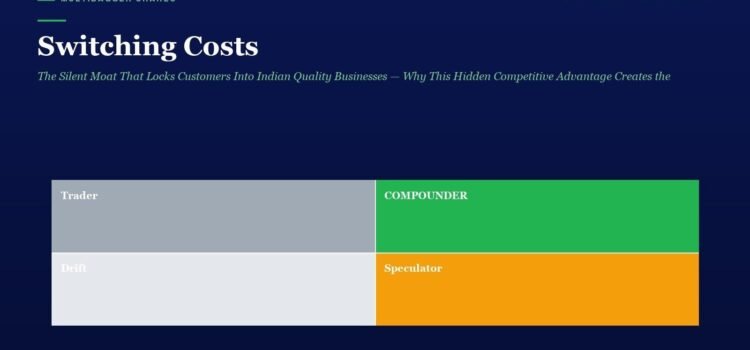
Cement Sector Analysis Framework: The 8-Factor Checklist Every Indian Value Investor Must Use to Separate Multibagger Cement Stocks from Value Traps in India’s ₹2 Lakh Crore Super-Cycle

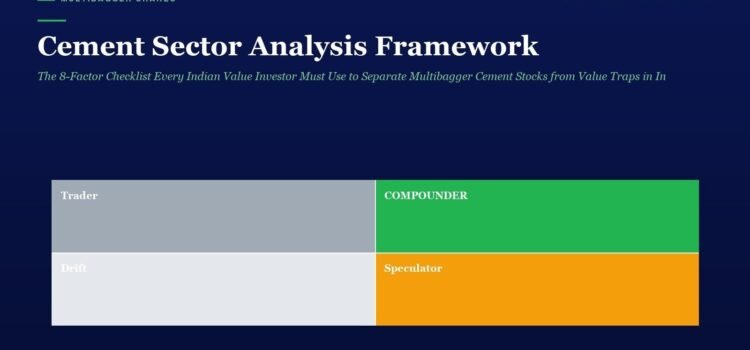
Two-by-two cement investment framework: Trader (left, gray), Compounder (right, green); Drift (left, light gray), Speculator (right, orange).

📅 Published 18 April 2026 (Saturday) Table of Contents Toggle Why Cement Is India’s Most Underrated Multibagger Hunting Ground in 2026 The 8-Factor Cement Sector Analysis Framework Factor 1 — Installed Capacity & Utilisation Ratio Factor 2 — Geographic Footprint

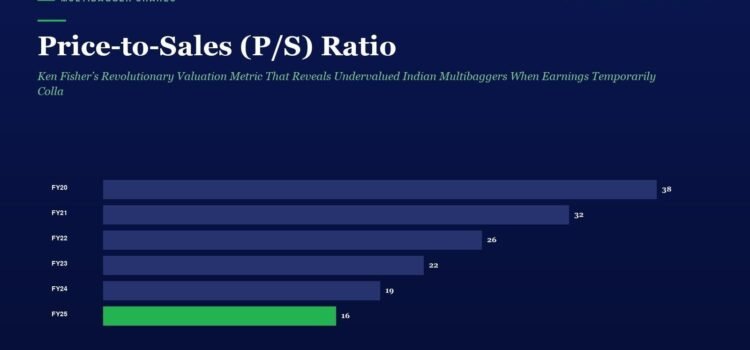
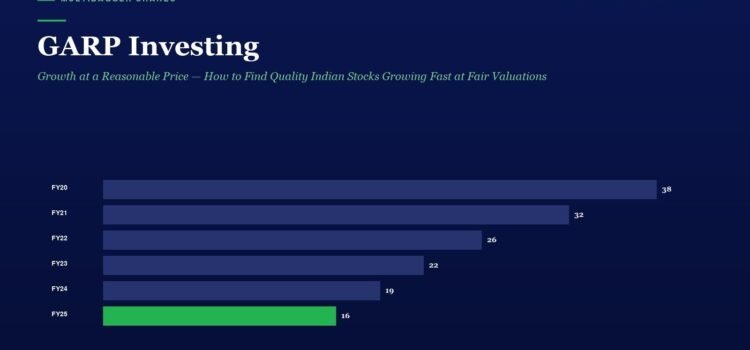
Price-to-Sales (P/S) Ratio: Ken Fisher’s Revolutionary Valuation Metric That Reveals Undervalued Indian Multibaggers When Earnings Temporarily Collapse — The Forgotten Formula Every Value Investor Must Master in 2026

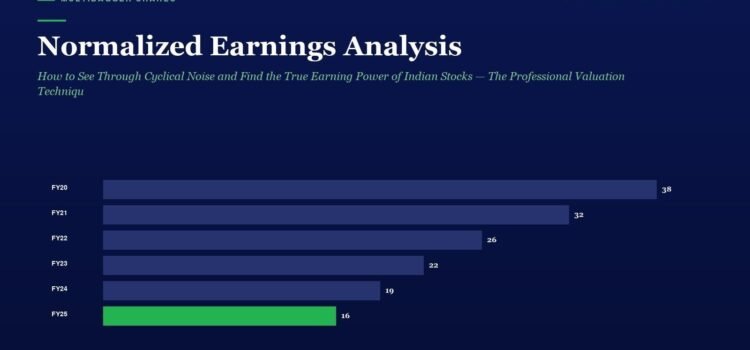
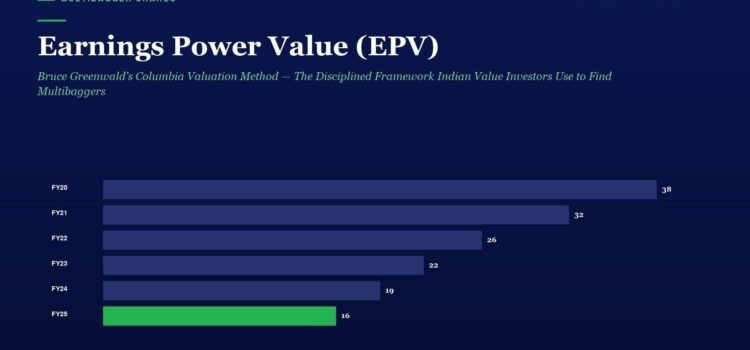
Chart showing price-to-sales ratio by fiscal year; FY20 38, FY21 32, FY22 26, FY23 22, FY24 19, FY25 16 with FY25 in green.

📅 Published 17 April 2026 (Friday) Every value investor eventually runs into the same painful question: how do you value a quality Indian business when its earnings have temporarily collapsed? Think of a pharma company hit by a one-time USFDA

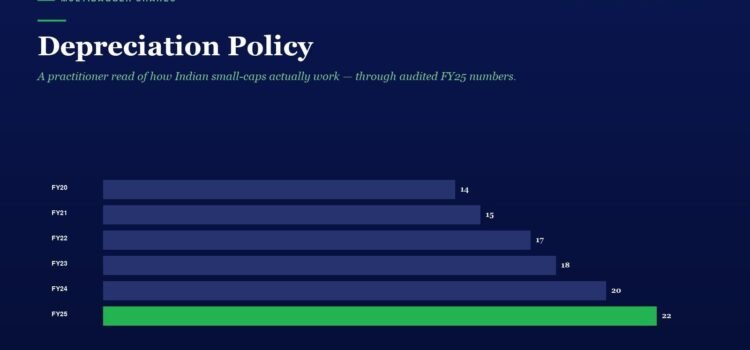
Depreciation Policy

Depreciation Policy: horizontal bar chart of yearly values from FY20 (14) to FY25 (22) on a dark blue background, with FY25 highlighted in green.

In the world of Indian small-cap investing, the most dangerous companies are not the ones that report losses — they are the ones that report artificial profits. And the single most abused accounting lever that lets weak managements manufacture earnings