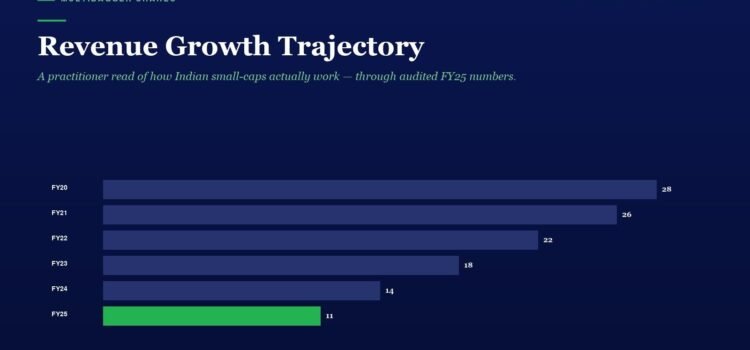
Revenue Growth Trajectory

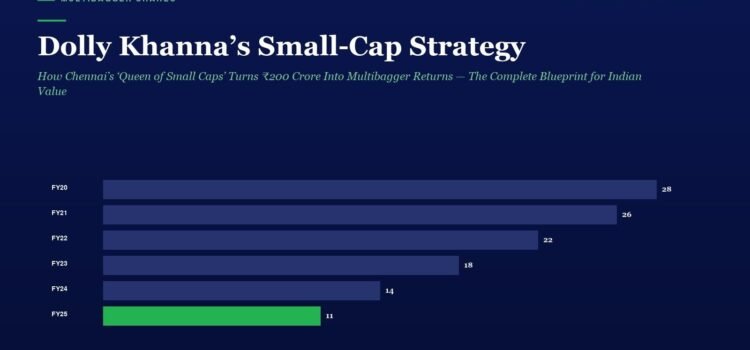
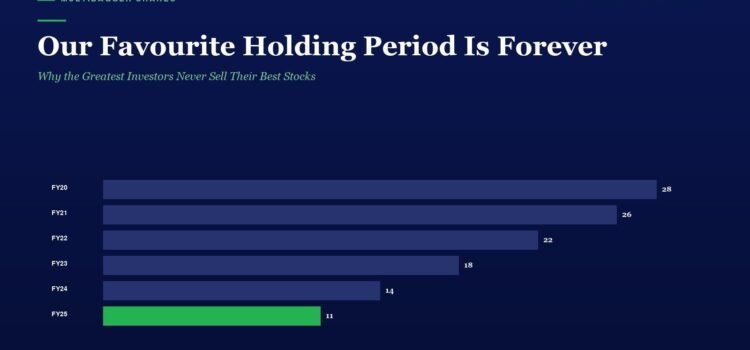
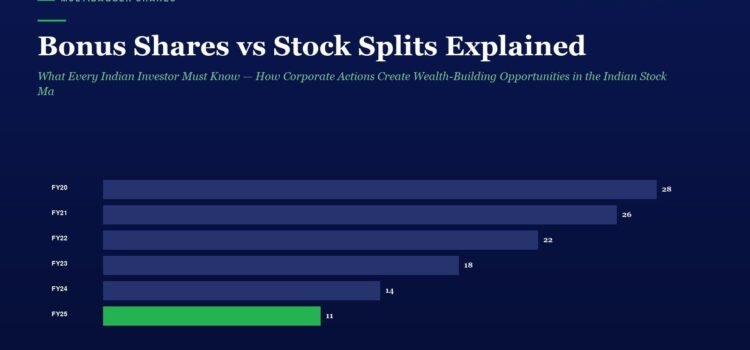
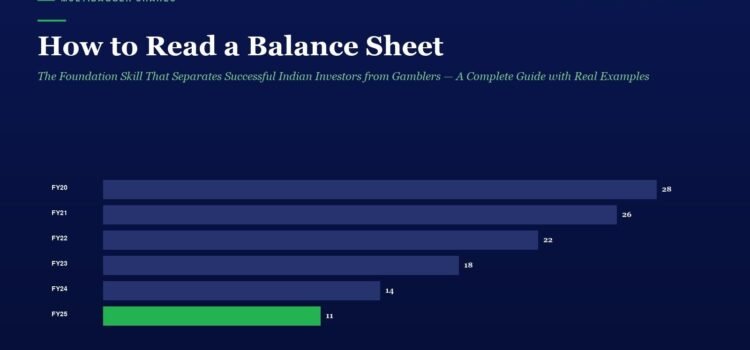
Revenue Growth Trajectory: horizontal bars show values from FY20 28 to FY25 11, with FY25 highlighted in green labeled 'Multibagger Shares'.

📅 Published April 5, 2026 (Sunday) ⚠️ SEBI Study — A Sobering Reality Check “93% of individual F&O traders lost money between FY22 and FY24. Aggregate losses exceeded ₹1.8 lakh crore — in just three years.” In FY25 alone, individual

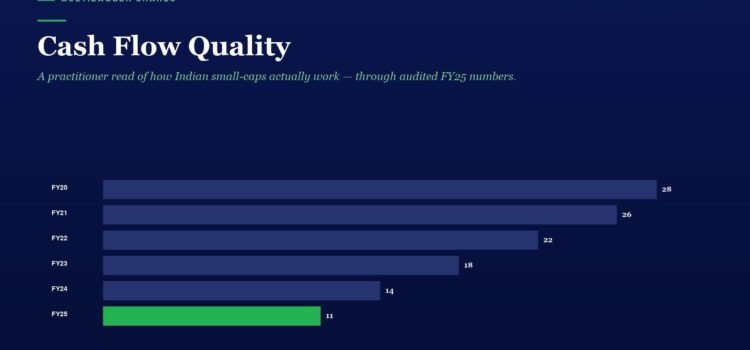
Cash Flow Quality

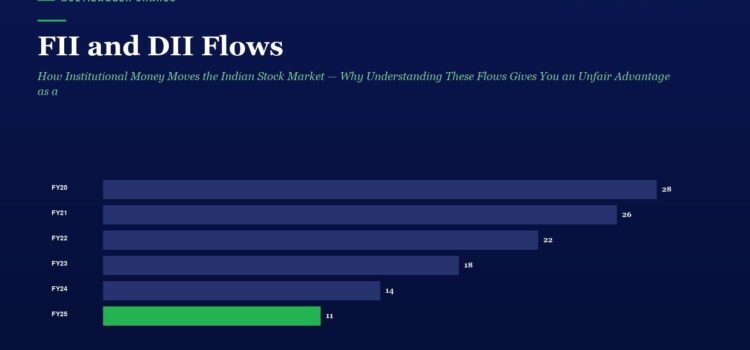
Horizontal bar chart of cash flow quality by fiscal year, FY20–FY25, with FY25 shown in green (11). Informs about year-to-year trend and final value of FY25 at 11/green bar.

Published April 5, 2026 (Saturday) Table of Contents Toggle The Single Most Important Number in Fundamental Analysis Understanding Cash Flow from Operations (CFO): The Truth Serum of Accounting The Three Pillars of Cash Flow Quality Cash Flow Red Flags Every

Indian Market Pulse

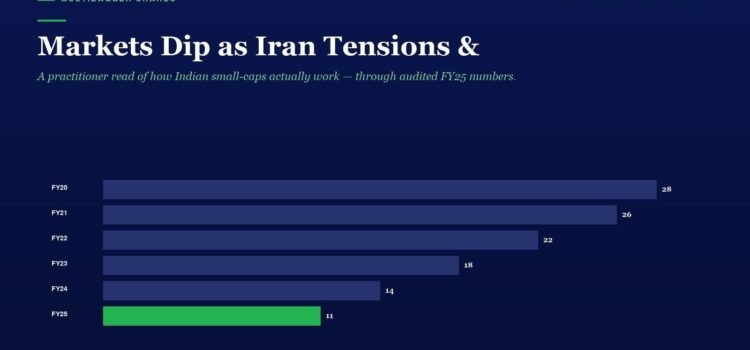
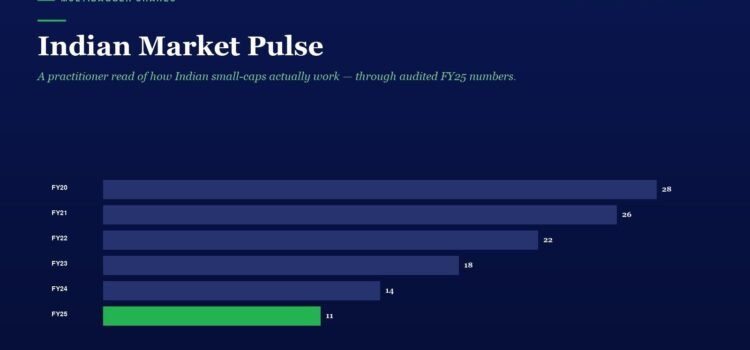
Infographic titled Indian Market Pulse; a dark blue bar chart shows yearly shares from FY20 (28) to FY25 (11), with FY25 highlighted in green.

Table of Contents Toggle 🇮🇳 Indian Market Pulse — Live Dashboard 📊 Institutional Flow (April 13, 2026) Featured: Titan Biotech Ltd (BSE: 524717) ⚠️ Why Value Investing Beats F&O — Every Single Time 🇮🇳 Indian Market Pulse — Live Dashboard