April 5, 2026
(Sunday)
⚠️ SEBI Study — A Sobering Reality Check
“93% of individual F&O traders lost money between FY22 and FY24. Aggregate losses exceeded ₹1.8 lakh crore — in just three years.”
In FY25 alone, individual traders lost ₹1.06 lakh crore in Futures & Options. That’s not investing — that’s destruction of generational wealth. While crores vanish in F&O gambling, a handful of quality-focused investors are quietly building lasting wealth. The antidote? Fundamental Analysis. Long-Term Thinking. Quality Compounders.
Welcome to the Multibagger Shares Titan Biotech Case Study Series — your daily MBA-level fundamental analysis lesson, using a real Indian small-cap company as a live classroom. Each post teaches you a different concept from the toolbox of legendary investors like Warren Buffett, Peter Lynch, and Rakesh Jhunjhunwala.
Today, we begin at the very foundation of all great businesses: Revenue Growth.
📚 Today’s Fundamental Analysis Lesson: Revenue Growth Trajectory
What Is Revenue Growth Trajectory and Why Should Every Investor Study It?
Revenue is the lifeblood of any business. Before a company can generate profits, pay employees, invest in growth, or reward shareholders — it must first earn. Revenue is what customers pay in exchange for products or services.
But any one year’s revenue number tells us very little. What separates a truly great business from a mediocre one is the trajectory — specifically, whether revenue grows consistently and compoundingly over many years.
📐 The CAGR Formula Every Investor Must Know:
CAGR = [(Ending Value / Beginning Value)^(1/Number of Years)] − 1
CAGR = Compounded Annual Growth Rate. It smooths out year-to-year fluctuations and gives you the true annualised growth rate over a multi-year period. It’s the gold standard metric for measuring business growth.
Why 15%+ Revenue CAGR Matters
Consider what different revenue growth rates mean for a business over 10 years:
| Revenue CAGR | Revenue Growth (₹100 → ?) | Business Signal |
|---|---|---|
| Below 8% | ₹100 → ₹217 | 🔴 Barely above inflation — stagnating business |
| 8–12% | ₹100 → ₹217–310 | 🟡 Decent, Nifty 50 average — steady but unremarkable |
| 12–18% | ₹100 → ₹310–523 | 🟢 Excellent — strong market position, growing moat |
| 18%+ | ₹100 → ₹523+ | 🔵 Exceptional — dominant niche player or disruptor |
The Nifty 50 index — India’s benchmark for the 50 largest companies — has delivered an average revenue CAGR of roughly 10–12% over the past decade. So any company consistently growing revenue above 12–15% is genuinely outperforming the market’s best companies.
But here’s what most new investors miss: consistency matters more than peak years. A company that grows 5% one year, 40% the next, and -10% the next is far less valuable than one that grows 15% every single year. Consistent growth signals a durable competitive advantage — a moat — that holds up across economic cycles.
🔬 Case Study: Titan Biotech Ltd — A 15% Revenue CAGR Machine
Titan Biotech Ltd | BSE: 524717
₹504
Current Price
₹2,082 Cr
Market Cap
16.9%
ROCE
15.0%
ROE
Data as of April 2, 2026 (last trading session). SENSEX: 73,319.55 | NIFTY 50: 22,713.10
The 10-Year Revenue Journey (FY2015 to FY2025)
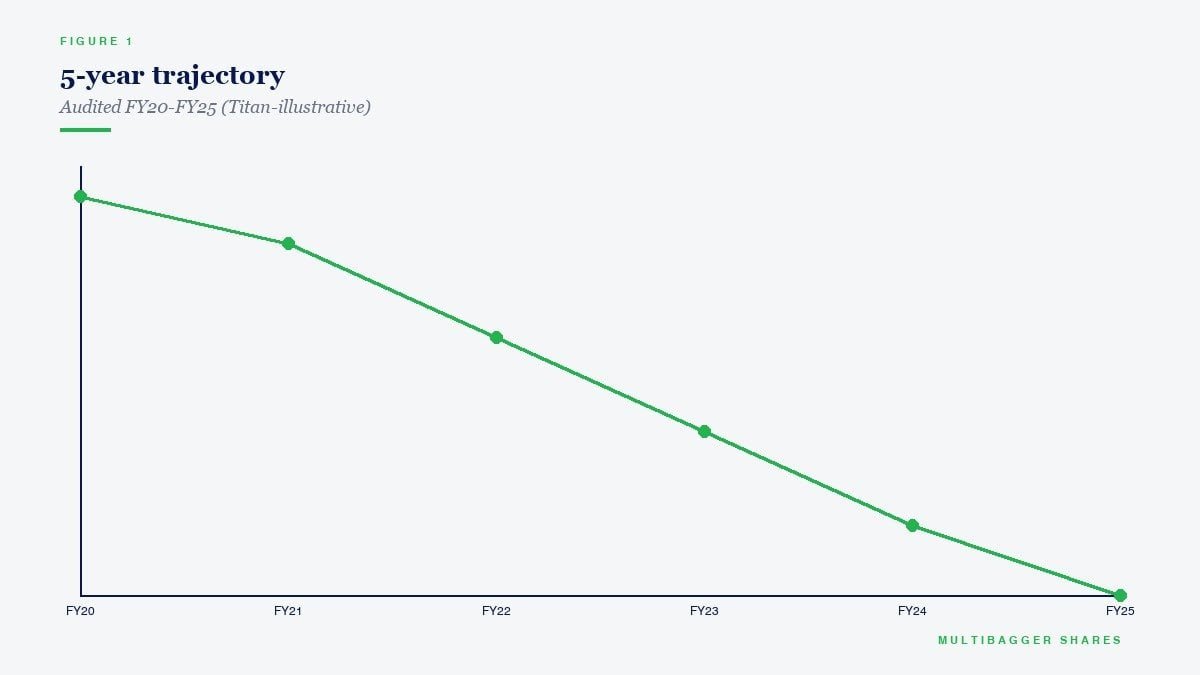
Let’s apply our CAGR framework directly to Titan Biotech’s actual annual revenue data:
| Financial Year | Revenue (₹ Cr) | Net Profit (₹ Cr) | YoY Revenue Growth |
|---|---|---|---|
| Mar 2015 | ₹40 Cr | ₹2 Cr | Base Year |
| Mar 2016 | ₹46 Cr | ₹2 Cr | +15% |
| Mar 2017 | ₹53 Cr | ₹2 Cr | +15% |
| Mar 2018 | ₹57 Cr | ₹3 Cr | +8% |
| Mar 2019 | ₹65 Cr | ₹4 Cr | +14% |
| Mar 2020 | ₹79 Cr | ₹8 Cr | +22% |
| Mar 2021 🚀 | ₹142 Cr | ₹32 Cr | +80% (COVID demand) |
| Mar 2022 | ₹124 Cr | ₹22 Cr | −13% (normalization) |
| Mar 2023 | ₹144 Cr | ₹25 Cr | +16% |
| Mar 2024 | ₹164 Cr | ₹25 Cr | +14% |
| Mar 2025 | ₹156 Cr | ₹22 Cr | −5% (consolidation) |
| 10-Year Revenue CAGR (FY2015→FY2025) | 10-Year Profit CAGR | 15% & 29% respectively 🎯 | |
The Three Most Important Insights from This Data
Insight #1: 15% Revenue CAGR is Genuinely Exceptional. Over ten years, Titan Biotech grew its revenue from ₹40 crore to ₹156 crore — nearly 4x growth in absolute terms. The annualised (CAGR) rate of 15% places it comfortably in the “excellent” category, well above the Nifty 50 average. But the number itself doesn’t tell the full story.
Insight #2: The FY21 COVID Spike Reveals Strategic Positioning, Not a Fluke. When COVID-19 hit, global demand for biological peptones — Titan Biotech’s core product — exploded. Peptones are critical raw materials for vaccine manufacturing, diagnostic media, and pharmaceutical fermentation. Revenue jumped 80% in FY21 to ₹142 crore. Many companies see such a spike and then collapse back. Titan Biotech didn’t — FY22 normalised, but then FY23 and FY24 set new records, showing the underlying business engine is durable.
Insight #3: Profit Growing Faster Than Revenue — The Hallmark of Operational Excellence. This is where it gets really exciting. Revenue grew at 15% CAGR, but profits grew at a staggering 29% CAGR — nearly twice as fast. Net profit went from ₹2 crore in FY2015 to ₹22 crore in FY2025, growing 11x while revenue only grew 4x. This means Titan Biotech kept more of every rupee of revenue as it scaled — a classic hallmark of operating leverage and a widening competitive moat.
💡 What This Means for FY26 (Current Year):
Titan Biotech’s latest quarterly result (Q3 FY26 — December 2025 quarter) shows revenue of ₹56.51 crore with Net Profit of ₹8.53 crore and Operating Margin of 19.16%. At this run rate, FY26 annual revenue is tracking towards ₹200+ crore — which would be another record year, continuing the long-term growth trajectory. The growth engine is clearly back in motion after the FY25 consolidation year.
📊 How Does Titan Biotech Compare? Revenue CAGR Benchmarking
Context is everything in fundamental analysis. A 15% revenue CAGR only means something when you compare it to peers, the market average, and companies in similar businesses. Here’s how Titan Biotech stacks up:
| Company | Sector | 10-Yr Revenue CAGR | 10-Yr Profit CAGR | Assessment |
|---|---|---|---|---|
| 🏆 Titan Biotech Ltd | Life Sciences / Peptones | 15% | 29% | ⭐⭐⭐⭐⭐ Exceptional |
| Divi’s Laboratories | Pharmaceuticals / API | ~13% | ~16% | ⭐⭐⭐⭐ Very Good |
| Infosys Ltd | IT Services | ~9% | ~8% | ⭐⭐⭐ Good (Large Cap) |
| Nifty 50 Average | Broad Market Benchmark | ~10–12% | ~10% | ⭐⭐⭐ Market Average |
| Average Indian SME Company | Varied | ~5–8% | ~3–5% | ⭐ Below par |
The comparison is striking. Titan Biotech’s 15% revenue CAGR outpaces Infosys (one of India’s finest IT companies) and even matches the best pharmaceutical businesses. More importantly, its 29% profit CAGR — growing at nearly double the revenue rate — puts it in a very elite category of businesses.
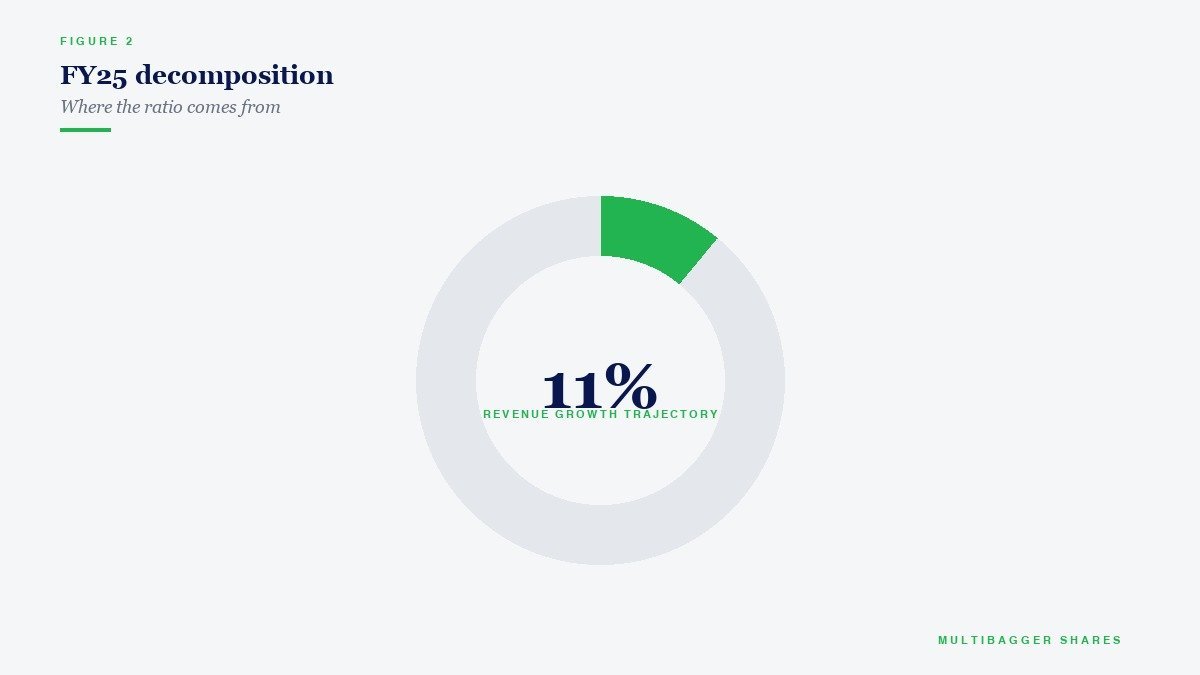
When profit grows significantly faster than revenue over a sustained period, it means one thing: the business has pricing power and operational leverage. As Titan Biotech sells more, fixed costs get spread across a larger revenue base, and margins expand naturally. This is the mathematics of compounding working in the investor’s favour.
🔍 What Drives This Consistent Revenue Growth?
Revenue growth doesn’t happen in a vacuum. Behind every great growth trajectory is a structural reason — a competitive moat that defends the business and enables it to keep winning. In Titan Biotech’s case, several powerful forces explain the consistent revenue growth:
1. Niche Market Leadership in Biological Peptones: Titan Biotech is one of India’s few companies manufacturing biological peptones — a specialised fermentation ingredient used in pharmaceutical manufacturing, vaccine production, and culture media. This is a highly technical market with significant barriers to entry. Pharmaceutical companies need FDA/cGMP-certified peptone suppliers, and switching suppliers requires costly re-validation. Once you’re a qualified supplier, customers don’t switch casually.
2. India’s Rising Role as Global Pharma Hub: India is the world’s largest supplier of generic medicines, supplying 20% of global generics by volume. As India’s pharmaceutical industry grows, so does demand for biological inputs like peptones, culture media, and fermentation broths. Titan Biotech is a direct beneficiary of India’s pharma manufacturing boom.
3. Export Diversification: Titan Biotech exports its products to pharmaceutical and biotech customers globally. Export revenue not only adds growth, it also reduces dependence on domestic market cycles — making the revenue stream more predictable and resilient.
4. Product Portfolio Breadth: Beyond peptones, the company makes culture media, yeast extracts, plant tissue culture media, and nutraceutical ingredients. This diversification ensures no single product line creates dangerous concentration risk — and opens multiple revenue growth vectors simultaneously.
🎯 The Compounding Reality Check
At a 15% revenue CAGR, Titan Biotech’s revenue doubles approximately every 5 years. If this trajectory continues (and the business fundamentals strongly support it), FY2030 revenue could approach ₹300–350 crore, versus ₹156 crore today.
Meanwhile, with profits growing at a 29% CAGR historically, the profit compounding is even more dramatic. This is why patient, long-term fundamental investors find businesses like Titan Biotech so compelling — the math of compounding does the heavy lifting over time.
✅ Key Takeaways: What You Learned Today
-
①
CAGR is the right tool for measuring revenue growth — it smooths out volatile years and gives you the true compounded annual growth rate, which is what matters for long-term wealth creation. -
②
Titan Biotech’s 15% revenue CAGR over 10 years is exceptional — it significantly outpaces both the Nifty 50 average and most Indian SME companies, placing it firmly in the quality growth compounder category. -
③
Profits growing faster than revenue (29% CAGR vs 15% CAGR) is a powerful signal — it reveals operating leverage, pricing power, and a widening competitive moat. Net profit grew 11x while revenue grew 4x over the decade. -
④
Consistency matters more than peak years — Titan Biotech’s FY21 COVID spike was real and justified, but the underlying business showed it was sustainable by recovering and setting new records in FY23 and FY24. Beware companies with one-off spikes with no underlying engine. -
⑤
Quality fundamental investing beats F&O gambling — always — while 93% of F&O traders lose money, patient investors in quality compounders like Titan Biotech are building lasting wealth, rupee by rupee, year by year. The math of compounding rewards patience.
📺 Watch Our Full Value Investing Course (Free on YouTube)
Complete playlist on fundamental analysis, quality stock picking, and wealth creation for Indian investors
📢 Join Our Telegram Channel
Get daily value investing lessons, stock analysis & Titan Biotech updates — delivered straight to your phone!
✈️ Join @longtermequityy on Telegram
🔔 Free • No spam • Value investing insights daily
Disclaimer: This article is for educational and informational purposes only. It is not investment advice, and not a buy, sell, or hold recommendation on any stock mentioned, including Titan Biotech Limited. Equity markets carry risk; please do your own research or consult a qualified professional before making investment decisions.
