According to SEBI’s January 2024 study, 93% of individual traders in the equity Futures & Options segment lost money — net aggregate losses of ₹1.81 lakh crore over three years. While retail traders chase tomorrow’s tick, a quiet line item buried in the audited balance sheet — Goodwill — silently reveals whether the Indian company you own grew its profits the old-fashioned way, or simply purchased them at a premium during the M&A bull run. Today we decode the single most underused forensic ratio in Indian fundamental analysis: the Goodwill-to-Net-Worth Ratio.
What Is Goodwill — And Why It Matters
In plain English, goodwill is the premium a company pays over the fair value of the identifiable net assets it acquires. When Company A buys Company B for ₹1,000 Cr but the audited fair value of B’s tangible assets, brands, patents and customer contracts adds up to only ₹600 Cr, the ₹400 Cr difference parks itself on A’s balance sheet as a non-current intangible asset labelled “Goodwill on Consolidation”. It is, in essence, the accounting record of management’s optimism — the bet that the synergies, the brand value or the customer franchise being acquired will eventually justify the cheque.
Under Ind AS 103 (Business Combinations) and Ind AS 36 (Impairment of Assets), goodwill is not amortised but is tested for impairment at least once every financial year. The test compares the carrying value of the cash-generating unit to its recoverable amount; if the unit is worth less than what sits on the books, management must write down the goodwill — and that write-down hits the Profit & Loss statement as a non-cash charge. For Indian listed companies, the moment of truth typically arrives in the year-end audit, which is why FY25 annual reports are now the cleanest place to study goodwill quality.
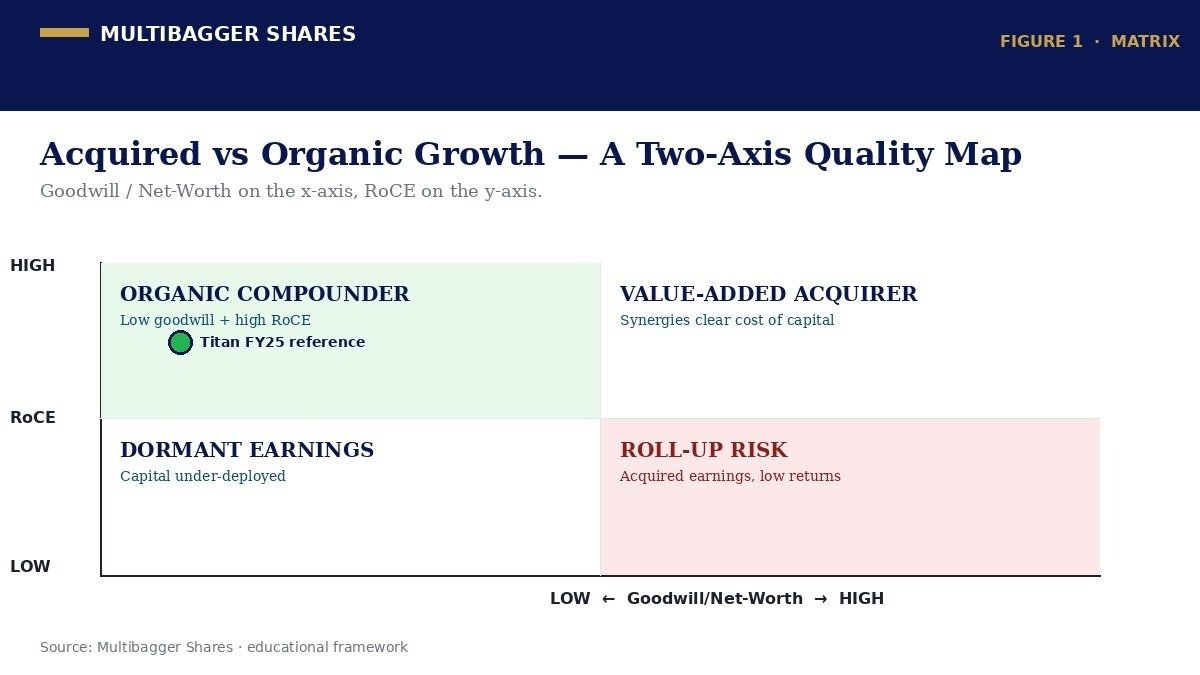
Why does this matter to a retail value investor in India? Because goodwill is the only line item on the balance sheet that, by its very existence, signals one specific historical fact: at some point, this company chose to buy growth rather than build it. It is neither inherently good nor bad — but it is always a footprint. And when goodwill grows disproportionately to the rest of the net worth, the balance sheet starts to resemble an over-leveraged M&A roll-up rather than a focused operating business.
The Formula And How To Read It
= Goodwill on Consolidated Balance Sheet ÷ Total Equity (Shareholders’ Funds) × 100
Both numbers are pulled directly from the audited consolidated balance sheet. The numerator is the line marked “Goodwill” under non-current intangible assets (be careful: do not confuse this with “Other Intangible Assets” such as patents, brands or software, which are amortised and accounted for separately). The denominator is total equity attributable to the owners of the parent — that is, paid-up share capital plus reserves and surplus, excluding minority interest.
As a general rule of thumb for Indian listed companies — drawn from a survey of NSE 500 balance sheets — the bands below offer a quick mental map. They are heuristics, not hard cut-offs, and must be read alongside sector context, RoCE trajectory, and net-debt levels.
A lower number is not automatically virtuous. A holding company structure, an aggressive consolidation in a fragmented sector, or a deliberate platform-buyout strategy can all justify elevated goodwill — provided the underlying acquired units throw off enough cash to service the implicit return-on-capital expectation. The metric’s value is diagnostic, not verdict-delivering: it tells you where to look next, not what to conclude.
Two Contrasting Lessons From Indian History
The disciplined builder: Consider, generically, the archetype of the Indian engineering compounder that has spent three decades doing brownfield capex out of operating cash flow. Each plant expansion is added to gross block; each new product line shows up under intangible assets only as the cost of patents or trademarks. Acquisitions, when they happen, are small bolt-ons of distribution networks at fair value. The consolidated goodwill line stays under 5% of net worth. RoCE remains in the high-teens to twenties because every rupee of capital was deployed by the same management team that earned it.
The roll-up cautionary tale: Indian capital markets between 2007 and 2012 produced a cohort of aggressive consolidators in segments like media, infrastructure construction and retail that funded a wave of overpriced acquisitions using debt and freshly-issued equity. By FY13, several of these names had goodwill-to-net-worth ratios above 60%. When the underlying acquired businesses failed to deliver the projected synergies, the Ind AS 36 impairment test arrived like a delayed bill — multi-thousand-crore non-cash charges hit consecutive P&L statements, net worth collapsed, and what once looked like a thinly-leveraged growth story turned into an over-extended balance sheet with negative retained earnings. The metric had been broadcasting the risk in plain sight for years; most retail shareholders simply did not know to look at it.
The two archetypes capture the central educational point: goodwill is the accounting representation of a management bet. A low ratio over a long compounding history is evidence of organic capability. A high ratio that keeps rising is evidence of acquisition appetite — and demands a sharper question about whether the acquired earnings clear the cost of capital.
Titan Biotech FY25: What the Numbers Reveal
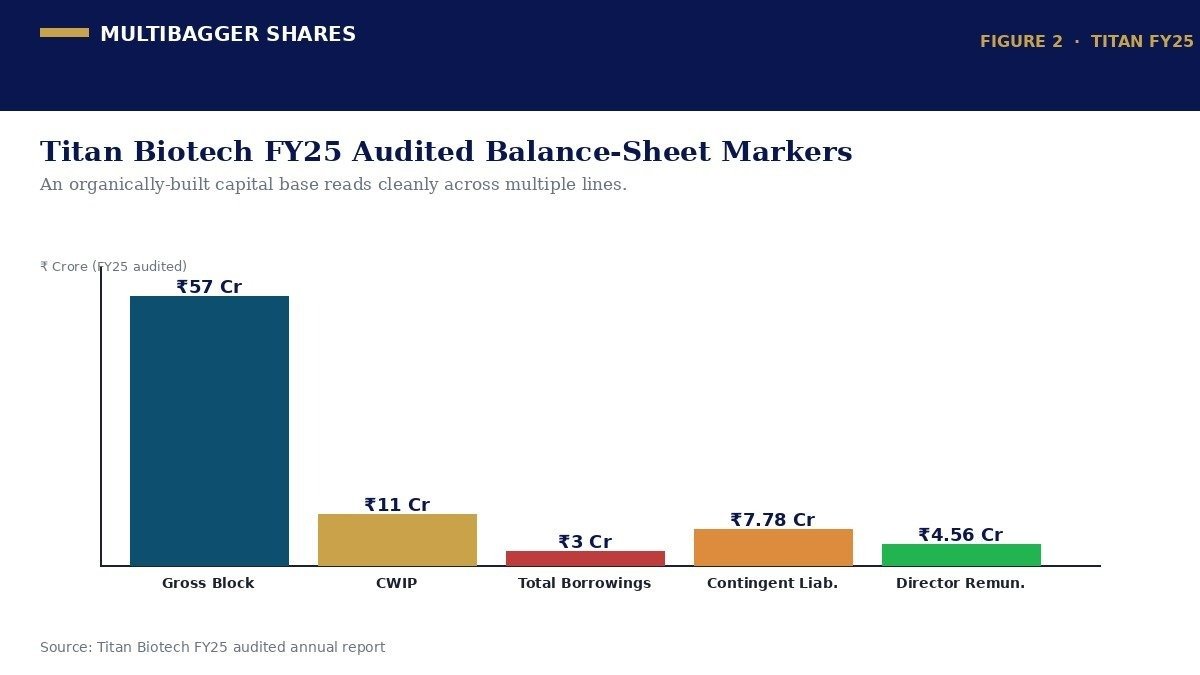
For an educational illustration of what a clean, organically-built Indian balance sheet looks like, the FY25 audited consolidated accounts of Titan Biotech Limited (BSE: 524717) — a specialty biotechnology company headquartered in Bhiwadi, Rajasthan, manufacturing peptones, microbial culture media, collagen and gelatin for pharma and biotech customers across 60-plus countries — offer a useful reference set. The table below summarises the FY25 audited markers most relevant to the goodwill-quality lens.
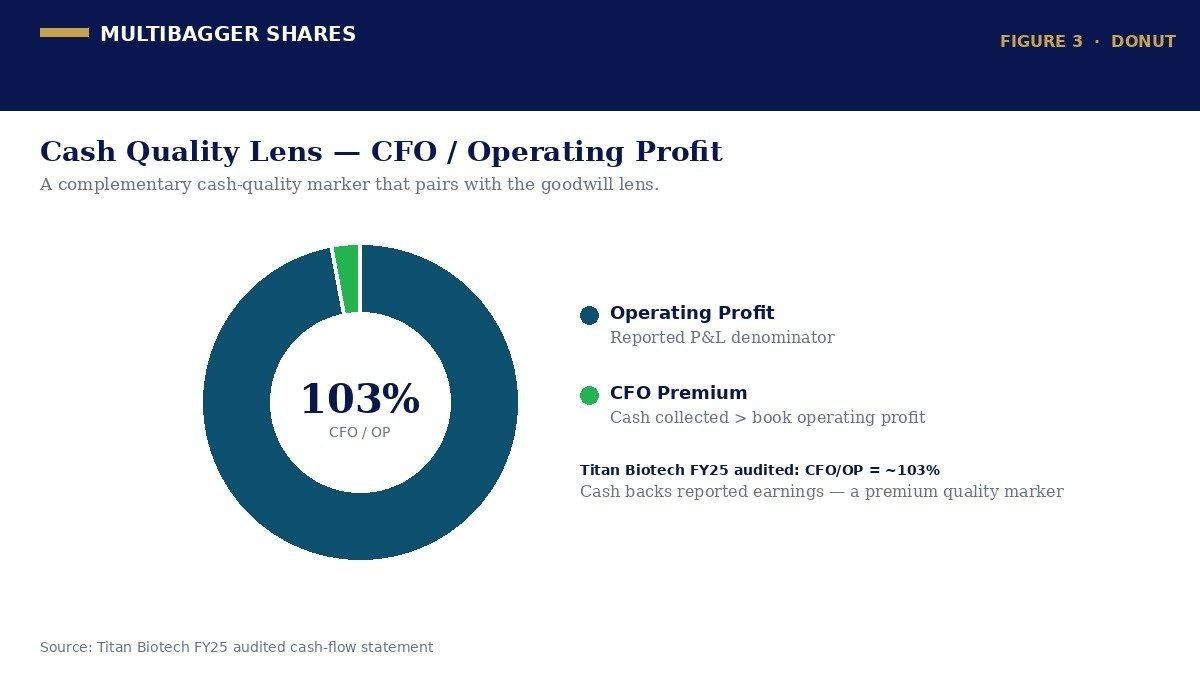
Read through the goodwill-quality lens, the picture is internally consistent. A specialty-chemicals/biotech business with a four-quarter revenue arc of ₹46.5 Cr → ₹54 Cr → ₹56 Cr → ~₹58 Cr, a tangible gross block of ~₹57 Cr, capex-in-progress of ~₹11 Cr, total borrowings of just ~₹3 Cr (so debt-light it is functionally net-cash on a net-of-investments basis), and CFO running at 103% of operating profit, looks exactly like what a textbook organic compounder is supposed to look like. The 10-year revenue CAGR of ~15% paired with a 10-year PAT CAGR of ~29% is the signature of operating leverage on an internally-built plant — not the signature of an aggressive M&A roll-up where each acquisition is added at the consolidated level.
The governance overlay reinforces the same story. FY25 saw 14 board meetings — well above the SEBI minimum of 4 — chaired by an independent chairperson (a separation from the managing-director role that SEBI now strongly encourages). Director remuneration of ~₹4.56 Cr is conservative relative to a healthy and fully cash-backed PAT, and the statutory auditor is a Big-4-equivalent firm with a majority-independent audit committee. None of this is offered as a buy/sell verdict; the point is simply that the goodwill-lens reading aligns neatly with what the broader governance footprint reveals.
How Retail Investors Should Use This Metric
For India’s now-11-crore-strong retail investor base (NSE’s investor count grew from roughly 3 crore in 2019 to over 11 crore by 2024), the Goodwill-to-Net-Worth Ratio is best used as a five-minute pre-screen — a quick lens applied to the consolidated balance sheet before any deeper fundamental work begins. The workflow is straightforward.
First, open the consolidated balance sheet in the latest annual report — always the consolidated, never the standalone, because standalone hides goodwill at subsidiary level. Locate the “Goodwill” line under non-current intangible assets; if the report shows it net of impairment, take that net figure. Second, compute total equity attributable to owners of the parent. Third, divide. Fourth, repeat the same exercise for the prior three financial years and plot the trend. A flat or declining line is benign. A steeply rising line is the question that demands an answer.
Where the ratio is meaningful, the analyst should then move to the auditor’s notes on Ind AS 36 — specifically the disclosure of the discount rate, terminal growth rate, and cash-generating-unit allocations used in the impairment test. If the discount rate quietly drops year-on-year, or the terminal growth rate creeps higher, that is the algebra by which an under-water acquisition can be kept “above water” on paper for one more reporting cycle. Genuine forensic warnings have, historically, been hidden in those very disclosures.
Cross-checks complete the picture. Pair the Goodwill / Net Worth ratio with the ten-year RoCE trend, the consolidated debt-to-equity, the share-count history (acquisitions paid for in fresh equity should be visible there) and the impairment-charge history. Together, the cluster forms a robust acquired-versus-organic-growth diagnostic.
Common Traps And Misinterpretations
Trap one — confusing goodwill with brand value. Goodwill on the balance sheet is an accounting plug, not a market-value-of-brand. A consumer company with no goodwill on its balance sheet can have one of the strongest brand moats in India; conversely, large goodwill does not certify a powerful brand. Brand strength shows up in pricing power, gross margin durability and reinvestment economics — not in this single line.
Trap two — treating zero goodwill as automatically virtuous. Holding-company structures and consolidation-stage industries (specialty chemicals, hospitals, regional NBFCs) can have rational reasons for elevated goodwill. The question is always: did the acquired CGUs deliver the cash flows that justified the goodwill at the time of acquisition? If the post-acquisition incremental RoCE clears the cost of capital, the goodwill was earned, not just incurred.
Trap three — ignoring the impairment-charge history. A company with goodwill of ₹500 Cr in the current year but a ₹2,000 Cr impairment charge over the past five years has effectively destroyed ₹2,000 Cr of shareholder capital — and the current ₹500 Cr is what survived after the destruction. The flow of write-downs over time is often more informative than the snapshot.
Trap four — confusing goodwill with “other intangible assets”. Patents, brands acquired for consideration, software, customer-relationships and trademarks sit under “Other Intangible Assets”. These are amortised over a defined useful life, behave economically more like fixed assets, and should be analysed separately. Mixing them with goodwill produces a distorted ratio.
Key Takeaways
- The Goodwill-to-Net-Worth Ratio is a footprint of management’s acquisition history. A low and stable ratio is consistent with organically-built compounding; a steeply rising ratio is an invitation to interrogate every acquisition in the audit notes.
- Always use the consolidated balance sheet under Ind AS 103 / Ind AS 36. Standalone accounts can hide goodwill at subsidiary level. Pair the ratio with the impairment-charge history, ten-year RoCE, and consolidated debt-to-equity for a complete picture.
- An organically-built balance sheet usually shows itself across multiple markers in concert. The FY25 audited reference set on Titan Biotech — total borrowings of just ~₹3 Cr against a healthy positive net worth, a tangible gross block of ~₹57 Cr funded internally, and CFO running at ~103% of operating profit — is an instructive textbook example of what an internally-financed, low-goodwill profile looks like.
- This is an educational illustration, not a buy/sell recommendation. The metric exists to help you ask better questions of any Indian listed company you study — including this one. Use it alongside SEBI-mandated disclosures, the auditor’s report, and your own independent due-diligence process.
SEBI Warning on F&O Trading: 9 out of 10 individual traders in the equity Futures & Options segment incurred net losses, according to a SEBI study. Net aggregate losses of ₹1.81 lakh crore were recorded over three years (FY22–FY24). F&O trading is essentially gambling. Focus on quality stock picking and long-term value investing instead.
Disclaimer: This article is for educational and informational purposes only. It is not investment advice, and not a buy, sell, or hold recommendation on any stock mentioned, including Titan Biotech Limited. Equity markets carry risk; please do your own research or consult a qualified professional before making investment decisions.
