India’s investor base has crossed 11 crore registered demat accounts on NSE alone, up from roughly 3 crore in 2020. Yet SEBI’s 2024 study found that 9 out of 10 individual traders in equity Futures & Options lose money — a structural failure rooted in the gap between speculation and analysis. The investors who survive market cycles do not chase tickers; they read balance sheets line by line. And no single line teaches a deeper lesson about what you are really paying for than the cash and equivalents sitting on a company’s balance sheet, measured against the price the market is asking you to pay for the entire business.
What Is the Cash-to-Market-Cap Ratio?
The Cash & Equivalents-to-Market-Cap ratio is the simplest forensic ratio in fundamental analysis — and one of the most misunderstood. It asks a single, almost child-like question: of every rupee the market is charging you to own this company, how many paisa are simply cash already sitting in the company’s bank account?
In Benjamin Graham’s Security Analysis (1934) and again in The Intelligent Investor (1949), this ratio appears as part of what Graham called the “net current asset value” (NCAV) test — his celebrated method for identifying companies trading below the liquidation value of their own working capital. Warren Buffett, who studied directly under Graham at Columbia in 1950–51, refined the idea in his early partnership years (1956–1969) by routinely buying businesses where cash and marketable securities alone covered 40–70% of the market price. The remaining 30–60% of the purchase price effectively bought the operating business at a steep discount, sometimes for free.
In Indian markets, where post-pandemic small-cap valuations have stretched, debt-fuelled growth narratives dominate quarterly calls, and SEBI itself has flagged the rising share of retail F&O speculation, the Cash-to-Market-Cap ratio has quietly become one of the most powerful filters for separating disciplined, owner-operated businesses from financial-engineering plays.
The Formula — And How to Read It
(Cash + Bank Balances + Liquid Investments) ÷ Total Market Capitalisation × 100
Disclaimer: This article is for educational and informational purposes only. It is not investment advice, and not a buy, sell, or hold recommendation on any stock mentioned, including Titan Biotech Limited. Equity markets carry risk; please do your own research or consult a qualified professional before making investment decisions.
The numerator is the sum of three line items drawn directly from the audited balance sheet (Schedule III, Division II of the Companies Act, 2013): “Cash and Cash Equivalents” (Ind AS 7), “Bank Balances other than Cash and Cash Equivalents” (typically fixed deposits with original maturity above three months), and “Current Investments” (liquid mutual funds, treasury bills, and other instruments expected to be realised within twelve months). For a stricter Buffett-style read, investors often add long-term investments in liquid mutual funds and government securities that can be converted into cash within a quarter.
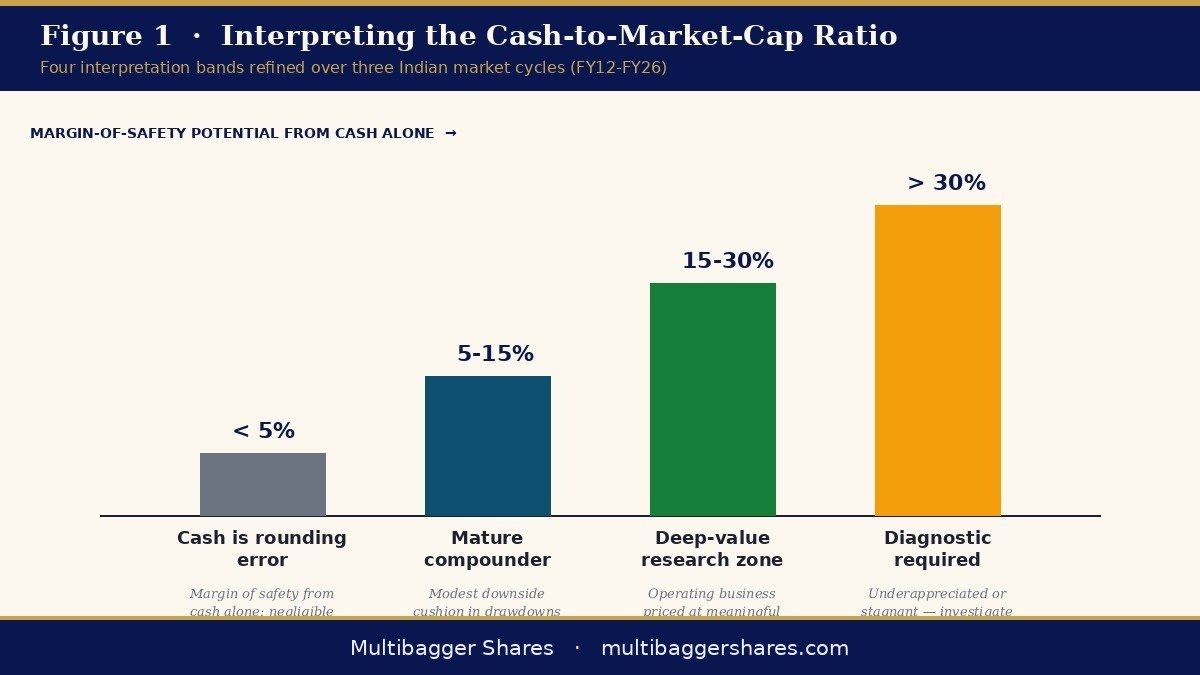
The denominator is the company’s market capitalisation as of the analysis date — not the historical IPO price, not the 52-week average, but the current price multiplied by total outstanding shares. The ratio is expressed as a percentage. The interpretation grid that experienced Indian value investors have refined over the last three market cycles (FY12–FY15, FY16–FY20, FY21–FY26) typically reads:
- Below 5%: Cash is a rounding error against price. The market is paying almost entirely for the future operating cash flows. Whether that is justified depends on the franchise’s quality, but the margin of safety from cash alone is negligible.
- 5–15%: Normal range for mature, dividend-paying compounders in India. The cash cushion provides modest downside protection during cyclical drawdowns.
- 15–30%: The territory of debt-light, owner-operated small- and mid-caps. The market is implicitly pricing the operating business at a meaningful discount to the headline market cap. This is the band where forensic deep-value research begins to pay off.
- Above 30%: Either a structurally underappreciated cash-rich business, a slow-growing legacy operation hoarding capital, or a sign that the market doubts the cash will ever be returned to shareholders. Each interpretation requires a separate diagnostic.
Crucially, the ratio is only meaningful when interpreted alongside net cash — i.e., after subtracting total borrowings. A company with ₹100 Cr of cash and ₹120 Cr of debt is not cash-rich; it is debt-funded. Buffett’s lifelong insistence on debt-free or near-debt-free balance sheets is what gives the cash line its analytical bite. We will return to this point in the Common Traps section below.
Two Contrasting Profiles — The Disciplined Compounder vs. The Leverage-Funded Mirage
Profile A — The disciplined cash-rich compounder. Consider a hypothetical small-cap Indian specialty-chemicals exporter with a market capitalisation of ₹500 Cr. Its audited balance sheet shows ₹85 Cr in cash, bank balances and liquid investments, against ₹4 Cr of total borrowings. Net cash is ₹81 Cr. The Cash-to-Market-Cap ratio is 17%; net-cash-to-market-cap is 16.2%. The operating business — plants, brands, distribution, working capital, customer relationships — is implicitly being valued at ₹419 Cr by the market. If the company is earning a sustainable ₹50 Cr in post-tax operating profit, the operating P/E is effectively 8.4x, even if the headline P/E (on total market cap) reads 10x. The 1.6x gap is the deep-value cushion.
Profile B — The leverage-funded mirage. Now imagine a mid-cap consumer-discretionary company with a much larger market capitalisation of ₹4,000 Cr. Headlines proclaim ₹600 Cr of “cash” on its balance sheet — a 15% cash-to-market-cap ratio that looks identical to Profile A. But Schedule III on closer reading reveals ₹1,400 Cr of total borrowings, including a ₹250 Cr commercial-paper rollover and a ₹400 Cr term loan with covenant restrictions. Net cash is negative ₹800 Cr. The “cash” is borrowed working-capital headroom, not owners’ liquidity. Add interest cost, the dividend-suspension covenant, and the rollover risk, and the headline cash ratio becomes a dangerous mirage.
Historically, this pattern played out repeatedly in Indian markets during the IL&FS-NBFC stress of FY19, the COVID liquidity crunch of FY21, and the post-tightening cycle of FY23–FY24. Companies whose cash-to-market-cap ratios looked superficially attractive but whose net cash positions were deeply negative were the ones that issued QIPs at depressed prices, suspended dividends, or in some cases entered the corporate insolvency process. The lesson is unambiguous: never read the cash line alone; always read it net of debt.
Titan Biotech FY25: What the Numbers Reveal
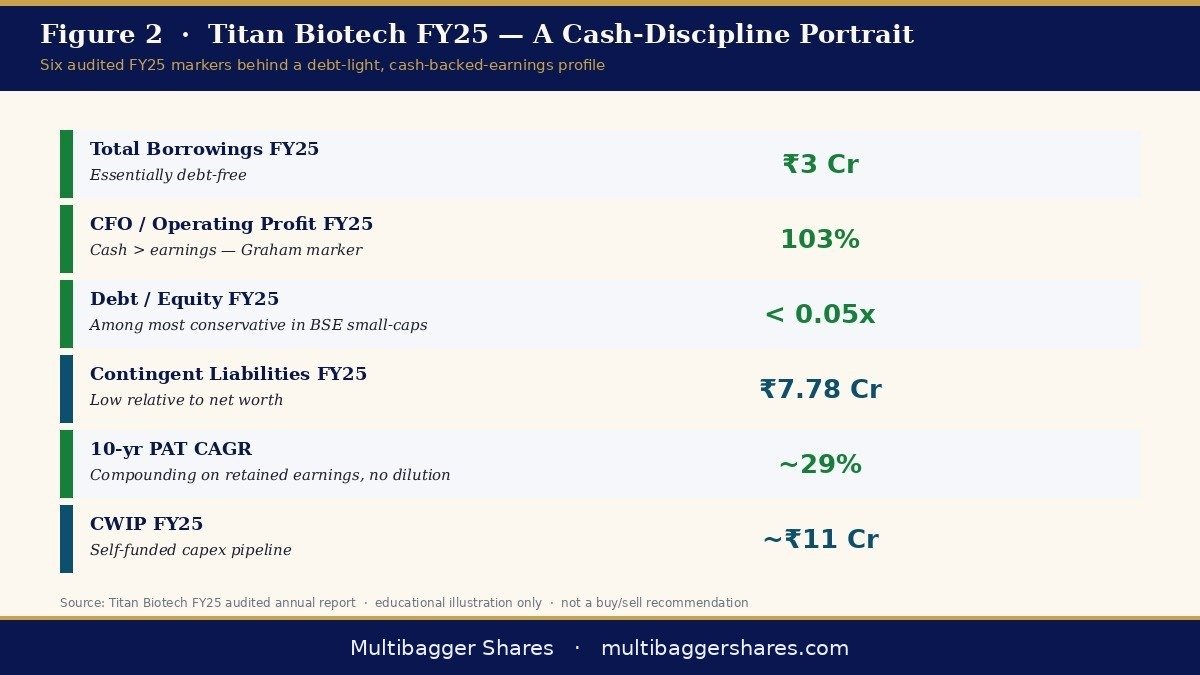
Titan Biotech Limited (BSE: 524717) is the kind of debt-light, owner-operated small-cap business that illustrates — in clean, audited, FY25 numbers — how the Cash-to-Market-Cap discipline is supposed to look in practice. None of the figures below should be read as a buy/sell recommendation. They are a positive case study in management discipline, drawn from the FY25 audited annual report.
| FY25 Audited Marker | Value | What It Tells the Cash-Discipline Reader |
|---|---|---|
| Total revenue FY25 | ~₹214 Cr | Genuine operating scale, not a paper shell |
| Total borrowings FY25 | ₹3 Cr | Essentially debt-free — cash line is owners’ liquidity, not borrowed |
| Debt-to-Equity FY25 | < 0.05x | Among the most conservative leverage profiles in the BSE small-cap universe |
| CFO / Operating Profit FY25 | 103% | Cash generation slightly exceeds operating profit — the rare “cash-backed earnings” marker Graham looked for |
| Contingent liabilities FY25 | ₹7.78 Cr | Low relative to net worth — no off-balance-sheet surprises waiting to drain cash |
| 10-yr PAT CAGR | ~29% | Compounding base built on retained, cash-backed earnings — not equity dilution |
| 10-yr Revenue CAGR | ~15% | Top line expanding without leverage-driven shortcuts |
| CWIP FY25 | ~₹11 Cr | Self-funded capex pipeline — future growth being paid for out of internal cash, not fresh debt |
| Board meetings FY25 | 14 | Governance engagement far above the SEBI 4-meeting minimum — capital allocation under regular review |
Read together, these numbers tell a consistent story about management discipline. With total borrowings of just ₹3 Cr against ~₹214 Cr of revenue, the company is structurally insulated from the rollover risk that hurt many leveraged small-caps in the FY22–FY24 tightening cycle. The CFO/Operating-Profit ratio of 103% in FY25 means every rupee of reported operating profit converted into more than a rupee of operating cash — the inverse of the working-capital-trapped earnings pattern Sloan documented in his 1996 Accounting Review paper on the accrual anomaly. The ₹11 Cr of CWIP is being funded out of that internally generated cash, not by tapping debt markets or diluting equity holders.
For the student of the Cash-to-Market-Cap ratio, the lesson is not the precise ratio on any given trading day — that fluctuates with the share price — but the quality of the underlying cash itself. Cash that comes from cash-backed operating earnings (CFO/OP > 100%) on a near-debt-free balance sheet is, in Graham’s language, “owners’ liquidity.” It is fundamentally different from cash that sits on a balance sheet alongside ₹500 Cr of short-term borrowings rolling over every six months. The first is a cushion; the second is a mirage. Titan Biotech FY25 illustrates the first profile cleanly.
How Retail Investors Should Actually Use This Metric
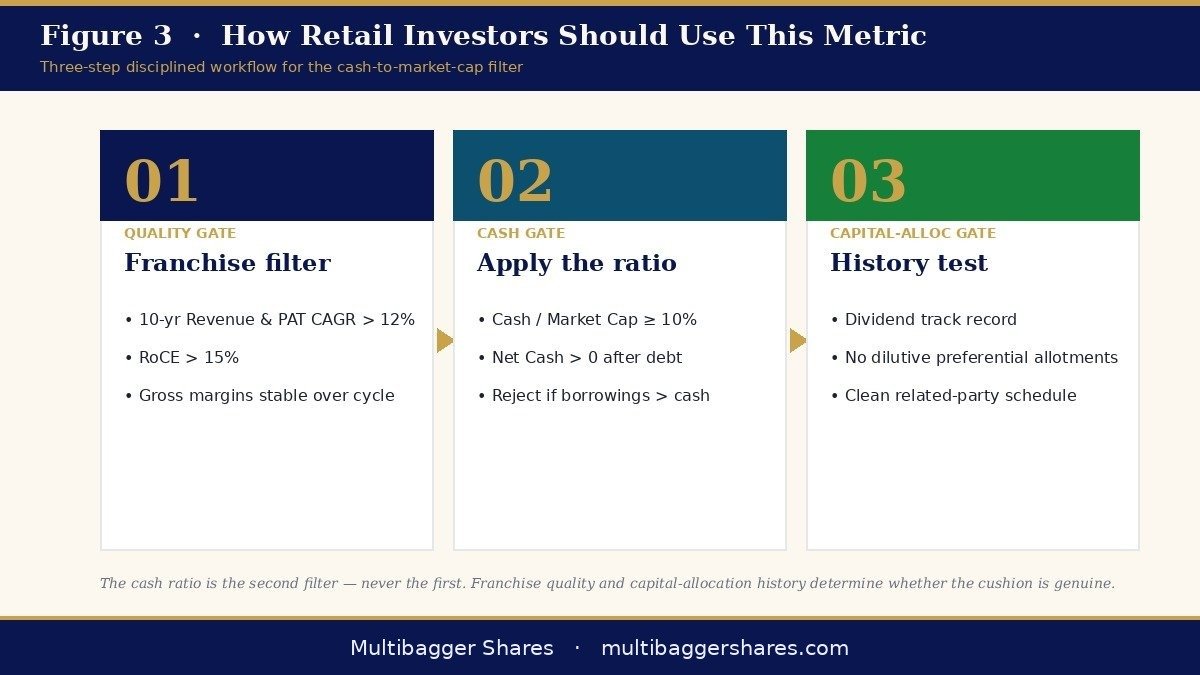
For the typical Indian retail investor — sitting in front of a Zerodha or Groww terminal at 9:30 am, hunting for the next quality compounder among the 5,000-plus listed companies on the BSE and NSE — the Cash-to-Market-Cap ratio is best deployed as the second filter in a quality screen, not the first.
A pragmatic three-step workflow looks like this. Step one: screen for franchise quality — a 10-year revenue and PAT CAGR above 12%, return on capital employed above 15%, and gross margins that have not collapsed over the cycle. Step two: apply the Cash & Equivalents/Market Cap and Net-Cash/Market Cap filters together. A company where cash is ≥ 10% of market cap and net cash is positive is structurally different from one where the cash line is impressive but the borrowings line is larger. Step three: read the latest annual report’s “Notes to Accounts” for the breakdown of those liquid investments. Are they in overnight liquid funds and government securities? Or in equity-oriented schemes that themselves carry market risk? The same ₹100 Cr can be sleep-at-night money or volatility waiting to happen.
A second, more advanced use is in capital-allocation analysis. A company with cash equal to 25% of market cap that simultaneously pays out 60% of free cash flow as dividends and has never issued equity is a fundamentally different animal from a company with the same 25% cash ratio that hoards capital, never raises the dividend, and historically diluted shareholders through preferential allotments at depressed prices. The ratio itself is only the starting question; the answer depends on what management has historically done with surplus cash. The annual report’s “Statement of Changes in Equity” and the multi-year dividend history tell that story.
Common Traps & Misinterpretations
Trap one: confusing gross cash with net cash. As we saw in Profile B, a 15% gross cash-to-market-cap ratio means nothing if borrowings exceed cash. Always net the two. The SEBI LODR Regulations require listed companies to disclose total borrowings in the financial results; the number is available within minutes of the quarterly result publication.
Trap two: treating restricted cash as available cash. Many companies hold meaningful balances as margin money with banks for letters of credit, bank guarantees, or for compliance with regulatory authorities. These balances appear in “Bank Balances other than Cash and Cash Equivalents,” but they are not freely available to shareholders. The Notes to Accounts always break this down — read them.
Trap three: assuming high cash means the business is undervalued. A cash-rich business in a structurally declining industry — think landline-era telecoms, or a fading commodity producer — may have a 40% cash-to-market-cap ratio precisely because the market is pricing in the slow erosion of the operating business. The cash provides a floor, but the operating value can drift toward zero. The ratio is necessary, never sufficient.
Trap four: ignoring capital allocation history. A board that has historically blown its cash on related-party acquisitions, unrelated diversifications, or preferential allotments to promoters at distressed prices is unlikely to suddenly start returning cash to shareholders just because the ratio looks attractive. Past behaviour, disclosed in the Related Party Transactions schedule and the Notes to Accounts, is the strongest predictor of future capital allocation.
Trap five: chasing high ratios into illiquid micro-caps. The Indian small- and micro-cap universe is full of obscure listings where the cash ratio is extraordinarily high simply because the market cap has collapsed alongside collapsing operating value, deteriorating governance, or auditor qualifications. A ratio above 40% in an illiquid name is almost always a warning, not an invitation.
Key Takeaways
- The ratio answers a child-like question with adult consequences: of every rupee you pay for a share, how many paisa are simply cash sitting in the company’s bank account? In disciplined Indian small-caps, the answer often surprises seasoned investors.
- Always read the cash line net of debt. Gross cash can be a mirage when borrowings exceed liquidity. Net-cash-to-market-cap is the analytically honest version of the ratio.
- Cash quality matters more than cash quantity: Titan Biotech’s FY25 audited CFO/Operating-Profit ratio of 103%, combined with total borrowings of just ₹3 Cr against ~₹214 Cr of revenue, illustrates the rare profile where cash represents owners’ liquidity generated by the operating business itself, not borrowed working-capital headroom.
- Use the ratio as the second filter, not the first. Franchise quality (10-yr CAGR, RoCE, gross margins) and capital allocation history (dividend track record, dilution history, related-party transactions) determine whether a high cash ratio is a genuine margin of safety or a slow-decay warning.
