Indian retail participation on NSE crossed 11 crore unique investors by early 2026, up from 3 crore in 2019. Yet the same SEBI study on the equity F&O segment showed that 93% of individual traders incurred net losses, with aggregate losses crossing ₹1.81 lakh crore over three years. The gap between speculation and ownership is not closed by chart patterns. It is closed by learning to read a company’s balance sheet — one ratio at a time. Today, we decode Days Payable Outstanding, the working-capital ratio that quietly reveals a company’s negotiating power, supplier discipline, and hidden short-term liquidity risk.
What is Days Payable Outstanding (DPO)?
Days Payable Outstanding (often abbreviated DPO, also called “days payable” or “creditor days”) measures the average number of days a company takes to settle its bills with suppliers. Put differently: from the moment a vendor delivers raw material or services, how long until the company actually transfers the money out?
If a paint manufacturer buys ₹100 crore of titanium dioxide on 1 April and the supplier finally receives payment on 30 June, the DPO on that lot is roughly 90 days. Aggregated across every supplier and every purchase across the fiscal year, you get the company’s average DPO — a single number that summarises the firm’s working-capital posture with its trade ecosystem.
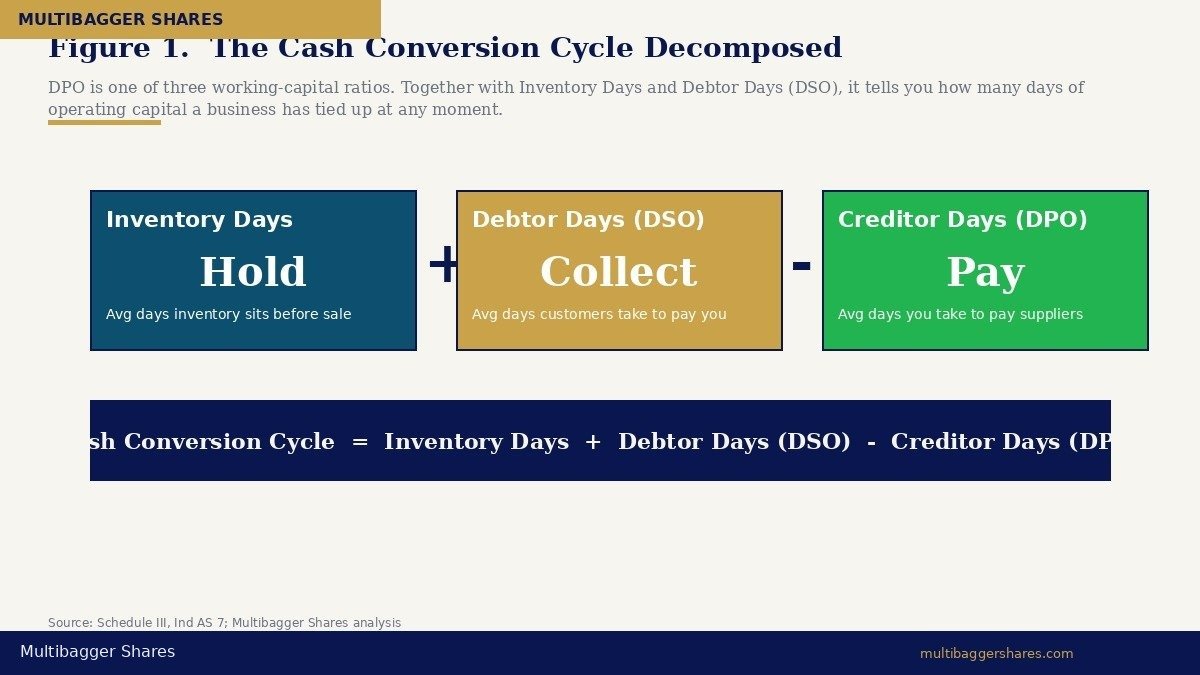
DPO is the mirror image of Days Sales Outstanding (DSO, also called debtor days). DSO measures how long customers take to pay you. DPO measures how long you take to pay your suppliers. Read together — alongside inventory days — they form the famous cash conversion cycle: Inventory Days + Debtor Days − Creditor Days. A company that collects from customers in 30 days, holds inventory for 45 days, and pays suppliers in 60 days has a 15-day cash conversion cycle. That single number tells you how many days of operating capital the business has tied up at any moment.
The Formula — and Why Each Variable Matters
The standard calculation is:
DPO = (Trade Payables ÷ Cost of Goods Sold) × 365
Trade payables is taken from the Balance Sheet under “Current Liabilities — Trade Payables” (Schedule III, Part I). Cost of Goods Sold (COGS) is calculated from the Statement of Profit & Loss as: Cost of Materials Consumed + Purchases of Stock-in-Trade + Changes in Inventories of Finished Goods and Work-in-Progress. Many Indian analysts use Total Operating Expenses (or even Revenue) as the denominator when a clean COGS line is unavailable — but always disclose which denominator you used, because the ratio is denominator-sensitive.
For best accuracy, use the average trade payables across opening and closing balances rather than the year-end snapshot. Year-end balances can be artificially low if the company front-loaded supplier payments in March to “window-dress” the balance sheet — a classic forensic red flag uncovered by SEBI in several enforcement orders over the past decade.
How to Read a DPO Number
There is no universal “good” DPO. The metric is industry-dependent, business-model dependent, and time-trend dependent. Three lenses help:
1. Industry benchmark. Indian FMCG giants like Hindustan Unilever and Nestlé India typically report DPO in the 90–130 day range — these firms enjoy enormous supplier negotiating power and effectively use suppliers as a working-capital cushion. Indian IT-services firms run DPO of 30–55 days because their input cost is largely salaries (paid monthly), not raw material. Auto OEMs, infrastructure EPC contractors, and government-facing capital-goods companies often show 90–180 days. Comparing Bharti Airtel’s DPO to Infosys’s DPO is meaningless; comparing Bharti’s DPO to Vodafone Idea’s DPO is illuminating.
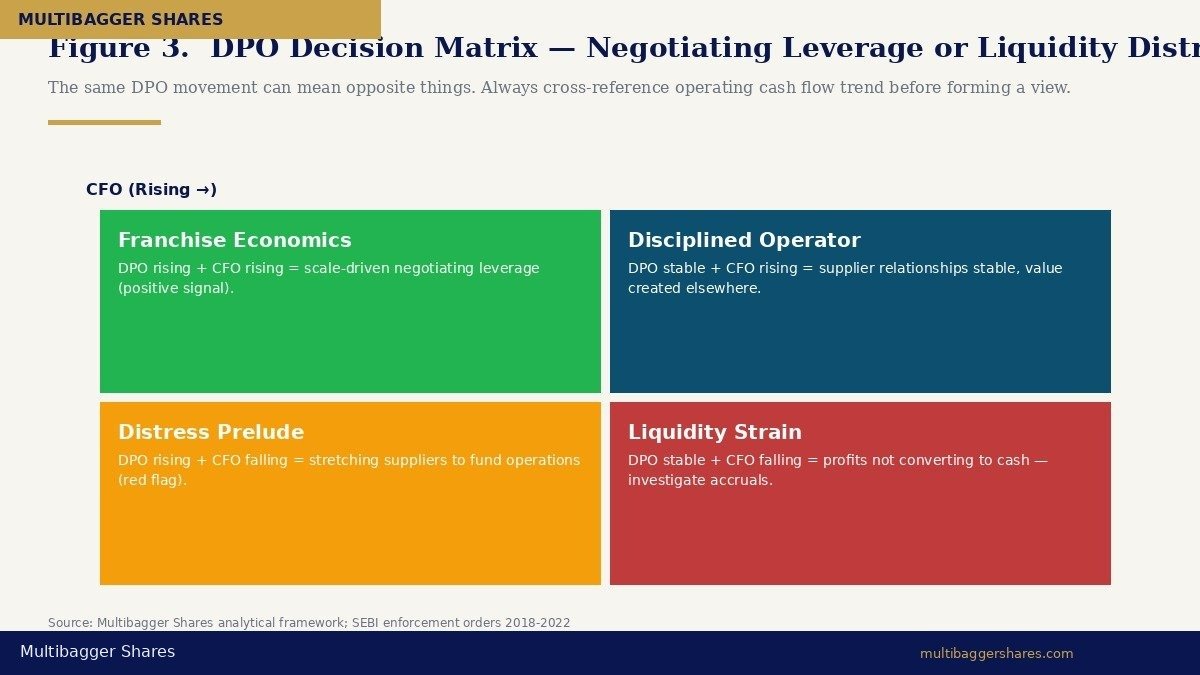
2. Trend over time. A DPO rising from 45 days to 95 days over four years is a two-sided signal. It may mean the company has consolidated buying power and is renegotiating better terms (positive). Or it may mean the company is delaying supplier payments because cash flow is deteriorating (negative). Trend interpretation requires cross-referencing with cash-flow statements (is CFO declining?), auditor comments (any mention of “delayed payments to MSMEs” under MSMED Act disclosures?), and the management discussion & analysis (any narrative about supplier-financing programmes?).
3. The 45-day MSME line. Under Section 15 of the MSMED Act, 2006, payments to micro and small enterprises must be made within 45 days. Indian companies must disclose under Schedule III any amounts due to MSMEs beyond 45 days, along with interest payable. A DPO well above 45 days combined with a large MSMED disclosure schedule is a governance red flag. Conversely, a DPO of 80 days where every overdue paisa is paid to large suppliers — not MSMEs — is a different story entirely.
Two Contrasting Patterns Every Investor Must Recognise
Pattern A — Healthy DPO Expansion (Negotiating Leverage). A large branded consumer-goods company grows revenue at 12% CAGR, sees its market share rise from 18% to 26% over six years, and during the same period its DPO drifts from 62 days to 78 days. CFO is rising in line with PAT. Auditor reports are clean. MSMED disclosure is small and stable. Interpretation: the firm has used scale to negotiate longer credit terms from suppliers eager to retain a high-volume customer. This is value capture — the firm is borrowing interest-free working capital from its trade ecosystem, a hallmark of franchise economics that Warren Buffett’s See’s Candies thesis (1972) explicitly identifies.
Pattern B — Distress DPO Expansion (Liquidity Stress). Mid-cap engineering company sees revenue plateau at ₹1,800 crore for three years. Operating cash flow falls from ₹140 crore to ₹40 crore. Auditor adds an emphasis-of-matter paragraph on “delayed creditor payments”. MSMED disclosure schedule swells from ₹4 crore overdue to ₹71 crore overdue. DPO has risen from 95 days to 168 days. Interpretation: the company is funding its operations by stretching suppliers because its own cash collection has collapsed. This is the classic prelude to either an emergency rights issue, a credit-rating downgrade, or an insolvency filing — a pattern visible in multiple IBC referrals during 2018–2022.
“The same numerical movement — DPO rising 30 days — means opposite things in the two cases. The number alone is meaningless. The context is everything.”
Titan Biotech FY25: What the Numbers Reveal
Titan Biotech Limited (BSE: 524717) operates in a highly capital-disciplined corner of the Indian biotech industry — specialty microbial culture media, peptones, collagen, and gelatin sold to pharma and biotech customers across 60+ countries. Working-capital posture is therefore central to the franchise. The FY25 audited disclosures are an instructive positive illustration of how DPO should look when management discipline is intact.
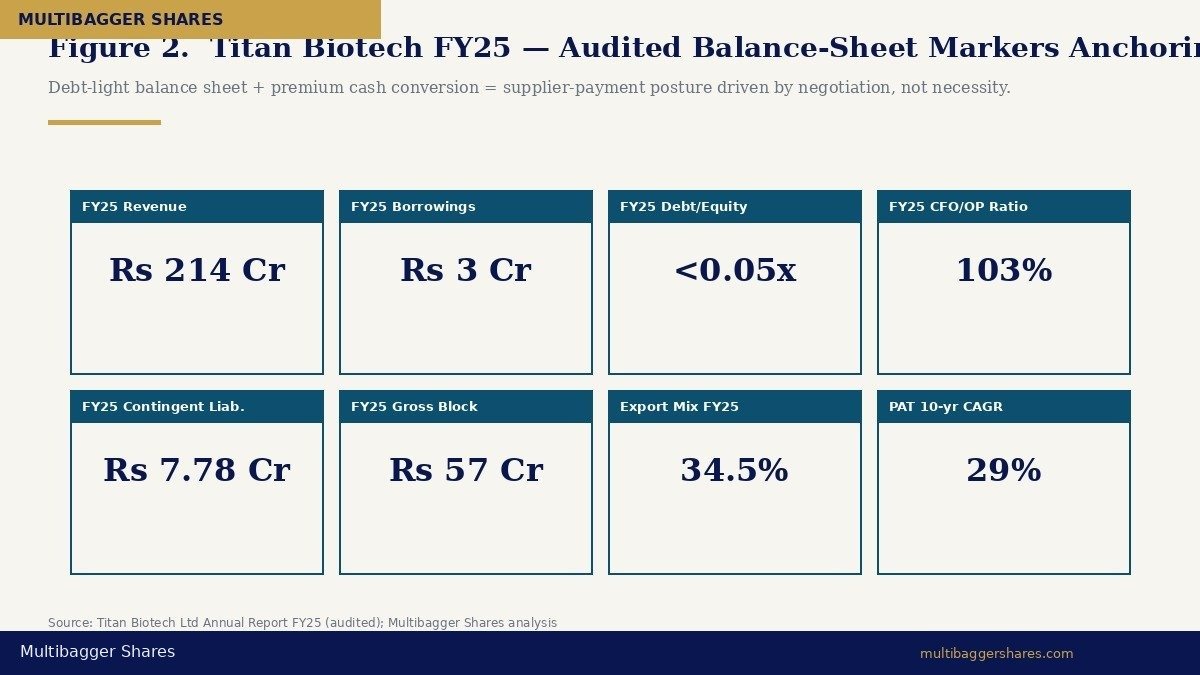
The synthesis is clear. With FY25 audited borrowings of just ₹3 crore, debt/equity below 0.05x, and a CFO/OP ratio of 103%, Titan Biotech is in the structurally rare position where its working-capital posture is not driven by liquidity necessity but by deliberate negotiation. A company with this profile pays MSMED suppliers well within the 45-day statutory window and pays large suppliers on contractually-negotiated cycles. There is no incentive — and no need — to stretch trade payables to fund operations.
The independent-chairperson governance structure, 14 board meetings in FY25 (far above the four-meeting minimum under Regulation 17(2) of the LODR), and director remuneration of approximately ₹4.56 crore for the full year (conservative relative to PAT) further support the inference that supplier-relationship management is being run as a long-term value driver rather than a short-term cash lever. This is exactly the profile DPO analysis is designed to surface — and it is presented here purely as an educational illustration, not as a buy/sell recommendation on any stock.
How Indian Retail Investors Should Use DPO
Step 1 — Calculate the trend. Pull 5 years of trade payables and cost of materials consumed from the company’s annual reports (Schedule III, Part I and Statement of P&L Notes). Compute DPO for each year. Plot the line. A stable or slow-rising DPO in line with revenue growth and CFO growth is healthy. A DPO that explodes upward while CFO collapses downward is a red flag — investigate further.
Step 2 — Compare with industry peers. Run the same calculation on the top three listed peers. A DPO that is 40+ days longer than every peer demands an explanation. Read the MD&A and the auditor’s report for that company’s narrative on supplier financing programmes or reverse-factoring arrangements (which the IFRS Foundation flagged in 2022 as a major disclosure gap).
Step 3 — Cross-check with MSMED disclosures. Schedule III mandates a separate disclosure for amounts due to MSMEs beyond the 45-day window, along with interest payable under Section 16 of the MSMED Act. A growing MSMED overdue schedule is one of the cleanest forensic signals available to Indian retail investors — and it costs nothing to read.
Step 4 — Sanity-check against the cash flow statement. The Statement of Cash Flows under Ind AS 7 explicitly shows “Increase/(Decrease) in Trade Payables” as part of working-capital changes. If trade payables are rising fast on the balance sheet but the cash-flow statement shows a corresponding “decrease in trade receivables” of similar magnitude, the company may be simply funding receivables with payables — neutral. If payables are rising while receivables are also rising, both sides of working capital are stretched — investigate operating cash flow trend.
Common Traps and Misinterpretations
Trap 1 — Treating high DPO as automatically virtuous. Some investor education content celebrates high DPO as proof of “negotiating power”, citing Walmart or Amazon. These US giants enjoy duopoly buying power. Most Indian mid-caps do not. A DPO of 180 days in a small Indian engineering firm is far more likely to be supplier-stretching than franchise economics.
Trap 2 — Comparing across industries. A 90-day DPO is healthy for an FMCG firm and alarming for an IT-services firm. Always benchmark within the same industry, ideally with companies of similar scale and ownership structure.
Trap 3 — Ignoring reverse factoring / supply-chain financing. If a company uses a bank-intermediated supply-chain financing programme (the supplier sells the invoice to the bank, the bank gets paid by the company later), the trade payable may have been reclassified as borrowing — or it may not. Disclosure practice varies wildly. Read the borrowings note and the related-party notes carefully.
Trap 4 — Year-end window dressing. Some companies push hard to pay down trade payables on 31 March to lower the year-end balance, making DPO look better. The opposite is also seen — companies that delay March payments to preserve cash. Quarterly comparisons (Q4 vs Q3 DPO) help spot manipulation. Average payables across the year — not just the 31 March snapshot — is the best practice.
Trap 5 — Using revenue instead of COGS as denominator. Revenue is gross; COGS is the actual purchase scale that drives trade payables. Using revenue inflates DPO and makes companies look like they pay slower than they do. Always disclose your denominator.
Key Takeaways
- DPO measures the average days a firm takes to pay suppliers — formula: (Trade Payables ÷ COGS) × 365. It is one of the three working-capital ratios (alongside Inventory Days and Debtor Days) that together form the cash conversion cycle.
- Rising DPO is a two-sided signal. It can mean genuine negotiating power (positive — franchise economics) or liquidity stress (negative — distress prelude). Always cross-reference with CFO trend, MSMED overdue schedule, and auditor commentary before forming a view.
- Titan Biotech Limited’s FY25 audited markers — total borrowings of just ₹3 Cr, debt/equity below 0.05x, and a CFO/OP ratio of 103% — illustrate the structurally healthy profile in which supplier-payment posture is driven by deliberate negotiation rather than liquidity necessity. This is presented as an educational positive illustration, not as a buy/sell recommendation.
- Indian retail investors should always benchmark DPO within industry, track trends across 5+ years, and read the MSMED disclosure schedule under Schedule III. A DPO that is rising sharply while CFO is falling and MSMED overdue is growing is one of the cleanest forensic red flags available to a private investor.
Disclaimer: This article is for educational and informational purposes only. It is not investment advice, and not a buy, sell, or hold recommendation on any stock mentioned, including Titan Biotech Limited. Equity markets carry risk; please do your own research or consult a qualified professional before making investment decisions.
