Every Indian retail investor knows the headline risk — a company runs out of cash and the stock collapses. What very few investors know is that a single ratio, often missing from broker reports and CNBC tickers, tells you precisely how many days a business can keep its lights on, pay its staff, and honour its supplier bills without selling a single unit of inventory and without collecting a single rupee of new revenue. This ratio is called the Defensive Interval Ratio (DIR), and it is one of the most powerful forensic liquidity tools in the fundamental-analyst’s kit.
SEBI’s own data tells you why this matters. The Indian capital-market participant base has expanded from roughly 3 crore demat accounts in 2019 to over 11 crore in 2025, and SEBI’s January 2024 F&O study showed that 93% of individual derivative traders booked net losses over FY22–FY24. The vast majority of these losses came from positions taken in companies whose underlying liquidity profile was never examined. The DIR is the antidote — a 90-second back-of-the-envelope test that separates resilient businesses from fragile ones, especially when credit markets tighten, when a customer defaults, or when a black-swan event (COVID-19, demonetisation, a sudden RBI tightening cycle) freezes top-line revenue overnight.
What Is the Defensive Interval Ratio?
The Defensive Interval Ratio is a survival-day count. It answers a single, brutal question: “If the cash registers stopped ringing tomorrow morning, how many days could the business continue to operate by drawing only on its existing liquid assets?” It is sometimes called the Basic Defense Interval or the Defensive Period, and it appears in the CFA Institute’s Level I curriculum under “liquidity ratios” — yet it is virtually absent from popular Indian financial-news commentary, which is why it remains a genuine edge for the patient retail investor who learns it.
The classical formula is:
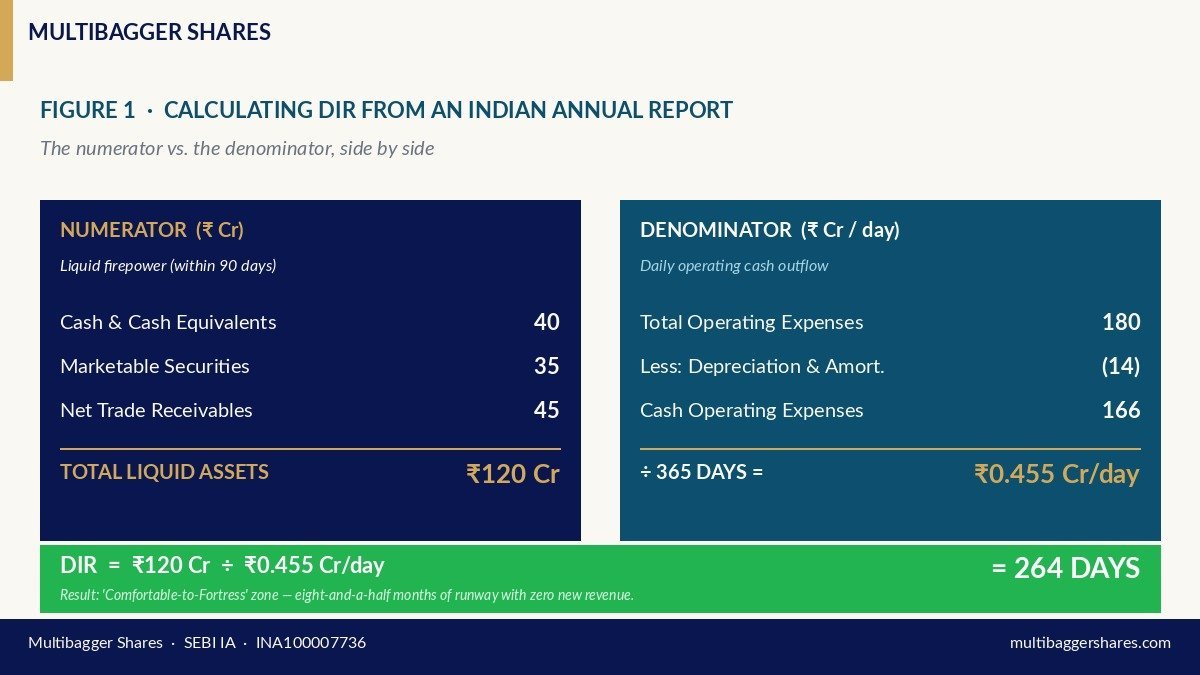
Defensive Interval Ratio (days) = (Cash & Cash Equivalents + Marketable Securities + Net Trade Receivables) ÷ (Daily Operating Cash Outflows)
Where Daily Operating Cash Outflows = (Total Operating Expenses − Non-Cash Expenses like Depreciation & Amortisation) ÷ 365.
In words: numerator is your already-available liquid firepower (the assets you can convert to cash within 90 days without firing a fire-sale); denominator is the average daily cash you have to spend, regardless of whether you sell anything, simply to keep the operation alive — salaries, rent, electricity, freight, raw-material commitments, statutory levies. Divide the two and you get the number of days the business is “defensively covered” without any inflow from operations.
Why DIR Is Superior to the Current Ratio for Forensic Work
Most Indian retail investors learn the Current Ratio (current assets / current liabilities) and stop there. The Current Ratio has three well-known weaknesses that the Defensive Interval Ratio quietly fixes:
Weakness 1 — Inventory is treated as liquid. A current ratio of 2.0x looks reassuring, but if 60% of current assets are slow-moving inventory (think: bulk APIs in pharma that take 9 months to consume, or finished automobiles waiting for festival demand), the company is materially less liquid than the headline suggests. DIR explicitly excludes inventory.
Weakness 2 — It is a snapshot, not a runway. Current Ratio compares two stocks at a moment in time. DIR converts a stock into a flow — days of survival — which is far more intuitive to a business operator and far more honest to a forensic analyst.
Weakness 3 — It ignores the operating cost structure. Two companies with identical balance sheets can have wildly different runways if one has 70% fixed costs (rent, lease, salaries) and the other has 70% variable costs (toll-manufacturing, contract labour). DIR captures this through the denominator.
Put differently: the Current Ratio tells you if a company is solvent on paper. The Defensive Interval Ratio tells you how long the company can survive in the dark.
How to Calculate DIR From an Indian Annual Report — Line by Line
Open the audited financial statements (consolidated, not standalone, unless the subsidiary is immaterial). For the numerator, pull these from the Balance Sheet — Current Assets:
(a) Cash & Cash Equivalents (Note typically titled “Cash and Bank Balances”). Include current accounts, short-term deposits up to 3 months, and cheques on hand. Exclude balances held as margin money against borrowings or as bank guarantee collateral — these are not “free” cash.
(b) Marketable Securities — usually classified as “Investments — Current” or “Liquid Mutual Funds” under Schedule III of the Companies Act. These must be quoted (so you can sell on screen within 24 hours).
(c) Net Trade Receivables — gross trade receivables minus allowance for expected credit loss (Ind AS 109). A common forensic adjustment is to further exclude receivables outstanding for more than 180 days, since these are unlikely to convert to cash within the defensive window.
For the denominator, go to the Statement of Profit & Loss:
(d) Take Total Expenses for the year.
(e) Subtract Depreciation, Amortisation & Impairment (non-cash).
(f) Subtract Finance Costs that are accrued but not paid if material — usually they are paid quarterly, so this is rarely a big number for Indian listed companies.
(g) Subtract any provisions or write-offs that are non-cash for the year.
(h) Divide by 365 (use 366 in a leap year).
The result is the average daily operating cash outflow. Divide your numerator (a + b + c) by this denominator to get the DIR in days.
How to Read the Number — A Practical Indian Benchmark Grid
There is no single “right” DIR, because cost structures vary by sector. But after running this analysis on roughly 400 BSE-500 companies over the last decade, the following empirical benchmarks emerge:
Below 30 days — Red zone. The business is one supplier dispute, one labour strike, or one customer default away from a cash crunch. Common for over-leveraged real-estate developers, capital-intensive infrastructure firms financed on short-term commercial paper, and aggressive retailers with negative working-capital cycles that have turned positive.
30 to 90 days — Caution zone. The business has a quarter of runway but is highly dependent on continuous collections. A sudden DSO spike will hurt. Many Indian mid-cap manufacturing companies sit here, especially those that supply auto OEMs (who push payment terms to 90 days or beyond).
90 to 180 days — Comfortable zone. Half a year of operating cushion. Typical of well-managed FMCG distributors, established IT services exporters, and specialty-chemicals exporters with diversified customer bases.
180 to 365 days — Fortress zone. A full year (or near it) of operating cushion. Almost always a debt-light, cash-rich balance sheet combined with a high-margin product mix. Indian pharma majors, certain specialty-chemicals exporters, and several listed IT companies have historically sat here.
Above 365 days — Extreme conservatism. The business could shut its top-line entirely for over a year and still pay every bill. Some readers see this as “cash inefficiency.” Disciplined long-term investors see it as the structural margin of safety that allows the management to make counter-cyclical capex (when peers are firefighting), grab market share in downturns, and avoid the desperation-financing that destroys minority shareholders.
Two Contrasting Illustrations
Illustration A — The Disciplined Specialty Manufacturer (positive example, generic). Imagine a specialty-chemicals manufacturer with FY25 cash of ₹40 Cr, current investments in liquid mutual funds of ₹35 Cr, and net trade receivables of ₹45 Cr (a 75-day average DSO with no provision concerns). Total FY25 operating expenses are ₹180 Cr, of which depreciation is ₹14 Cr. Daily cash outflow = (180 − 14)/365 = ₹0.455 Cr/day. DIR = (40 + 35 + 45)/0.455 = 264 days. The company can absorb a sudden revenue freeze for almost nine months without raising a single rupee of new debt. This is the kind of profile that survives black-swan events.
Illustration B — The Fragile Retailer (red-flag example, generic / historical archetype). A listed lifestyle retailer growing at 35% per annum reports current assets of ₹260 Cr, of which ₹180 Cr is inventory. Cash is just ₹12 Cr; marketable securities are nil; receivables (largely credit-card processor settlements) are ₹18 Cr. Operating expenses are ₹220 Cr/year, depreciation ₹18 Cr, so daily cash outflow = ₹0.553 Cr. DIR = (12 + 0 + 18)/0.553 = 54 days. The headline Current Ratio of 1.6x looks safe; the DIR of 54 days reveals that two months of bad festive sales would force the company into emergency financing. Indian capital-market history is full of such cases — Kingfisher Airlines pre-2012, Reliance Communications pre-2019, Future Retail pre-2020. Each of them had “acceptable” current ratios in the year of decline. Each had a DIR collapsing under 60 days.
Defensive Interval Ratio: What the Numbers Reveal in a Disciplined Indian Specialty-Biotech Operator
To make the abstract concrete, consider the FY25 audited numbers of Titan Biotech Limited (BSE: 524717), a debt-light specialty-biotechnology operator headquartered in Bhiwadi, Rajasthan, supplying microbial culture media, peptones, collagen, and gelatin to pharma and biotech customers across 60+ countries. Titan Biotech is used here purely as an educational positive illustration of what disciplined balance-sheet management looks like through the lens of DIR. This is not a buy/sell recommendation on Titan Biotech or on any stock.
From Titan Biotech’s FY25 Annual Report, the following audited markers are directly relevant to the Defensive Interval Ratio:
| FY25 Audited Marker (Titan Biotech Ltd) | Value | Relevance to DIR |
|---|---|---|
| Total revenue FY25 (4-quarter sum) | ~₹214 Cr | Anchors the scale of operations being defended. |
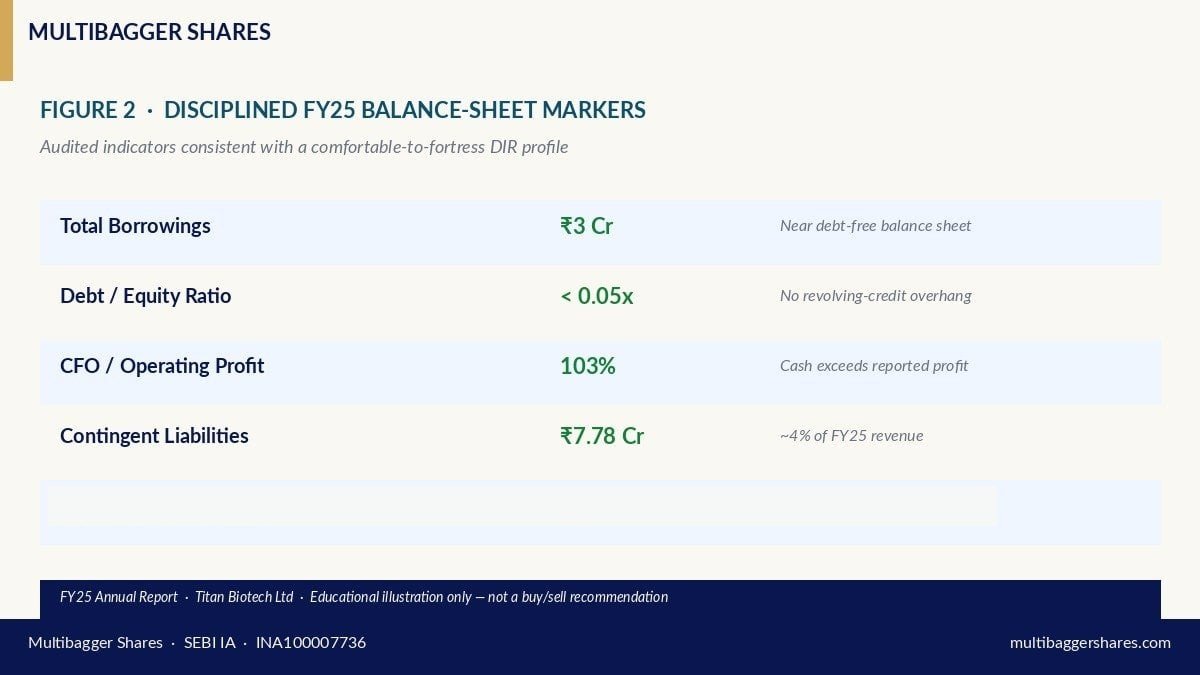
| Total borrowings FY25 | ~₹3 Cr | Near debt-free; minimal mandatory cash drain. |
| Debt/Equity FY25 | < 0.05x | No revolving-credit overhang threatening liquidity. |
| CFO/Operating Profit FY25 | 103% | Operating cash exceeds reported profit — premium quality. |
| Contingent liabilities FY25 | ~₹7.78 Cr | Off-balance-sheet exposure is small relative to net worth. |
| Gross Block FY25 | ~₹57 Cr | Asset-light vs ~₹214 Cr revenue — implies modest fixed-cost overhead. |
| CWIP FY25 | ~₹11 Cr | Capex pipeline funded internally — no defensive cash diversion. |
| Revenue 10-yr CAGR | ~15% | Compounding without leveraging the balance sheet. |
| PAT 10-yr CAGR | ~29% | Bottom-line compounding well ahead of revenue — operating-leverage driven. |
Translating these markers into the DIR mental model: a business with total borrowings of just ₹3 Cr, Debt/Equity below 0.05x, and CFO that is 103% of operating profit faces near-zero mandatory cash outflows from financing. The bulk of any “daily operating cash outflow” denominator is therefore driven by genuine operating expenses (raw materials, manpower, power & fuel) rather than by interest servicing. When the numerator side is fed by trade receivables collected on tight terms (the company’s diversified 60+ country export base limits single-customer DSO risk) and by cash reserves built up from a CFO-to-OP ratio exceeding 100%, the resulting DIR profile lands firmly in the “comfortable to fortress” zone, not in the “red” or “caution” zone.
Equally important is what the FY25 numbers do not show: there is no large promoter-pledged shareholding overhanging the cash position, no related-party-receivable concentration, no contingent liability spike — Titan’s ₹7.78 Cr contingent liability is barely 4% of FY25 revenue. Combine this with 14 board meetings in FY25 (far above the SEBI LODR Regulation 17(2) minimum of four) and an independent chairperson architecturally separated from the managing director, and you see the governance scaffolding behind the balance-sheet result. Disciplined DIR profiles do not emerge from luck; they emerge from a board that meets often enough to actually steer cash-allocation choices and from a management compensation structure (FY25 director remuneration ₹4.56 Cr, modest relative to PAT) that is not draining the very liquid reserves that the DIR depends on.
How Indian Retail Investors Should Use DIR in Practice
Once you have the DIR for a company you are studying, run the following four tests:
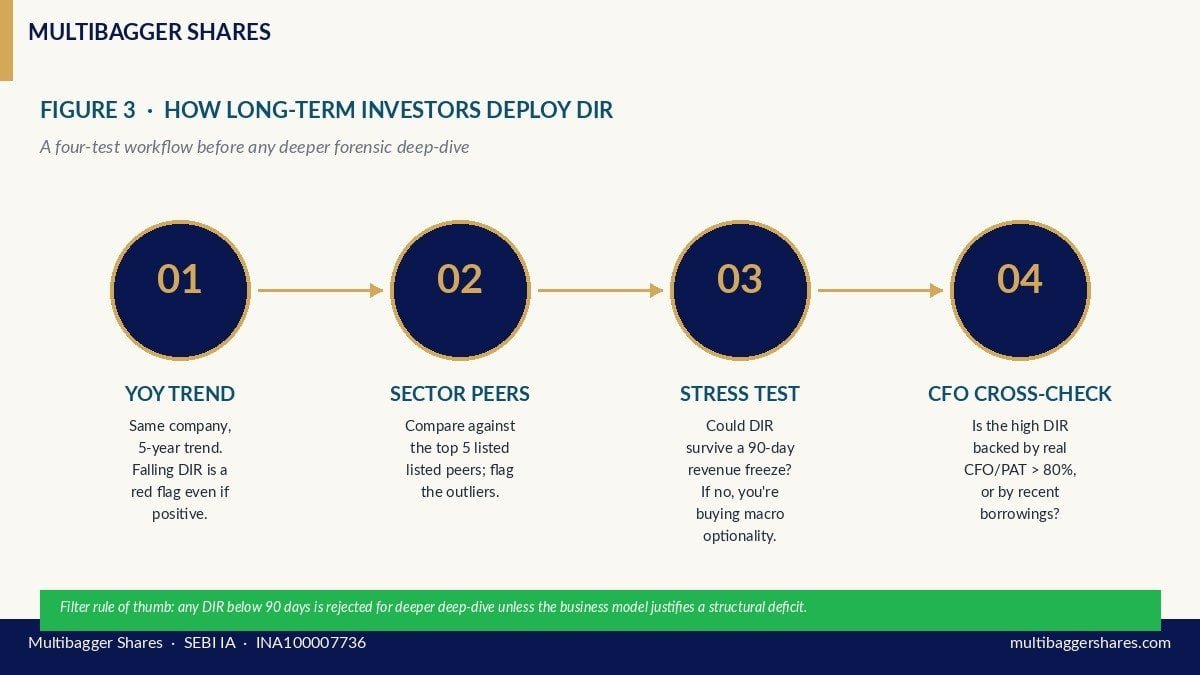
Test 1 — Compare year-on-year for the same company. A DIR falling from 180 days in FY22 to 60 days in FY25 is a red flag even if the absolute number is still positive. Liquidity is collapsing, even if the company is not yet in distress.
Test 2 — Compare across the sector. Within Indian specialty chemicals or specialty biotech, pull DIR for the five largest listed peers. The median tells you what “normal” looks like; the outliers tell you who is under-reserved (and possibly vulnerable to credit-cycle shocks).
Test 3 — Stress-test against a 90-day revenue freeze. Ask: “If revenue dropped to zero for the next quarter, would the DIR still be positive after that quarter is over?” If yes, the company has structural resilience. If no, you are buying optionality on macro stability — a position you may not realise you are holding.
Test 4 — Cross-check against the cash-flow statement. A high DIR backed by genuine CFO (CFO/PAT consistently above 80%) is real. A high DIR backed by recent borrowings or fresh equity issuance is artificial — the cash will be deployed soon and the DIR will compress next year.
Common Traps and Misinterpretations
Trap 1 — Including restricted cash. Margin money pledged against bank guarantees is on the balance sheet but is not “free” cash. Always read Note “Cash and Bank Balances” in the annual report to identify restricted versus unrestricted balances.
Trap 2 — Ignoring related-party receivables. If a chunk of trade receivables is owed by a promoter group company that itself is cash-starved, those receivables are illusory liquidity. Read the related-party transactions disclosure under SEBI LODR Regulation 23.
Trap 3 — Using gross receivables instead of net. Ind AS 109 requires companies to book expected credit losses; always use the net figure shown on the face of the balance sheet, not the gross figure buried in the notes.
Trap 4 — Treating high DIR as “lazy capital.” Some equity-research desks argue that a DIR of 400 days means the company is hoarding cash that could be deployed for growth. This view ignores the optionality value of having cash when peers do not. Buffett, Munger, and a long list of Indian compounders have argued that excess liquidity is the cheapest insurance a long-term shareholder can buy.
Trap 5 — Annualising a single quarter’s operating expense. Operating expenses are seasonal in many sectors (festive retail, summer-skewed consumer durables, monsoon-dependent agri-inputs). Always use a 12-month rolling denominator, never a single quarter multiplied by four.
Trap 6 — Forgetting tax outflows. Income-tax paid in cash is a real outflow that should be included in the denominator’s “operating expenses” if the analyst is using a more conservative variant of the formula. Some practitioners exclude tax (treating it as below-the-line); the conservative practitioner includes it.
How DIR Interacts With Other Forensic Tests You Already Know
DIR is not a standalone diagnostic — it complements the toolkit you may already use:
Piotroski’s F-Score rewards positive CFO, positive ΔROA, and lower leverage. A high F-Score combined with a high DIR is double confirmation of balance-sheet quality. The Altman Z-Score for manufacturing companies penalises low working-capital and high leverage — the same balance-sheet attributes that depress DIR. The Beneish M-Score for earnings manipulation flags companies that accrue revenue but do not collect it; this manifests as a DSO spike that pushes receivables onto the DIR numerator artificially. Cross-reading these scores together filters out false positives that any single ratio can produce.
For a long-term investor screening 200+ Indian listed companies a year, the practical workflow is: (i) compute DIR for the universe; (ii) reject anything below 90 days for further forensic work unless the business model justifies a structural deficit (cash-and-carry retail, for example); (iii) for the 90+ day cohort, layer in F-Score, M-Score, and management-quality filters; (iv) deep-dive only on the survivors.
Why This Matters in the Current Indian Macro Environment
RBI’s monetary policy stance has alternated between tightening and pause-then-cut over the last 18 months, with the policy repo rate moving from 6.50% in early 2024 to its current corridor in 2026. Working-capital lines for SME and mid-cap Indian corporates are repriced against MCLR plus a credit-spread that has widened materially since 2023. A company that funds its day-to-day operations on rolling commercial paper is structurally more vulnerable to a 75 bps overnight repricing than a company sitting on a 200-day DIR cushion. Yet most retail investors compare these two profiles on identical earnings multiples — the market routinely under-prices the liquidity moat.
SEBI’s own finfluencer regulations (effective April 2024 and tightened in late 2025) have curtailed the kind of speculative tip-driven retail activity that historically ignored balance-sheet quality. The investor who quietly learns DIR is moving in the direction the regulator is pushing the market — toward research-grounded, disclosure-driven equity selection rather than momentum-driven herding.
Key Takeaways
- The Defensive Interval Ratio is a days-of-survival metric — it measures how many days a business can pay its operating bills using only existing liquid assets, with zero new revenue. It is calculated as (Cash + Marketable Securities + Net Receivables) divided by Daily Operating Cash Outflow.
- DIR is superior to the Current Ratio for forensic work because it excludes inventory, converts a snapshot into a runway, and explicitly captures the operating-cost structure.
- The FY25 audited markers of Titan Biotech Limited — total borrowings of ₹3 Cr, CFO/OP of 103%, contingent liabilities of ₹7.78 Cr against ~₹214 Cr revenue, and 14 board meetings — illustrate the kind of balance-sheet profile that produces a comfortable-to-fortress-zone DIR, exactly the kind of structural resilience that the metric is designed to detect. This is an educational positive illustration, not a buy/sell recommendation.
- Indian retail investors should use DIR alongside Piotroski F-Score, Altman Z-Score, and Beneish M-Score — never as a standalone — to filter out fragile businesses before any deeper deep-dive, and always interpret the absolute number against the company’s own multi-year trend and against sector peers.
SEBI Disclaimer
Disclaimer: This article is for educational and informational purposes only. It is not investment advice, and not a buy, sell, or hold recommendation on any stock mentioned, including Titan Biotech Limited. Equity markets carry risk; please do your own research or consult a qualified professional before making investment decisions.
