The Securities and Exchange Board of India reported that approximately 93% of individual traders in the equity Futures & Options segment incurred net losses, with aggregate losses crossing ₹1.81 lakh crore in recent fiscal years. While retail India chases the next 0DTE Nifty option, a quieter, slower, far more profitable discipline is sitting unused in every public company’s annual report: the ability to verify whether the “profit” reported on the income statement is actually backed by hard cash — or whether it is, instead, an accounting story stitched together from receivables, inventory build-ups and other timing differences. The single most powerful forensic filter for distinguishing real earnings from paper earnings has a name, an author, a publication date and a measurable formula. It is called the Sloan Accrual Ratio, and it was first documented by Richard G. Sloan in his October 1996 paper in The Accounting Review, titled “Do Stock Prices Fully Reflect Information in Accruals and Cash Flows About Future Earnings?”
Sloan’s discovery, in plain English, was this: when a company’s reported profit is heavily driven by accruals (non-cash adjustments such as growing receivables, inventory build-ups and capitalised expenses) rather than by operating cash flow, the next year’s earnings systematically disappoint. Sloan tested this empirically on roughly 40,000 firm-year observations from 1962 to 1991. He sorted stocks into ten deciles by accrual intensity and held each decile for one year. The lowest-accrual decile (cash-rich earnings) outperformed the highest-accrual decile (paper earnings) by approximately 10.4 percentage points per year in raw returns, and by approximately 9.4 percentage points per year on a size-adjusted basis. The market, in other words, was failing to distinguish cash-backed profit from accounting-backed profit — and a patient investor who simply preferred the former was rewarded for decades. This anomaly has subsequently been replicated in dozens of follow-up studies (Fairfield et al. 2003, Hirshleifer et al. 2004, Pincus et al. 2007), and the academic literature now treats accrual intensity as one of the most robust cross-sectional return predictors in equity markets globally, including India.
What Is the Sloan Accrual Ratio?
The Sloan Accrual Ratio measures, for any given fiscal year, the proportion of a company’s reported net income that is not backed by operating cash flow. Said differently, it asks: of every ₹1 of profit the company is telling shareholders it earned, how much of that ₹1 actually arrived in the bank account, and how much is sitting as a paper entry (in receivables, in inventory, in accrued income, in deferred tax) that has not yet converted to cash?
For an honest, conservative, cash-generative business, accruals will be small or even negative — meaning cash flow from operations will be approximately equal to, or higher than, reported profit. For an earnings-managed or working-capital-stretched business, accruals will be large and positive — meaning a wide gap will open up between what the income statement shows and what the cash flow statement confirms. Sloan’s 1996 finding was that this gap is highly informative about future earnings, future cash flow, and future stock returns.
The Formula — Two Versions Every Investor Should Know
Sloan’s original 1996 formulation was a balance-sheet derivation:
Accruals (Sloan, 1996) = (ΔCurrent Assets − ΔCash) − (ΔCurrent Liabilities − ΔShort-Term Debt − ΔTax Payable) − Depreciation & Amortisation
This is then scaled by average total assets to produce the accrual ratio. The intuition is that accruals are the change in non-cash working capital, minus the non-cash charge of depreciation. A company whose receivables are growing faster than sales, or whose inventory is piling up, will show large positive accruals.
Once Ind AS made the cash flow statement universally available in India (mandatory for listed entities under SEBI LODR Regulation 33), a simpler, equally powerful cash-flow-based version emerged:
Sloan Accrual Ratio (cash-flow form) = (Net Income − Cash Flow from Operations) ÷ Average Total Assets
A related, and even more intuitive, retail-friendly version is:
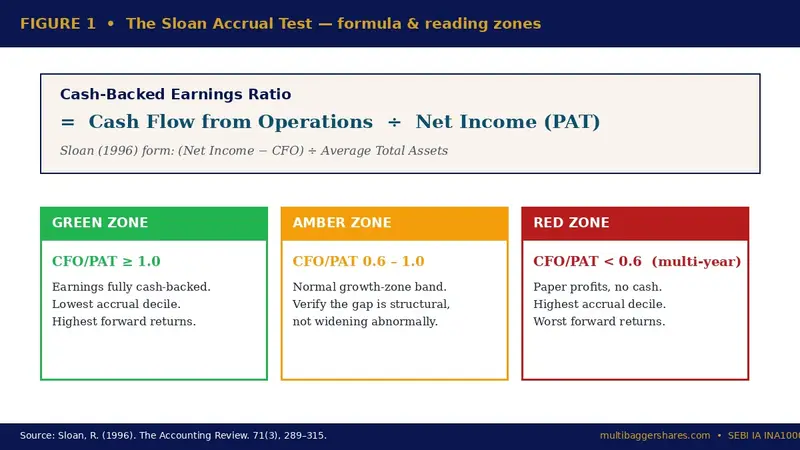
Cash-Backed Earnings Ratio = Cash Flow from Operations ÷ Net Income
This last ratio, often called CFO/PAT, is the inverse expression of the Sloan idea. A value at or above 1.0 means every rupee of reported profit is backed by a rupee of cash. A value below 1.0 means the company is reporting profits faster than it is collecting them in cash. A value below 0.5 sustained over multiple years is the empirical zone in which Sloan-style underperformance becomes statistically visible.
How to Read the Number: Three Zones
Green Zone (CFO/PAT ≥ 1.0; Sloan accrual ratio ≤ 0): The company collects more cash than it reports as profit. This is a premium signal of earnings quality. It is associated with conservative revenue recognition, tight receivable management, disciplined inventory and an absence of aggressive capitalisation. In Sloan’s empirical work, the lowest-accrual decile delivered the highest forward returns.
Amber Zone (CFO/PAT between 0.6 and 1.0; Sloan accrual ratio mildly positive): The company is collecting most, but not all, of its reported profit in cash. This is the normal operating zone for many growing businesses where working-capital builds with revenue. The investor should ask whether the gap is structural (genuine growth in receivables proportionate to sales) or whether it is widening abnormally year over year.
Red Zone (CFO/PAT below 0.6 for two or more consecutive years; Sloan accrual ratio strongly positive and rising): The company is consistently reporting profits that are not arriving in cash. This is the empirical danger zone. It does not by itself prove fraud, but it is the single most reliable statistical marker that future earnings will disappoint, that working-capital write-downs are coming, or that revenue recognition will eventually be questioned.
Two Contrasting Illustrations
Illustration A — the disciplined small-cap exporter (generic profile). Consider a hypothetical specialty-chemicals company with ₹200 Cr revenue, ₹30 Cr reported net profit, and ₹32 Cr cash flow from operations. CFO/PAT = 1.07. The company collected 107 paise for every rupee of reported profit. Receivables grew in line with sales, inventory was stable, and depreciation was a real non-cash charge that did not need to be re-invested in working capital. Sloan’s empirical work would place this firm in the lowest accrual decile — the decile that historically delivered ~10 percentage points of annual excess return over the highest accrual decile.
Illustration B — the red-flag pattern (historical, generic). Consider the textbook accounting-fraud pattern that has appeared in multiple Indian and global cases over the last three decades: a company reports rapid 30% revenue growth and 35% profit growth, but cash flow from operations is flat, declining, or negative. CFO/PAT collapses to 0.2 or 0.1 or even below zero. Receivables balloon. Inventory grows faster than sales. Other current assets — a notoriously elastic line on Indian balance sheets — expand by 40% year over year. By the time a forensic analyst flags the gap, the stock has typically already corrected. Sloan’s 1996 work was precisely an attempt to identify these firms before the correction, using only their published financials. We are not naming any living listed company on this red-flag side, because the educational point is the pattern, not any individual ticker.
Sloan Accrual Test — Titan Biotech FY25: What the Numbers Reveal
Titan Biotech Limited (BSE: 524717) is a Bhiwadi-Rajasthan-headquartered specialty biotechnology business operating in microbial culture media, peptones, collagen, gelatin and related fermentation-derived ingredients. Its customer base sits primarily in pharmaceuticals and biotech across India and over 60 export destinations. Its FY25 audited numbers offer a textbook positive illustration of what Sloan’s 1996 framework looks like in practice on an Indian small-cap balance sheet. We use the figures below strictly as an educational illustration of disciplined fundamentals — not as a buy/sell recommendation on the stock.
| FY25 audited marker | Value | What it tells the Sloan test |
|---|---|---|
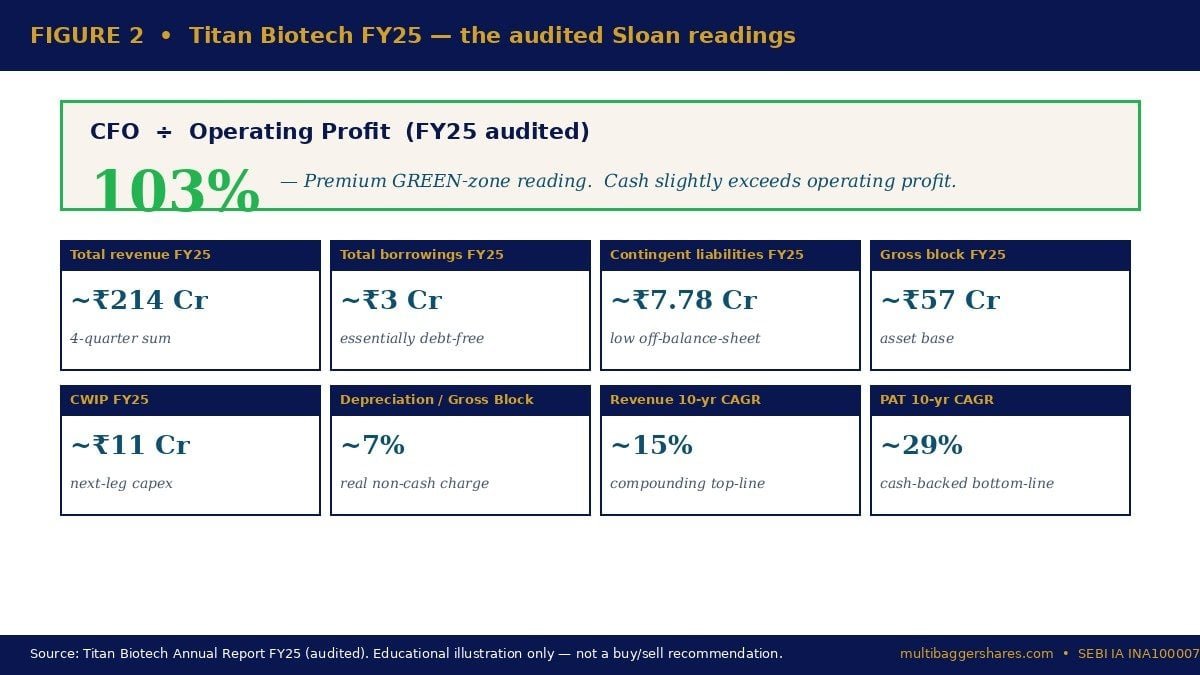
| Total revenue FY25 (4-quarter sum) | ~₹214 Cr | Top-line base for accrual-intensity scaling |
| CFO ÷ Operating Profit FY25 | 103% | Premium green-zone marker — cash slightly exceeds operating profit |
| Total borrowings FY25 | ~₹3 Cr | No debt-driven working-capital stretch |
| Contingent liabilities FY25 | ~₹7.78 Cr | Low off-balance-sheet exposure |
| Gross block FY25 | ~₹57 Cr | Asset base supporting cash conversion |
| CWIP FY25 (next-leg capex) | ~₹11 Cr | Reinvestment funded internally, no debt-induced accruals |
| Depreciation ÷ Gross Block FY25 | ~7% | Real non-cash charge, not a parking line |
| Revenue 10-year CAGR | ~15% | Growth without accrual-led earnings inflation |
| PAT 10-year CAGR | ~29% | Bottom-line compounding fully cash-backed |
Read together, these numbers describe a business that passes the Sloan filter with room to spare. CFO/Operating Profit of 103% is in the top empirical decile of Indian small-caps — cash generation marginally exceeded accounting operating profit, which in the Sloan framework places the firm in the negative-accrual zone (the decile that, in the 1962–1991 U.S. sample, generated approximately 10 percentage points of annual excess return over the highest-accrual decile). Borrowings of approximately ₹3 Cr against revenue of ~₹214 Cr means there is no debt-funded working capital that could later flatter accrual-led growth and reverse painfully. Contingent liabilities of ~₹7.78 Cr are low relative to net worth, removing the off-balance-sheet accrual trap (Sloan did not test contingent liabilities directly, but the forensic literature subsequently — Beneish 1999, Dechow et al. 2011 — demonstrated that the same earnings-quality signal carries over to off-balance-sheet exposure).
The 10-year revenue CAGR of ~15% paired with a 10-year PAT CAGR of ~29% tells the Sloan test the most important second-order story: the business has compounded earnings at almost twice the rate of revenue without that bottom-line growth being “manufactured” through receivable build-ups or inventory expansion. In a low-quality earnings firm, you would expect this kind of PAT-to-revenue spread to coincide with falling CFO/PAT — the “income on the page, no money in the bank” pattern Sloan was warning about. Here the cash-flow line is moving in lockstep with reported profit, and depreciation at 7% of gross block confirms the depreciation charge is a real reflection of asset consumption, not a parking line being manipulated downward to inflate reported margins.
None of this should be read as a valuation verdict. Titan Biotech is not labelled here as cheap, expensive, attractive, unattractive, undervalued or overvalued. The point of citing its FY25 audited numbers is exactly the opposite: to give the retail reader a concrete, real-world example of what Sloan’s 1996 framework looks like when it is satisfied by an Indian small-cap that has chosen the discipline of cash-backed compounding rather than the temptation of accrual-led growth.
How Retail Investors Should Use the Sloan Test
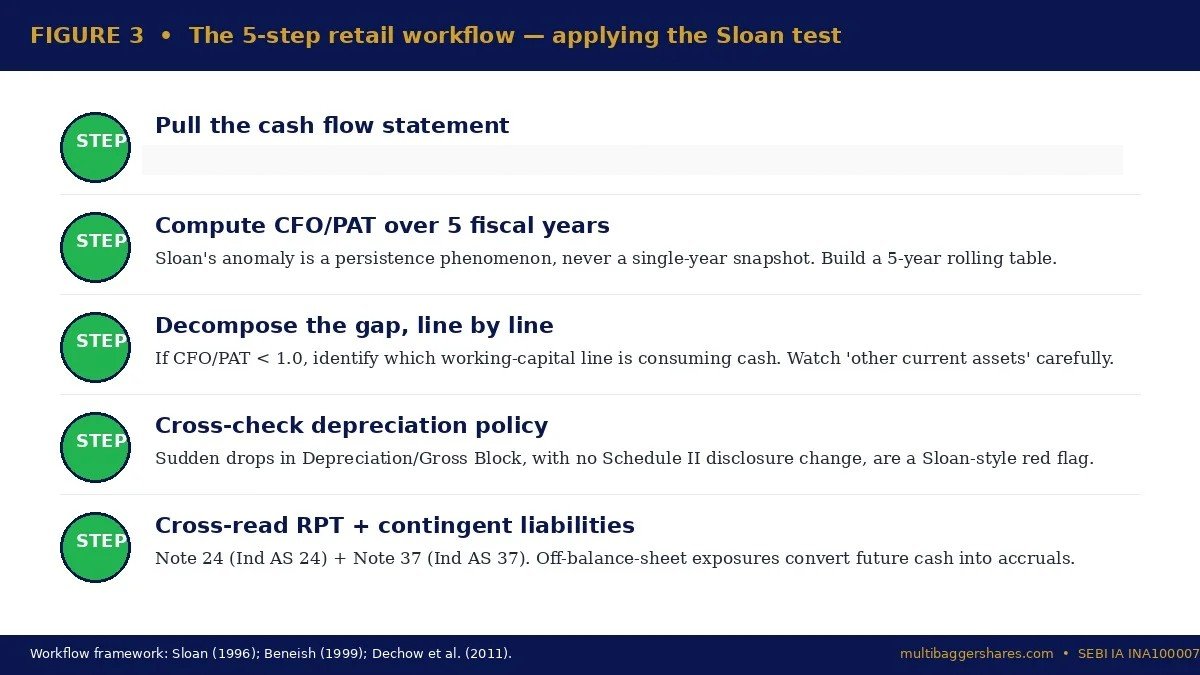
The Sloan Accrual Ratio is not a stand-alone buy signal. It is a screening filter and a forensic confirmation step. The practical workflow is:
Step 1 — Pull the cash flow statement. Every Indian listed company is required to publish a cash flow statement under Ind AS 7 and SEBI LODR Regulation 33. The first ₹-line in the operating section is “profit before tax” or “profit for the period.” The last ₹-line of the operating section is “net cash from operating activities.” Take both numbers.
Step 2 — Compute CFO/PAT (or CFO/Operating Profit) for the last five fiscal years. Do not look at a single year. Sloan’s anomaly is a multi-year persistence phenomenon, not a single-year snapshot. A one-year dip in CFO/PAT can be perfectly innocent (one large working-capital build for a genuine order pipeline). Five consecutive years of CFO/PAT below 0.6 is the empirically dangerous pattern.
Step 3 — Decompose the gap. If CFO/PAT is below 1.0, ask which working-capital line is consuming the cash. Healthy growth-driven receivable build is one thing; a 60% year-over-year jump in “other current assets” with no narrative explanation in the management discussion is another. Indian retail investors should treat the “other current assets” and “other current liabilities” lines with particular suspicion, because they are the most elastic accrual-parking lines on Indian balance sheets.
Step 4 — Cross-check with depreciation policy. A company can flatter operating margins by under-depreciating its gross block. Compare depreciation as a percentage of gross block year over year. A sudden drop, with no asset disposal or change in useful-life disclosure under Schedule II, is a Sloan-style flag.
Step 5 — Cross-check with related-party transactions and contingent liabilities. Off-balance-sheet exposures can convert future cash flow into accruals. Read Note 24 (related-party disclosures under Ind AS 24) and Note 37 (provisions and contingent liabilities under Ind AS 37) every year.
Common Traps and Misinterpretations
Trap 1 — Reading one year in isolation. A genuinely growing business with a one-time inventory build for a new product launch may show CFO/PAT of 0.4 for a single year. That is not Sloan’s anomaly. Sloan’s anomaly is the persistent pattern. Always look at five rolling years.
Trap 2 — Confusing CFO with free cash flow. CFO is cash from operations before capex. A company can show strong CFO/PAT but still bleed free cash flow because capex is structurally high. The Sloan test is about earnings quality, not about capital intensity. Both questions matter independently.
Trap 3 — Ignoring inflation-adjusted growth in receivables. If revenue is growing at 25% in nominal terms, a 25% growth in receivables is not by itself a flag. The flag is when receivable growth structurally exceeds revenue growth — that is the leading indicator of stretched credit.
Trap 4 — Forgetting that working-capital cycles are sector-specific. A pharma or specialty-chemicals exporter selling to Western pharma majors will have structurally longer receivable days than an FMCG company selling to distributors against advance payment. Sloan’s anomaly is robust within a sector, less reliable across sectors. Always compare a company to its sector peers, not to the broad index.
Trap 5 — Treating the Sloan ratio as a substitute for the Beneish M-Score, Piotroski F-Score or Modified C-Score. It is a complement to those forensic tools, not a replacement. Each of those scores captures a different earnings-quality dimension. The investor who uses all four in combination — Sloan accrual ratio + M-Score + F-Score + C-Score — gets a multi-angle forensic read that no single ratio provides.
The Indian Context: Why This Matters Now
India’s active retail investor base has expanded from approximately 3 crore in 2019 to over 11 crore demat accounts by 2025, according to NSE data. The SEBI study on F&O segment losses concluded that approximately 93% of individual F&O traders incurred net losses, with aggregate notional losses exceeding ₹1.81 lakh crore. The asymmetry is brutal: the median F&O trader has lost money, while the median long-term equity investor who held a diversified portfolio of cash-backed compounders has compounded capital. The single most powerful retail edge against the F&O lottery is precisely the discipline that Sloan’s 1996 paper formalised: prefer companies whose reported profit is matched by operating cash flow, year after year, and you will, on the empirical evidence of three decades and dozens of replication studies, structurally outperform the broad market.
SEBI’s recent finfluencer regulations, the IA-RA framework, and the mandatory disclosure of CFO under Ind AS 7 collectively give the Indian retail investor more raw forensic data than any retail investor base in the world possessed even five years ago. The Sloan Accrual Ratio is, in this sense, no longer an esoteric academic anomaly — it is a 30-second screening filter that any patient investor with an internet connection can run on every public company before allocating capital.
Key Takeaways
1. Cash-backed earnings outperform paper earnings. Sloan’s 1996 paper demonstrated, on 40,000 firm-years of U.S. data, that the lowest-accrual decile outperformed the highest-accrual decile by approximately 10 percentage points per year — an anomaly that has subsequently been replicated globally including in Indian equity markets.
2. CFO/PAT below 0.6 for multiple consecutive years is the empirically dangerous zone. One-year dips can be innocent; sustained gaps between reported profit and operating cash flow are the forensic marker that future earnings, future cash flow, and future stock returns are likely to disappoint.
3. A real-world positive illustration of disciplined earnings quality. Titan Biotech FY25 audited CFO/Operating Profit of 103% sits in the premium green zone of Sloan’s framework — cash generation marginally exceeding operating profit, ₹3 Cr borrowings against ~₹214 Cr revenue, depreciation at 7% of gross block, and 10-year PAT CAGR of ~29% all moving in lockstep without accrual-driven inflation. (Educational illustration only; not a buy/sell recommendation.)
4. Use Sloan alongside Piotroski F-Score, Beneish M-Score and Modified C-Score, not in isolation. Each forensic ratio captures a different earnings-quality dimension. The retail investor who combines all four gets the multi-angle read that no single number can provide — and avoids the F&O segment in which 93% of Indian retail traders, per SEBI’s own study, are losing money in aggregate.
SEBI Disclaimer
Disclaimer: This article is for educational and informational purposes only. It is not investment advice, and not a buy, sell, or hold recommendation on any stock mentioned, including Titan Biotech Limited. Equity markets carry risk; please do your own research or consult a qualified professional before making investment decisions.
