India crossed 11 crore unique demat accounts in 2025 — almost a 4x jump from the 3 crore investor base we had as recently as January 2020. Yet the SEBI study on individual F&O traders is unforgiving: nine out of every ten retail F&O participants lost money in the equity derivatives segment, with aggregate retail losses of roughly ₹1.81 lakh crore in a single financial year. The gap between participation and outcome is not bad luck. It is the gap between people who trade prices and people who own businesses that compound their profit pool year after year.
Of all the metrics that separate the second group from the first, few are as quietly powerful — and as widely ignored on Indian Twitter and YouTube — as the 10-Year Profit After Tax (PAT) Compound Annual Growth Rate. It is the single most concentrated way to express what really happened to a business across a full decade. Today we slow down and learn how to read it properly.
What Is 10-Year PAT CAGR, in Plain English
PAT — Profit After Tax — is the last line of the Profit & Loss statement. It is what remains for shareholders after the company has paid every supplier, every employee, every interest cost, every tax due to the Government of India. It is the cleanest, most legally final measure of what the business actually earned in a year.
CAGR — Compound Annual Growth Rate — is the constant annualised rate at which a starting value would have to grow, with annual compounding, to reach an ending value over a given number of years. It smooths out the year-to-year noise so you can compare two businesses on a like-for-like basis.
Put the two together over a ten-year window and you get a single number that answers the most important question in fundamental analysis: over a full decade, how fast did this company actually grow its bottom-line earnings power?
Ten years is not an accidental choice. It is long enough to span at least one full economic cycle in India (we have lived through demonetisation in 2016, GST roll-out in 2017, IL&FS in 2018, Covid in 2020, the 2022 inflation shock, the 2024 small-cap correction). It is long enough that one good year or one bad year cannot dominate the average. And it is long enough that any management excuse — “just one tough quarter” — runs out of road.
The Formula — and Why You Must Compute It Yourself
The mathematics is plain and unforgiving:
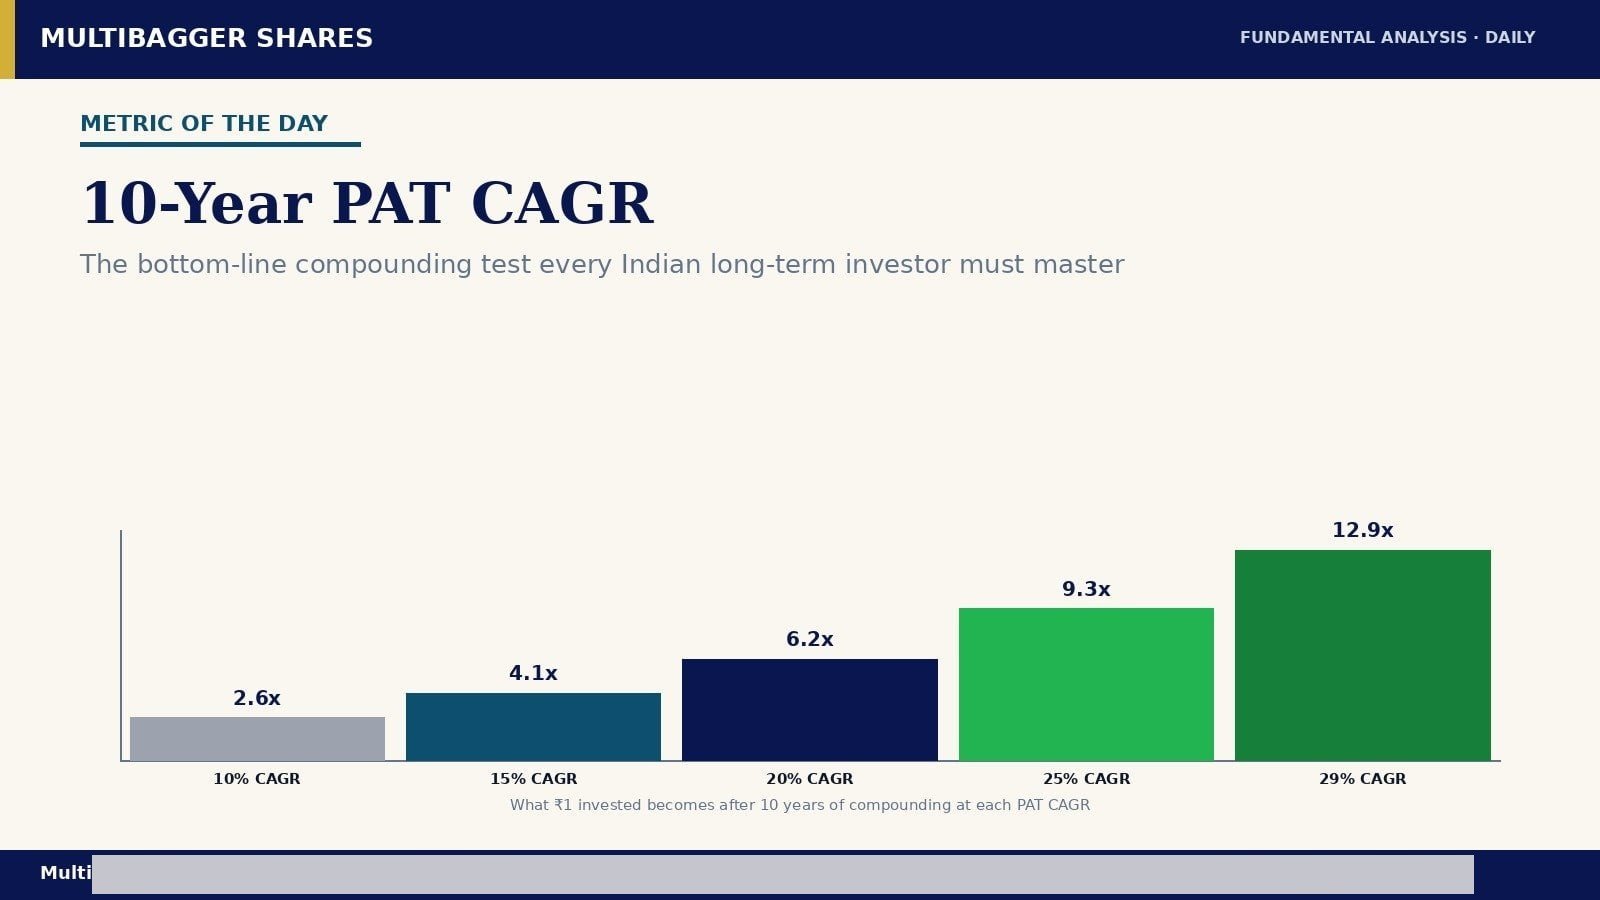
10-Year PAT CAGR = ( PAT in Year 10 ÷ PAT in Year 1 ) ^ ( 1 ÷ 10 ) − 1
If a company earned ₹10 crore of PAT in FY15 and ₹130 crore of PAT in FY25, the calculation is (130 ÷ 10) ^ (1 ÷ 10) − 1 = 13 ^ 0.1 − 1 = 0.2922, or roughly 29.2% per annum. That is genuine bottom-line compounding.
Two warnings on the inputs. First, always use consolidated PAT, not standalone. Standalone numbers exclude profits or losses from subsidiaries and can flatter or mask reality, particularly for Indian groups with overseas arms or holding-company structures. Second, never let yourself anchor on a single “starting year” the company chooses. Always pull the audited number from the actual FY15 annual report (or whatever your true Year-1 is) and recompute. Screener and similar tools are good starting points but they sometimes include extraordinary items or one-off tax credits in Year 1 or Year 10 that distort the rate. Five minutes with the audited annual reports is worth every minute.
How to Read the Number Once You Have It
Indian retail investors are conditioned to react to the word “CAGR” with awe. A 30% CAGR sounds extraordinary. A 12% CAGR sounds boring. In reality the “right” PAT CAGR depends on what the company does, what the industry does, and what the wider economy did over the same window.
As a rough Indian-context grid for the FY15–FY25 decade: nominal GDP growth was roughly 10–11%, the Nifty 50 earnings CAGR was around 11–12%, and quality compounder large-caps tended to deliver 13–17% PAT CAGR. Anything materially above that — sustainably, with the operating drivers visible — is rare and meaningful. Anything materially below is a question to investigate, not a verdict.
Two Contrasting Examples — A Disciplined Compounder and a Classic Trap
The disciplined compounder. Picture a hypothetical Indian specialty manufacturer with revenue growing at 14% CAGR over a decade, operating leverage taking EBITDA margin from 12% to 18%, no equity dilution, and a stable tax rate around 25%. Its revenue base grows roughly 3.7x. Because operating costs grow slower than revenue (fixed-cost absorption) and margin expands, PAT grows roughly 9.5x — a PAT CAGR around 25%. Each year, retained earnings get reinvested at a high incremental return, which is precisely what allows the next year’s PAT to be higher again. The system feeds itself. The cause of the high PAT CAGR is operating leverage and capital discipline, both of which are repeatable.
The classic trap. Now picture a hypothetical commodity-grade product business that — during a five-year cyclical boom in the middle of the decade — saw revenues grow at 25% per year and PAT grow at 40% per year. Year-10 PAT looks brilliant on a screener. But the second half of the decade looked nothing like the first. Margins peaked at 22% in Year 6 and have been sliding ever since toward the long-run industry average of 11%. The 10-year PAT CAGR captured the cycle, but the trailing three-year PAT CAGR is already negative. The cause of the apparent high PAT CAGR was a cyclical commodity tailwind, which is not repeatable. Many retail investors who bought such names on the strength of the past 10-year number have been holders of falling knives for two years and counting.
This is why the headline PAT CAGR is the start of the question, not the answer. You must also look at where the growth came from. Did revenue grow with it? Did margins expand sustainably, or did one-time tailwinds inflate Year 10? Was there equity dilution along the way that means PAT-per-share grew far slower than total PAT? Is the cash flow consistent with the reported profits? Is the incremental return on capital high enough to justify the implied reinvestment? A clean 25% PAT CAGR with healthy CFO/PAT, no dilution, and rising returns on capital is a different animal from a dirty 25% PAT CAGR built on cyclical accounting profit that never converted into cash.
Decomposing the PAT CAGR — Where the Growth Actually Came From
A useful mental model is to split the 10-year PAT CAGR into three additive drivers:
1. Revenue CAGR. This is the top-line growth engine — volume expansion, market share gains, new products, geographic spread.
2. Margin expansion contribution. If EBITDA margin moved from 12% to 18% over the decade, that adds roughly ln(18/12) ÷ 10 ≈ 4.05% per year to the PAT CAGR over and above revenue CAGR. The arithmetic does not have to be exact — what you need is to ask: did margins expand, stay flat, or contract?
3. Leverage / tax / non-operating drift. Did the interest cost shrink because debt was paid down? Did the effective tax rate change because of new tax regimes, R&D incentives, MAT credits? Did other income fluctuate? These items make up the rest of the spread.
A high-quality compounder will derive most of its PAT CAGR from drivers (1) and (2) — real business growth with real margin expansion. A low-quality compounder will show PAT CAGR concentrated in driver (3) — temporary tax windfalls, treasury gains, interest cost shrinkage that cannot repeat once the company is debt-free. When you read a 10-year PAT CAGR, always ask which bucket the growth came from.
Titan Biotech FY25: How the Numbers Illustrate Disciplined Bottom-Line Compounding
Titan Biotech Limited (BSE: 524717) — a Bhiwadi-headquartered specialty biotechnology company that manufactures microbial culture media, peptones, collagen, gelatin and related products for pharma and biotech customers across more than 60 countries — provides a useful case study in what a clean, operating-leverage-led 10-year PAT CAGR profile looks like in the Indian small-cap landscape. What follows is an educational illustration of the audited numbers and is not a buy, sell or hold recommendation on Titan Biotech or any other stock.
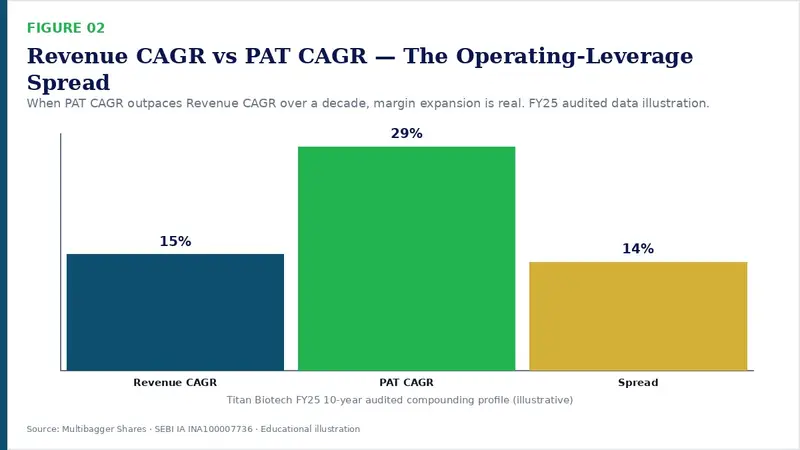
The most arresting numbers in Titan Biotech’s FY25 disclosures are the compounding ratios themselves. Revenue grew at roughly 15% CAGR over the 10-year window, while PAT grew at roughly 29% CAGR over the same window. That spread of about 14 percentage points per year is the visible signature of two things working together: real top-line growth and real operating leverage as scale absorbed fixed costs.
The supporting balance sheet and operating numbers explain why this profile was sustainable rather than cyclical:
| Titan Biotech FY25 audited marker | Reading for the 10-Year PAT CAGR lens |
|---|---|
| 10-year Revenue CAGR: ~15% | Top-line engine is real, not cyclical. |
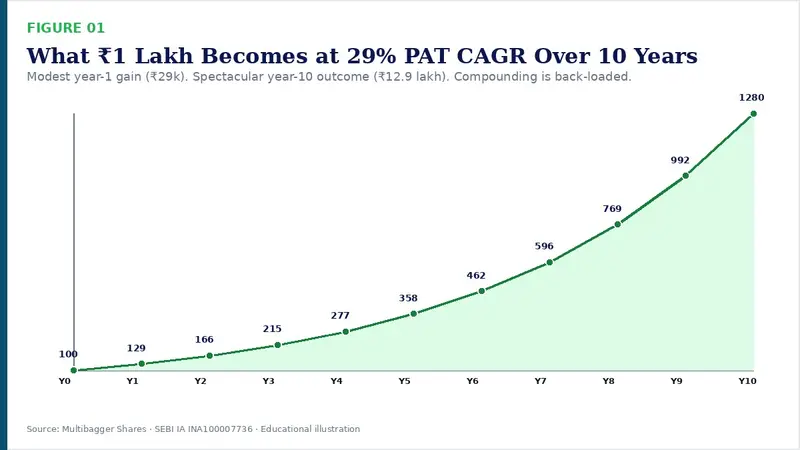
| 10-year PAT CAGR: ~29% | PAT compounded ~12.9x in a decade — premium territory. |
| FY25 total revenue: ~₹214 crore (₹46.5 → ₹54 → ₹56 → ~₹58 crore quarterly arc) | Sequential quarter-on-quarter expansion supports the headline rate. |
| Total borrowings FY25: ~₹3 crore (Debt/Equity < 0.05x) | PAT CAGR is not flattered by shrinking interest cost; it is operationally driven. |
| CFO / Operating Profit FY25: ~103% | Reported profits are fully cash-backed — the compounding is real money, not accounting accrual. |
| Gross block FY25: ~₹57 crore; CWIP ~₹11 crore | Capex pipeline is funded internally; future growth doesn’t require dilution or large debt. |
| Exports FY25: ~34.5% of revenue, 60+ countries | Geographic diversification reduces single-market sensitivity — the CAGR is structurally robust. |
| Contingent liabilities FY25: ~₹7.78 crore (small vs net worth) | Off-balance-sheet exposure won’t suddenly compress future PAT. |
| Board meetings FY25: 14 (vs SEBI minimum of 4); independent chairperson; director remuneration ~₹4.56 crore | Governance is engaged — the kind of oversight that protects compounding from being eroded by rent extraction. |
Read those rows together. The 29% PAT CAGR is not coming from a one-off tax credit, not from a cyclical commodity tailwind, not from financial leverage that artificially amplified earnings. It is coming from a 15% revenue CAGR colliding with operating leverage in a specialty biotech business that operates across 60+ countries with negligible debt and full cash backing of reported profits. The supporting numbers — fully cash-backed earnings, debt-light balance sheet, engaged independent-chair governance — are exactly the supporting cast that makes a 10-year PAT CAGR repeatable rather than coincidental.
That is the educational point. The headline rate alone tells you almost nothing. The audit trail behind the rate tells you everything. Once again: this is illustrative analysis of audited public disclosures, not a recommendation to buy or sell the stock.
The Four Archetypes of 10-Year PAT CAGR
When you sit with hundreds of Indian small-, mid-, and large-cap annual reports over enough years, you start to see that almost every PAT CAGR profile fits one of four archetypes. Identifying which archetype you are looking at is more useful than memorising any single number.
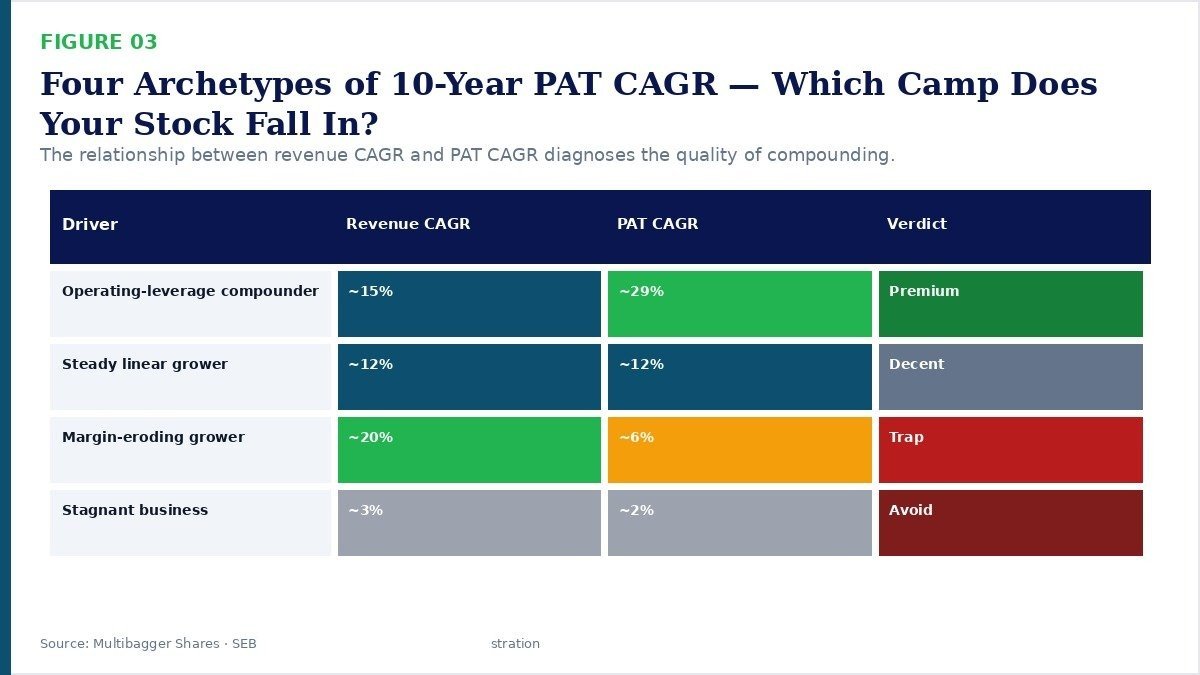
The operating-leverage compounder has PAT CAGR running well above revenue CAGR — typically a 10–15 percentage-point spread — sustained over a decade. The cause is a business model with high fixed costs and rising volumes that absorb those fixed costs (specialty manufacturers, software companies, asset-light platforms, niche chemicals, branded consumer firms with growing distribution scale).
The steady linear grower has PAT CAGR and revenue CAGR roughly equal — both around 10–14%. This is the “Nifty-50-like” profile. The business is good, governance is generally fine, but margins have hit their ceiling and incremental revenue compounds at the same rate as PAT. There is nothing wrong with this archetype; it just demands a more disciplined entry price.
The margin-eroding grower shows strong revenue CAGR but materially weaker PAT CAGR. This is the textbook value trap: the top line is moving, but competition or input-cost inflation is taking away the bottom line. Telecom in the 2010s and parts of organised retail in select windows fit this pattern.
The stagnant business shows revenue CAGR below nominal GDP, PAT CAGR even lower, and often a deteriorating balance sheet underneath. These are not low-PE bargains. They are slow capital destroyers.
How an Indian Retail Investor Should Actually Use This Metric
Make 10-Year PAT CAGR a screening filter, never a decision filter. Use it to narrow your universe, then do the real work on the survivors.
A reasonable Indian-context filter for a quality-compounder watchlist might be: PAT CAGR over 10 years above 14% on a consolidated basis, with revenue CAGR over the same window above 10%, with the most recent three-year PAT CAGR above 0% (no rolling-over of the curve), and with CFO/PAT averaging above 80% over the same decade. Stocks that survive all four filters are usually worth a full read of the annual report. Those that fail any one are usually not.
Then read. The annual report tells you whether the PAT CAGR was earned cleanly or borrowed from tomorrow. Read the auditor’s report, the related-party schedule, the contingent-liability footnote, the segment-reporting schedule, the cash-flow statement, the directors’ remuneration table. The numbers that survive the read are the ones worth tracking.
Finally, anchor your expectations. The headline India long-term equity index returns are roughly 12–13% CAGR over very long windows. Anything that promises 25%+ PAT CAGR for the next 10 years is making a claim that the market does not believe, which is exactly why such opportunities are rare and contested. Be more sceptical of large PAT CAGR claims, not less.
Common Traps and Misinterpretations
Trap 1: Cherry-picked start year. If Year 1 happens to be a Covid trough or a one-off loss year, the 10-year CAGR will look extraordinary purely because of base-year arithmetic. Always sanity-check Year 1 against the prior three years; if Year 1 looks anomalous, recompute using a normalised base.
Trap 2: Equity dilution ignored. A company can grow PAT at 20% CAGR while issuing 50% more equity — your share of the profits has grown far less. Always cross-check with PAT per share CAGR, not just absolute PAT CAGR.
Trap 3: One-off items in the end year. A treasury gain, a land sale, a one-time tax credit, an insurance settlement, an exceptional government incentive — all of these can inflate Year 10 PAT and create a phantom 10-year CAGR. Look for the line “exceptional items” in the P&L and adjust.
Trap 4: Forgetting the cycle. Cement, steel, sugar, paper, shipping, real estate — these are cyclical industries where the 10-year PAT CAGR depends almost entirely on which year of the cycle Year 1 and Year 10 happened to fall on. Apply the metric with extreme caution to cyclicals; complement with through-cycle averages.
Trap 5: Conflating PAT CAGR with shareholder return. A company can compound PAT at 22% CAGR while its stock returns 11% CAGR, because the entry P/E was too high. PAT CAGR is the business’s rate of compounding; shareholder return is PAT CAGR plus any re-rating (or de-rating) of the valuation multiple. The two are correlated over very long windows but they diverge meaningfully over 5–10 year windows.
Trap 6: Survivorship bias in screens. Any stock screen that filters on past 10-year PAT CAGR is by construction biased toward survivors. Companies that have delisted, defaulted or quietly disappeared during the decade don’t show up. Always remember that the universe you are sampling from is the lucky survivors, not the full original cohort.
Key Takeaways
1. 10-Year PAT CAGR is the single most concentrated way to express a decade of bottom-line compounding — but it is a starting point, not a verdict. Always pair it with revenue CAGR, CFO/PAT, and equity dilution to know whether the rate is earned cleanly.
2. The Indian long-term context — roughly 11% Nifty earnings CAGR, 13–17% for quality large-cap compounders — gives you the right yardsticks. Anything materially above this range deserves intense scrutiny of the drivers behind the growth.
3. Titan Biotech FY25 audited disclosures illustrate what a clean operating-leverage-led compounder profile looks like in the Indian small-cap landscape: 15% revenue CAGR colliding with ~29% PAT CAGR, supported by debt of just ₹3 crore, CFO/Operating Profit of ~103%, exports at ~34.5% of revenue, and 14 board meetings under an independent chair. The PAT compounding is operationally driven, fully cash-backed, and supported by engaged governance — not financial engineering.
4. Use 10-Year PAT CAGR as a screening filter, never a decision filter. After it passes the filter, read the annual report. The story behind the rate matters more than the rate itself, and the auditor’s report, related-party schedule, contingent-liability footnote and cash-flow statement are where that story lives.
SEBI Disclaimer
Disclaimer: This article is for educational and informational purposes only. It is not investment advice, and not a buy, sell, or hold recommendation on any stock mentioned, including Titan Biotech Limited. Equity markets carry risk; please do your own research or consult a qualified professional before making investment decisions.
