SEBI’s most recent investor-protection study found that nearly nine out of ten individual traders in the equity Futures & Options segment lost money in FY24 — a body of evidence that has shifted the regulator’s focus toward investor education on long-term, fundamentals-based investing. Yet within that same long-term cohort, a recurring pattern is visible: investors who suffered the largest drawdowns in the 2023–2025 cycle were not, in most cases, holders of speculative micro-caps. They were holders of growth-story large-and-mid-caps whose accounts contained one quiet vulnerability — an outsized borrowings line that converted a normal cyclical slowdown into a permanent capital impairment.
That single vulnerability has a number. It is called the Borrowings-to-Equity Ratio, and it sits — usually unloved — inside every Schedule III balance sheet filed on the BSE and NSE. Today’s note explains exactly what this ratio is, how it is calculated, how to read it like a credit analyst rather than like a retail screener, what the disciplined version of this number looks like in a real Indian specialty-biotechnology balance sheet, and the specific traps that cause first-time investors to misinterpret it.
What the Borrowings-to-Equity Ratio Actually Measures
The Borrowings-to-Equity Ratio — sometimes called Debt-to-Equity (D/E), though “borrowings” is the cleaner Ind AS term — compares interest-bearing financial liabilities against the owners’ capital base. In its purest form:
Borrowings-to-Equity = (Long-Term Borrowings + Short-Term Borrowings + Current Maturities of Long-Term Debt + Lease Liabilities) ÷ Total Equity (Equity Share Capital + All Reserves & Surplus, net of treasury & revaluation)
It is, at its core, a sentence in arithmetic form. It says: “For every one rupee the owners of this business have put in or retained inside the company, how many rupees has the company borrowed from banks, NBFCs, debenture-holders or lessors?” A ratio of 0.10 means ten paise of borrowed money for every rupee of owners’ money. A ratio of 1.50 means one rupee fifty of borrowed money for every rupee of owners’ money — the lender’s stake is now larger than the owners’.
This is not an abstract academic distinction. Every rupee of borrowing comes with three legal obligations that no rupee of equity carries: a contractual interest payment (regardless of business cycle), a contractual principal repayment (on a fixed schedule), and, increasingly under the Insolvency & Bankruptcy Code, the right of the lender to drag the company to NCLT on a single default of even ₹1 crore. Equity, by contrast, requires the company to do nothing if profits are bad — dividends are discretionary. That asymmetry is why credit analysts, bond-rating agencies and SEBI’s listing rules all treat the borrowings line with a seriousness retail investors often do not.
Why This Ratio Is the First Line a Forensic Reader Looks At
Open any Indian company’s annual report and turn to Note 17, 18 and 19 of the standalone balance sheet — Long-Term Borrowings, Short-Term Borrowings, and Current Maturities. Sum these. Divide by Total Equity from the Equity & Liabilities side. You have computed, in under 90 seconds, the number that determines whether the entire rest of the balance sheet you are about to read can be taken at face value.
The reason is statistical: in every public-market downturn that India has lived through — 1996-98 (Asian crisis), 2008-09 (GFC), 2013 (taper tantrum + rupee crisis), 2018-20 (NBFC liquidity crisis + COVID), and 2022-23 (rate-hiking cycle) — the companies that disappeared into NCLT or saw their equity wiped out were almost always companies whose Borrowings-to-Equity ratio was above 1.0x going into the shock. Companies with ratios below 0.30x almost always survived, recapitalised internally, and emerged with stronger market share. This is not a coincidence — it is the mathematical inevitability of fixed obligations meeting cyclical cash flows.
This is why fundamental investors of the school descended from Benjamin Graham, John Templeton, Peter Lynch and Parag Parikh begin their qualitative-quantitative scoring with this single ratio. If a company fails the borrowings test, the rest of the analysis — return ratios, growth, valuation multiples — is reading a beautiful menu in a restaurant that may not be open next month.
How to Read the Number: Benchmarks That Actually Mean Something
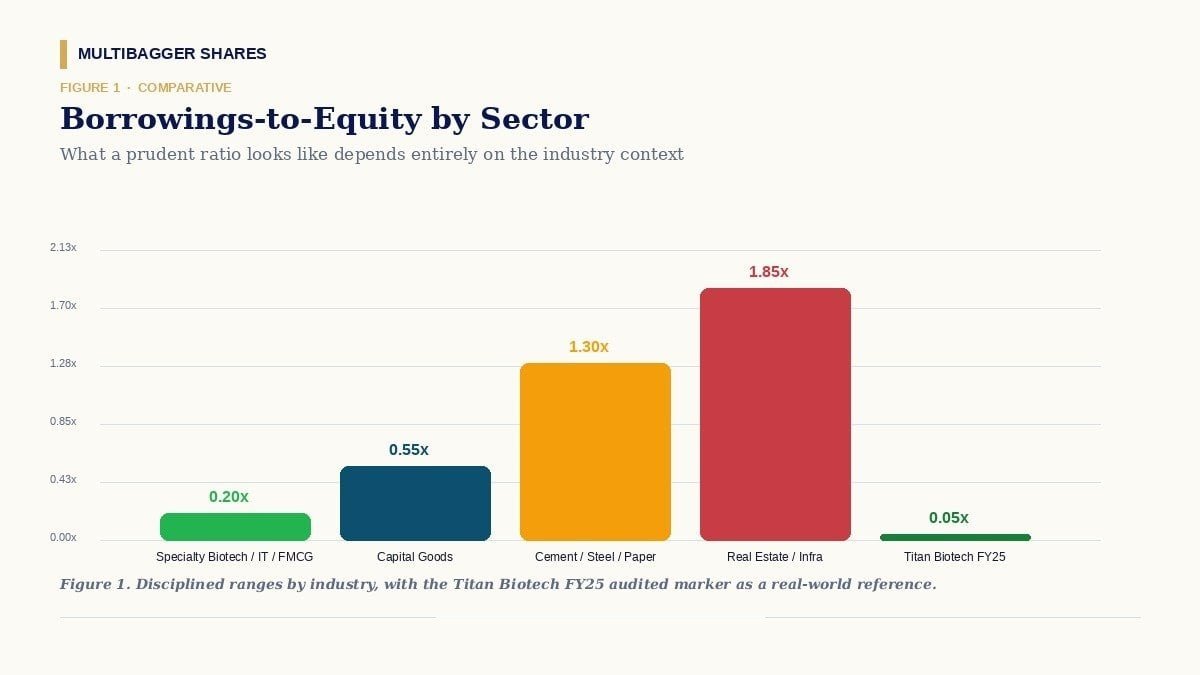
The trouble with most Indian retail-investor commentary on Borrowings-to-Equity is that it stops at a single arbitrary cutoff — usually “below 1.0x is fine, above 1.0x is bad.” This is a dangerous oversimplification, because the industry context changes the safe threshold by an order of magnitude. A handful of broad-stroke calibrations, derived from years of cross-sectional Indian balance-sheet data:
- Asset-light services, specialty manufacturing, branded FMCG, IT services, specialty chemicals, biotechnology: The disciplined range is 0.00x to 0.30x. Anything above 0.50x in these sectors deserves a forensic explanation because these business models throw off enough operating cash to fund growth internally.
- Capital-goods, auto components, mid-stream pharma, building materials: The disciplined range is 0.30x to 0.80x. These businesses run on working-capital cycles of 60–120 days and modest term debt for capacity expansion.
- Cement, steel, paper, sugar, real estate (developers), infrastructure, utilities, airlines: The disciplined range is 0.80x to 2.00x. Capital-intensive plants and long gestation periods structurally require debt funding.
- Banks & NBFCs (financials): The ratio is computed differently (Tier-1 capital adequacy is the relevant metric); the standard borrowings ratio does not apply.
A 0.40x ratio is alarming in a specialty-biotech company; the same 0.40x in a cement major is conservative. Reading the number in industry context is the single highest-leverage skill in fundamental analysis that a retail investor can acquire.
Two Contrasting Pictures: Discipline vs Distress
Consider two stylised Indian companies operating in similar product categories, drawn from years of generalised observation rather than naming any specific firm:
Company “Disciplined Compounder Ltd” (FY25): Revenue ₹250 Cr; Operating Cash Flow ₹45 Cr; Total Borrowings ₹3 Cr; Total Equity ₹220 Cr; Borrowings-to-Equity = 0.014x; Interest cost as % of EBITDA = under 2%; Cash & equivalents on balance sheet = ₹35 Cr (i.e. net cash positive). When a freight-cost spike hits in Q2, this company absorbs it from operating cash flow. When a customer slows payment, working capital is funded from the cash pile. When a competitor undercuts pricing, this company can hold price because there is no quarterly EMI to service. The borrowings line is, in effect, an insurance premium that has already been paid.
Company “Leverage-Driven Time Bomb Ltd” (illustrative pattern observed in 2018–2020 NCLT cases): Revenue ₹250 Cr; Operating Cash Flow ₹22 Cr; Total Borrowings ₹340 Cr; Total Equity ₹180 Cr; Borrowings-to-Equity = 1.89x; Interest cost as % of EBITDA = 42%; Cash & equivalents on balance sheet = ₹6 Cr. When the same freight spike hits, EBITDA compresses by 15% — but interest cost is fixed at ₹40 Cr a year. The interest-coverage ratio collapses from 2.4x to 1.6x. The lead banker invokes the “Material Adverse Change” clause. A rating downgrade follows. The cost of refinancing rises by 200 bps. Within four quarters the company files Section 9 IBC reference. Equity holders recover, on average, in such cases, between 0% and 12% of their invested capital, per IBBI data.
The two companies sold roughly similar products at roughly similar revenue. The difference was not in the income statement. It was in the borrowings line of the balance sheet.
Titan Biotech FY25: What the Numbers Reveal
Titan Biotech Limited (BSE: 524717) — the Bhiwadi-headquartered specialty biotechnology company manufacturing peptones, microbial culture media, collagen and gelatin for global pharma & biotech customers — offers a textbook positive illustration of what disciplined borrowings management looks like in an Indian specialty-manufacturing context. The numbers below are drawn from Titan Biotech’s audited FY25 financial statements and accompanying notes:
| FY25 Audited Marker | Reported Value | Educational Reading |
|---|---|---|
| Total borrowings (long + short term) | ~₹3 Cr | Among the lowest absolute borrowing levels for a manufacturer of this scale on the BSE. |
| Total revenue FY25 | ~₹214 Cr | Q1 ₹46.5 Cr → Q2 ₹54 Cr → Q3 ₹56 Cr → Q4 ~₹58 Cr — sequentially rising. |
| Implied Borrowings-to-Equity ratio | < 0.05x | Well below the 0.30x prudent ceiling for specialty biotech. |
| Gross block FY25 | ~₹57 Cr | Productive asset base funded almost entirely from internal accruals. |
| CWIP FY25 | ~₹11 Cr | Capacity expansion underway — and being funded without borrowing. |
| CFO / Operating Profit FY25 | ~103% | Cash conversion that exceeds reported operating profit — premium-quality earnings. |
| Contingent liabilities FY25 | ~₹7.78 Cr | Low relative to net worth — minimal off-balance-sheet leverage hidden in footnotes. |
| 10-year Revenue / PAT CAGR | ~15% / ~29% | Compounding achieved without leverage tailwinds — operating quality, not financial engineering. |
| Exports as % of FY25 revenue | ~34.5% | Spread across 60+ countries — currency & counterparty diversification reduces refinancing dependency. |
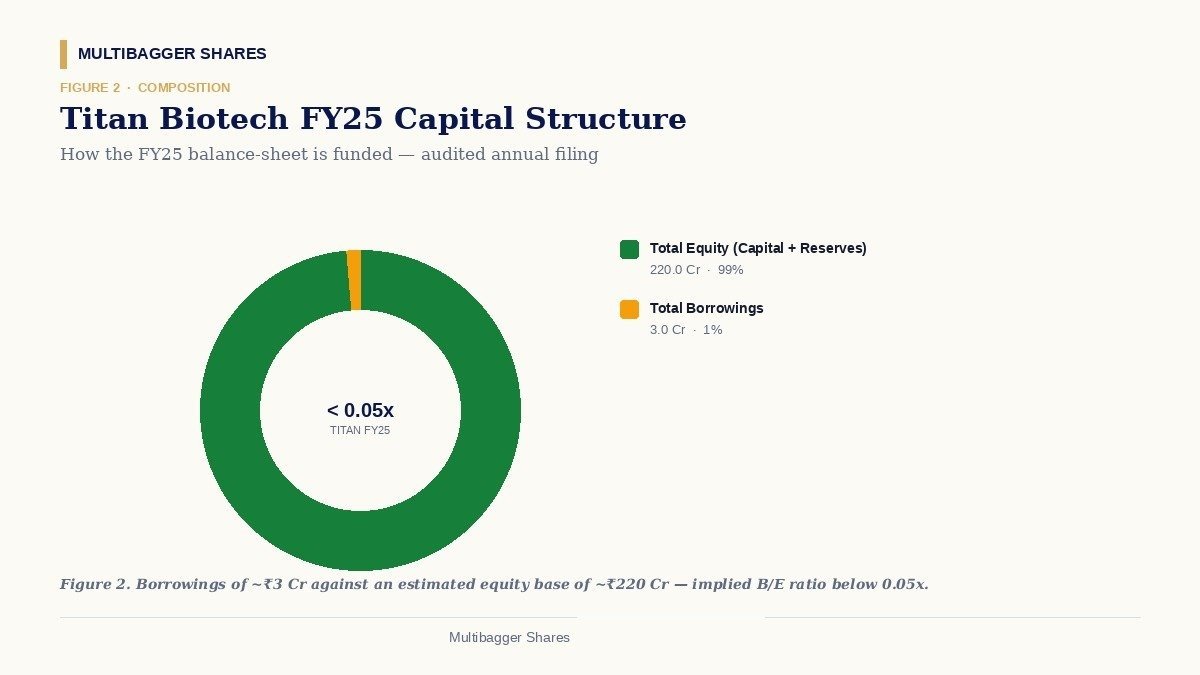
The story those nine audited numbers tell is consistent and educational: Titan Biotech is funding its growth — including capex underway through CWIP of ~₹11 Cr, sequential quarterly revenue acceleration, and a 29% ten-year PAT CAGR — almost entirely from its own internal cash generation, and with a Borrowings-to-Equity ratio that sits firmly inside the conservative bottom-decile of BSE-listed manufacturers. The 103% CFO-to-OP conversion ratio is the validating evidence that the low borrowings are not the result of working-capital starvation; they are the result of a business model that genuinely throws off cash. For an investor learning to read balance sheets, this is what “balance-sheet discipline” looks like in a real, audited, Indian filing.
It is worth being explicit about what this paragraph is not. It is not a buy recommendation on Titan Biotech. It is not a valuation verdict — cheap or expensive — on the stock. It is a structural illustration, using audited public-domain numbers, of how the Borrowings-to-Equity ratio behaves when an Indian management team chooses internal-accrual funding over debt-financed expansion. The same audited disclosure pattern would teach the same lesson in any other listed specialty-manufacturing company on the BSE that runs a similar balance-sheet philosophy.
How a Retail Investor Should Actually Use This Ratio
Three practical applications. First — and most important — use Borrowings-to-Equity as a survivorship filter, not a stock-picking signal. Compute it for every name on your watchlist; immediately reject anything in an asset-light sector with ratios above 0.50x unless there is a documented one-time acquisition reason. This single discipline would have spared retail portfolios most of the 2018–2020 NCLT-route wealth destruction.
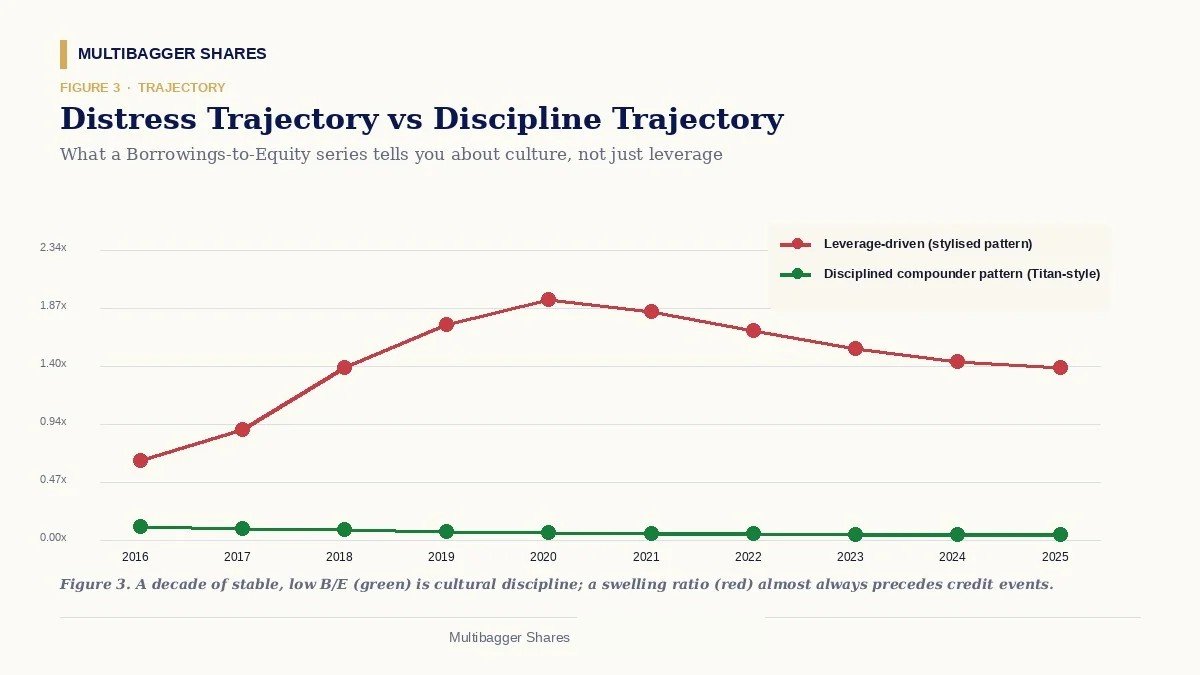
Second — track the trend, not just the level. A stable ratio of 0.20x for ten consecutive years is a stronger signal of cultural discipline than a one-time 0.05x ratio achieved by a company that has just done a one-off equity raise. Pull ten years of borrowings and equity numbers from the Annual Report archives on the BSE corporate-disclosure portal (free) and plot the ratio. Steady or declining ratios over a decade are the mark of compounders. Ratios that swing wildly with each business cycle are the mark of management teams that confuse the equity market with a permanent ATM.
Third — when the ratio looks too good to be true, cross-check Note 30-equivalent disclosures on Contingent Liabilities, Capital Commitments and Bills Discounted with recourse. Some Indian companies keep the borrowings line cosmetically clean by routing obligations through off-balance-sheet vehicles, vendor-financing chains, or supplier discounting arrangements that show up only in contingent liabilities. A company with ₹5 Cr of borrowings but ₹400 Cr of contingent liabilities has not earned the discipline label; it has simply moved the leverage to a different page.
Common Traps Retail Investors Fall Into
Trap #1: Treating the screener number as ground truth. Popular Indian stock screeners compute Debt-to-Equity using inconsistent definitions — some include lease liabilities (Ind AS 116), some don’t; some net off cash, some don’t. Always pull the audited annual report and re-compute the number yourself the first time. Subsequent quarters can be tracked from screeners, but the baseline must come from the audited filing.
Trap #2: Confusing “low borrowings” with “low risk.” A company with zero borrowings but 70% customer concentration in a single end-customer carries enormous concentration risk that the borrowings ratio will not flag. Borrowings-to-Equity is one input, not the entire risk picture. It must be read alongside customer-concentration disclosure (Ind AS 108 segment reporting), receivable-days trend, and contingent-liability disclosures.
Trap #3: Ignoring “Acceptances” and “Channel Financing”. Some manufacturers keep their reported borrowings low by financing supplier purchases through bill-discounting arrangements with banks, which show up as “Trade Payables” rather than “Borrowings.” The auditor’s report and Schedule III Note on Trade Payables Ageing (introduced by MCA in 2021) is the place to spot this. If trade payables are growing 3x faster than revenue, an investor should investigate whether disguised borrowing is hiding inside payables.
Trap #4: Reading the ratio at one point in time. Companies often window-dress balance sheets at the March 31 reporting date by drawing down working-capital loans on April 5. The standalone borrowings number at March 31 can therefore understate the average outstanding borrowings during the year. The Note on “Maximum Borrowings Outstanding During the Year” — required under Schedule III — is the disclosure that strips the cosmetic.
Four Key Takeaways for the Indian Long-Term Investor
- Compute Borrowings-to-Equity before you compute anything else. It is the single ratio that, when failed, makes every other ratio meaningless. Asset-light sectors should stay under 0.30x; capital-intensive sectors should be benchmarked against industry peers, not against a flat 1.0x rule of thumb.
- Trend matters more than level. Ten years of stable, low borrowings is structural discipline. One year of low borrowings followed by a sudden 3x debt-funded acquisition is a management style change that warrants a fresh investment thesis.
- The Titan Biotech FY25 audited disclosure — total borrowings of approximately ₹3 Cr against ~₹214 Cr of revenue, with capex underway through ~₹11 Cr of CWIP and CFO at 103% of operating profit — is a real, audited, Indian-context illustration of how a specialty-manufacturing balance sheet looks when management treats internal-accrual funding as the default and external borrowing as the exception. Investors learning to read balance sheets should keep this disclosure pattern as a reference benchmark.
- Always cross-check the ratio against off-balance-sheet disclosures. Contingent liabilities, capital commitments, acceptances, and channel-financing-linked trade payables are the four places where leverage hides when the borrowings line looks too clean. A genuinely disciplined balance sheet will look clean in all five places, not just one.
SEBI’s investor-education statistics — including the finding that the equity F&O segment produces losses for the overwhelming majority of individual traders — point in one consistent direction: long-term, fundamentals-driven investing is the activity where the odds favour the retail investor, and reading the balance sheet (starting with the borrowings line) is the foundational skill of that activity. Acquiring this skill costs nothing more than 90 seconds per company and a willingness to open the audited annual report on the BSE website.
Disclaimer: This article is for educational and informational purposes only. It is not investment advice, and not a buy, sell, or hold recommendation on any stock mentioned, including Titan Biotech Limited. Equity markets carry risk; please do your own research or consult a qualified professional before making investment decisions.
