India’s registered investor base has exploded from roughly 3 crore to more than 11 crore unique investors on the NSE in just a few years — and almost every one of those new investors learned the same first valuation lesson: the P/E ratio. Far fewer were ever told that the “E” in that ratio is an accounting opinion, not a bank deposit. SEBI’s own landmark study found that 9 out of 10 individual traders in the equity F&O segment lose money chasing numbers they never verified. Today’s lesson is about the multiple that runs the verification for you: the Price-to-Operating-Cash-Flow (P/CFO) ratio — the valuation lens that refuses to trust a profit until the cash actually arrives.
Every valuation multiple is a fraction. The numerator — price — is set by the market every second and is always honest about what you are being asked to pay. The denominator is where the trouble lives. Earnings can be shaped by accrual estimates, depreciation schedules, one-off “other income”, and revenue recognised long before a single rupee is collected. Operating cash flow, by contrast, is reconciled against actual bank movements and audited under Ind AS 7, the accounting standard that governs the cash flow statement of every listed Indian company. That difference in the denominator is the entire reason the P/CFO ratio exists.
What Is the Price-to-Operating-Cash-Flow Ratio?
The Price-to-Operating-Cash-Flow ratio answers one question in plain English: how many rupees am I paying today for every rupee of cash the underlying business actually generated from its operations last year? Where the P/E ratio prices a company’s reported profit, P/CFO prices the cash that operations deposited into the company’s bank accounts — after the working-capital reality of collecting from customers, paying suppliers, and carrying inventory has been settled.
The number it uses is Cash Flow from Operations (CFO) — the first of the three sections of the cash flow statement, sitting above investing and financing flows. CFO starts from profit, adds back non-cash charges like depreciation, and then subtracts the cash absorbed by receivables, inventory and other working-capital lines. It is the single hardest headline number in the annual report to dress up, because every claimed rupee must reconcile to actual cash movement that the statutory auditor verifies. Profit is a verdict reached in the boardroom; CFO is a fact recorded by the bank.
This is why seasoned analysts treat P/CFO as the cross-examination of the P/E ratio. When the two multiples tell the same story, the earnings are probably real. When P/E looks invitingly cheap but P/CFO looks expensive, the gap itself is the finding: reported profit is running far ahead of collected cash, and the “cheapness” may be an accounting illusion.
The Formula — and How to Read It
(equivalently: Share Price ÷ CFO per Share)
Both inputs are public. Market capitalisation is on every exchange page; CFO is printed in the consolidated cash flow statement of the annual report — and most Indian screening platforms surface it as a single line. A ratio of 20× means you are paying ₹20 for every ₹1 of last year’s operating cash; a ratio of 10× means ₹10. Lower numbers buy more audited cash flow per rupee invested, but the number alone is never a verdict — a slow-growth utility at 8× and a fast-compounding specialty business at 22× can both be rationally priced. The multiple is the start of the interrogation, not its conclusion.
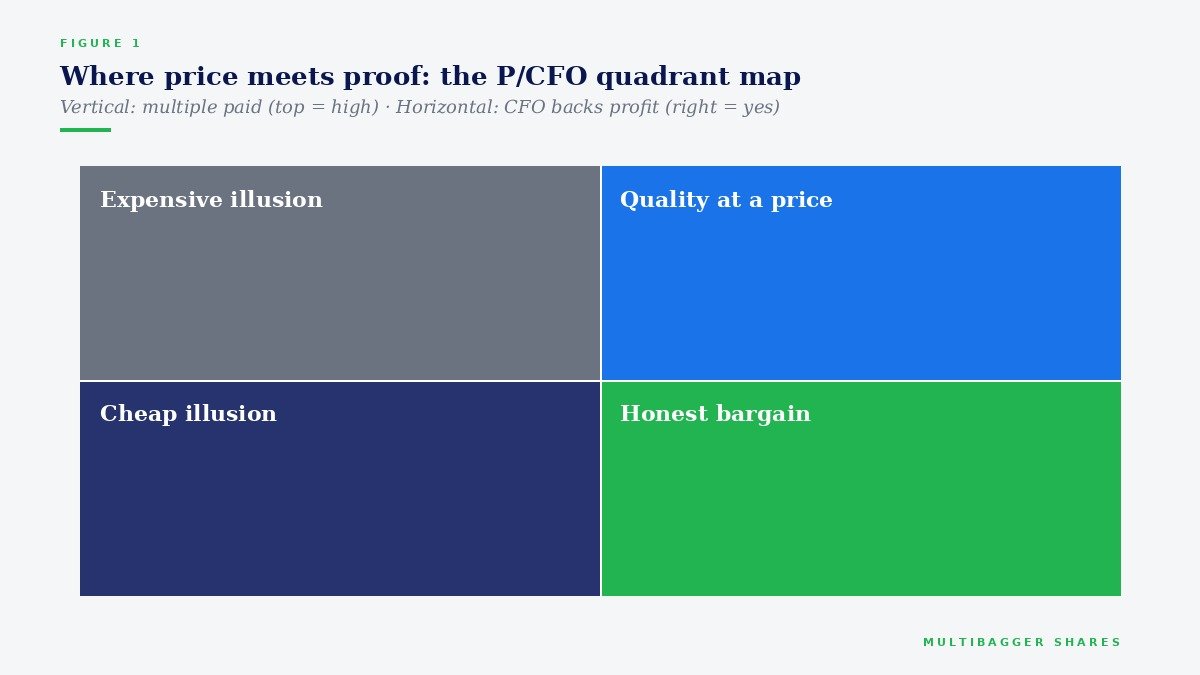
Two reading disciplines make the ratio far more powerful. First, use an average of the last three years of CFO rather than a single year, because working-capital swings can flatter or punish any one financial year. Second, always read P/CFO beside the P/E ratio and beside the CFO-to-PAT ratio. The triangle of those three numbers tells you whether profits are cash-backed, and whether the price respects that fact. The quadrant map below is the mental model: the multiple you pay on one axis, the cash-backing of profit on the other.
Two Companies, One Profit Line — and Two Very Different Truths
Consider two hypothetical companies, each reporting exactly ₹100 crore of profit after tax, each trading at a market capitalisation of ₹2,400 crore — an identical P/E of 24×. On the profit-and-loss statement they are twins. Company A is a consumer-products business that collects from distributors within days; its cash flow statement shows ₹103 crore of CFO. Its P/CFO works out to roughly 23× — almost identical to its P/E. The two lenses agree, which is precisely what honest accounting looks like: profit flowing through to the bank account with nothing lost in translation.
Company B is an infrastructure contractor of the type that littered Indian markets in the early 2010s. It books revenue on percentage-of-completion, its receivables grow faster than its sales, and retention money sits with government clients for years. Its cash flow statement shows just ₹38 crore of CFO against the same ₹100 crore of reported profit. Its P/CFO is roughly 63× — nearly three times its P/E. An investor screening on P/E alone sees a business at 24×; the cash lens reveals that the market is actually charging 63 years of demonstrated cash generation. History’s verdict on this archetype is unkind: from the global cautionary tale of Enron in 2001 to a generation of leveraged Indian infrastructure names that slid into the NCLT, the pattern was visible years in advance in exactly this divergence — profits the P&L insisted were real, and cash flow statements that kept disagreeing. This is not a comment on any listed company today; it is the timeless anatomy of the trap.
| Lens | Company A (disciplined) | Company B (red-flag archetype) |
|---|---|---|
| Reported PAT | ₹100 Cr | ₹100 Cr |
| Cash Flow from Operations | ₹103 Cr | ₹38 Cr |
| P/E ratio | 24× | 24× |
| P/CFO ratio | ≈ 23× — lenses agree | ≈ 63× — illusion exposed |
Titan Biotech FY25: What the Numbers Reveal
To see what a trustworthy cash-flow denominator looks like in a real audited filing, consider Titan Biotech Limited (BSE: 524717), a Bhiwadi, Rajasthan–based specialty biotechnology company that manufactures peptones, microbial culture media, collagen and gelatin for pharmaceutical and biotech customers in more than 60 countries. We use its FY25 audited numbers here purely as an educational illustration of what disciplined fundamentals look like — this is not a buy/sell recommendation, and we deliberately compute no market multiple on it in this article.
| FY25 audited marker (Titan Biotech Limited) | Value | Why it matters to a cash-flow multiple |
|---|---|---|
| Total revenue (4-quarter sum) | ~₹214 Cr | The operating base generating the cash |
| Quarterly revenue arc | ₹46.5 → ₹54 → ₹56 → ~₹58 Cr | Sequential build, not a one-quarter spike |
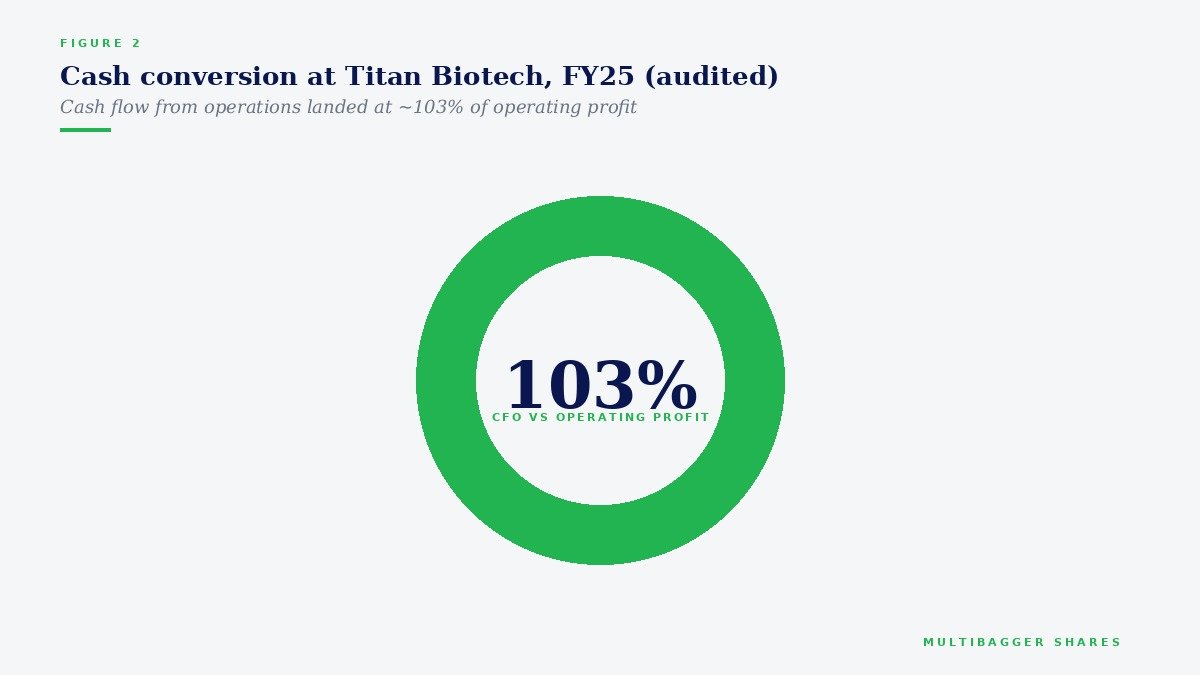
| CFO as % of operating profit | 103% | Cash collection slightly exceeded operating profit — the premium marker of earnings quality |
| EBITDA margin band | ~18–22% | Profitability that the cash line corroborates |
| Total borrowings | ₹3 Cr | Essentially debt-free; CFO is not pledged to lenders |
| Debt-to-equity | < 0.05× | Cash flows accrue to shareholders, not creditors |
| Contingent liabilities | ₹7.78 Cr | No hidden claim queue waiting to divert future cash |
| Export share of revenue | ~34.5% (60+ countries) | Diversified receivable base lowers collection risk |
| 10-year revenue / PAT CAGR | ~15% / ~29% | A long compounding runway behind the cash engine |
Read those markers as one connected story. The single number that matters most to today’s lesson is the 103% — in FY25, Titan Biotech’s cash flow from operations slightly exceeded its operating profit. Every rupee the P&L claimed as operating profit arrived in the bank, plus a small bonus from working-capital discipline. For an analyst, that means the denominator of any cash-flow multiple computed on this company is not an estimate to be argued with but a fact to be built upon. Contrast this with Company B above, where only 38 paise of each profit rupee ever became cash, and you understand why the same valuation arithmetic is meaningful for one business and meaningless for another.
The surrounding markers reinforce the same discipline. With borrowings of just ₹3 crore against a ₹214 crore revenue base, operating cash is not mortgaged to interest schedules. Contingent liabilities of ₹7.78 crore mean no off-balance-sheet queue is waiting to intercept tomorrow’s cash. And the ten-year arc — revenue compounding at roughly 15% and PAT at roughly 29% — shows a business whose growth has been funded by its own collections rather than by serial borrowing or dilution. That is the audited FY25 picture of what management discipline looks like when it reaches the cash flow statement; whether any price for it is attractive is a question this educational article deliberately leaves alone.
How Retail Investors Should Actually Use P/CFO
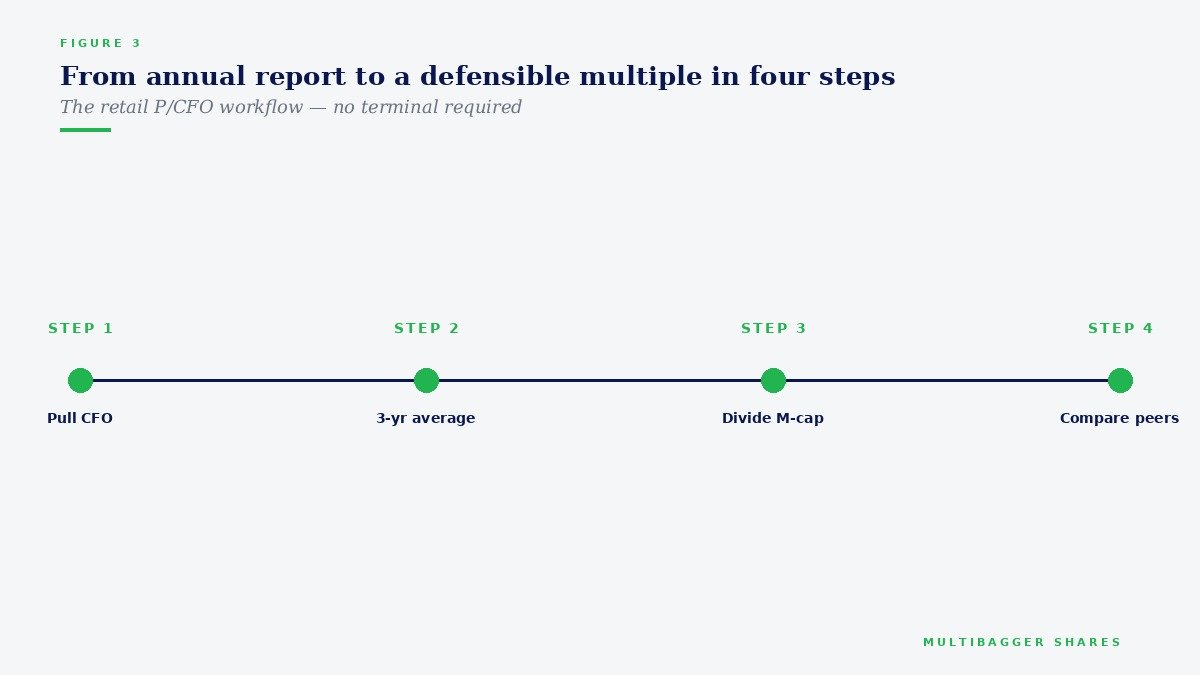
You do not need a Bloomberg terminal for any of this. The workflow takes minutes per company. Step one: open the annual report and pull Cash Flow from Operations from the consolidated cash flow statement — or read it straight off any free Indian screening platform. Step two: average the last three financial years of CFO to smooth working-capital noise. Step three: divide the current market capitalisation by that average to get the multiple. Step four: compare — against the company’s own five-year P/CFO history, against three or four listed peers in the same industry, and against the P/E ratio side by side. A company whose P/CFO sits near its P/E has cash-backed earnings; a company whose P/CFO towers over its P/E is asking you to take its accounting on faith.
Used this way, P/CFO becomes a screening sieve rather than a buy signal. It will quietly remove from your shortlist the companies whose profits exist mainly in their receivables, and it will flag for deeper work the businesses where price and demonstrated cash generation have drifted far apart in either direction. In a market where SEBI’s investor-protection studies keep demonstrating how expensive unverified conviction can be, a sieve that costs nothing and runs on audited numbers is one of the highest-return habits a long-term investor can build.
Common Traps and Misinterpretations
Trap one — using it on lenders. For banks and NBFCs, lending is the operating business, so CFO mechanically swings with loan-book growth and the ratio is meaningless; use price-to-book and return-on-assets frameworks instead. Trap two — trusting a single spectacular year. One year of bumper CFO can come from stretching supplier payments, collecting customer advances, or simply running inventory down; that is why the three-year average is non-negotiable. Trap three — forgetting capex. CFO is measured before capital expenditure, so an asset-heavy business can post a handsome CFO and still consume every rupee of it in maintenance capex; pair P/CFO with free-cash-flow thinking before drawing comfort. Trap four — comparing across sectors. A commodity cyclical at the top of its cycle will always look “cheaper” on P/CFO than a specialty business mid-investment; the ratio only ranks like-for-like. Trap five — outsourcing the verdict. SEBI’s finfluencer regulations exist precisely because shortcut verdicts sell better than verification; no single multiple — this one included — is a recommendation engine. P/CFO tells you what you are paying for audited cash generation. What that is worth is a judgment only you, or a registered professional bound to your interest, can make.
Key Takeaways
- P/CFO prices facts, not opinions. Market capitalisation divided by Cash Flow from Operations tells you how many rupees you are paying per rupee of audited operating cash — a denominator far harder to dress up than reported earnings.
- The gap is the signal. When P/CFO and P/E agree, earnings are cash-backed; when P/CFO towers above a seductively low P/E, reported profit is running ahead of collected cash — the classic anatomy of a value trap.
- Titan Biotech’s FY25 audited accounts show what a trustworthy denominator looks like: cash flow from operations at 103% of operating profit, borrowings of just ₹3 crore on a ~₹214 crore revenue base — profit that fully arrived in the bank, unencumbered by lenders.
- Use a three-year average and never use it alone. Smooth working-capital noise, skip banks and NBFCs, pair the ratio with P/E and free-cash-flow thinking, and treat every multiple as the start of your homework — never the verdict.
Disclaimer: This article is for educational and informational purposes only. It is not investment advice, and not a buy, sell, or hold recommendation on any stock mentioned, including Titan Biotech Limited. Equity markets carry risk; please do your own research or consult a qualified professional before making investment decisions.
