April 10, 2026
(Friday)
Why Pharma Is the Most Misunderstood Sector in Indian Value Investing
If you walk into any investor meet in Mumbai and ask ten participants what they think of the Indian pharma sector, you will hear ten completely different answers. Some will tell you pharma is a defensive, recession-proof compounding machine. Others will warn you that one USFDA import alert can wipe out half a company’s market cap overnight. Still others will point to specialty chemicals and say pharma is “old money” that will never again deliver multibaggers like it did in the 2000s.
All three groups are partly right — and all three are mostly wrong. The truth is that Indian pharmaceuticals is neither a monolith nor a random casino. It is a layered ecosystem of very different business models — API manufacturers, generic formulators, domestic branded players, CDMOs (Contract Development & Manufacturing Organisations), biosimilar developers, innovator research companies, and biotech outliers — each operating under different economic rules, different regulatory regimes, and different capital cycles. Treating them the same way is the #1 reason retail investors lose money in this space.
Today, with the BSE SENSEX up 851.61 points at 77,483.26 (+1.11%) and NIFTY 50 up 240.65 points at 24,015.75 (+1.01%) on strong banking and pharma rotation, pharma stocks are once again in focus. Before you add a single rupee to this sector, you need a disciplined framework — not tips, not momentum, not stories. This guide walks you through the complete 8-factor pharma analysis checklist that separates genuine multibaggers from regulatory time bombs.
The 8-Factor Pharma Sector Analysis Framework
Factor 1: Business Model Classification — Know Exactly What You Are Buying
Every pharma investment must start with one simple question: what does this company actually sell, and to whom? Indian pharma companies broadly fall into seven distinct business models, and each has its own risk-reward profile:
(a) API / Bulk Drug Manufacturers — Companies that produce Active Pharmaceutical Ingredients sold B2B to formulators globally. These are chemistry-heavy, capex-intensive businesses where scale, process yield, and backward integration drive margins. Examples include Divi’s Laboratories, Aarti Drugs, and Laurus Labs in its API division.
(b) Generic Formulators (Export-Led) — Companies that manufacture finished generic dosage forms primarily for regulated markets like the US, EU, and UK. Think Sun Pharma’s US generics business, Dr. Reddy’s, Lupin, Aurobindo. Their fortunes ride on ANDA approvals, pricing pressure in the US, and USFDA inspection outcomes.
(c) Domestic Branded Generics — Companies that sell branded generic medicines through India’s massive chemist network. This is perhaps the most underrated segment because it enjoys pricing power, low pricing pressure, and the stickiness of doctor prescription habits. Mankind Pharma, Alkem Laboratories, Torrent Pharma, and Cipla’s domestic business fall here.
(d) CDMO / CRAMS Players — Contract Development and Manufacturing Organisations that work for global innovator pharma companies on a fee-for-service basis. Syngene, Divi’s CDMO, and Piramal Pharma are examples. These businesses have annuity-like revenue visibility and are benefiting from the “China+1” supply chain shift.
(e) Specialty / Innovative Research Players — Companies like Biocon (biosimilars), Dr. Reddy’s biosimilar arm, and a few focused small-caps pursuing novel drug delivery. High R&D intensity, long gestation, binary outcomes.
(f) Nutraceuticals & Wellness — Companies straddling pharma and FMCG — Himalaya, Dabur’s healthcare division, Zydus Wellness. Often more FMCG than pharma in business economics.
(g) Biotech Small-Caps — Niche players like Titan Biotech (BSE: 524717) focused on fermentation-based bio-products, gelatin, peptones, and specialty ingredients used as inputs into downstream pharma and nutraceutical manufacturing. These are fundamentally B2B ingredient businesses with chemistry-and-biology-driven moats. Titan Biotech at ₹432 with a market cap of ₹1,783 Cr and ROCE of 16.9% is a live example of how a well-run small-cap biotech can compound quietly for years while the headline pharma giants hog all the attention.
Each of these seven models has a different “normal” operating margin, a different capital intensity, a different regulatory exposure, and — critically — a different appropriate valuation multiple. Confusing an API maker’s valuation yardstick with a domestic branded generic player is how investors systematically overpay or underestimate pharma stocks.
Factor 2: Regulatory Risk Profile — The USFDA Shadow
Nothing in pharma matters more than regulation. The USFDA alone can make or destroy a ₹10,000 crore company in a single inspection. Before investing in any company with US exposure, three data points are non-negotiable:
(i) Number of USFDA-approved facilities — More facilities means lower concentration risk. A company with one US-approved plant is a single point of failure.
(ii) Inspection history — Check the last three inspection outcomes. NAI (No Action Indicated) is ideal, VAI (Voluntary Action Indicated) is manageable, OAI (Official Action Indicated) is a serious warning, and a Warning Letter or Import Alert is catastrophic. These outcomes are all public on the FDA website.
(iii) 483 observations trend — When the FDA inspects a plant, it issues a Form 483 listing observations. A growing number of repeat observations across years signals systemic quality control problems.
For India-focused domestic branded players, the regulatory lens shifts to the CDSCO, DPCO (Drug Price Control Order), and the Essential Medicines List. Companies with a high exposure to scheduled drugs under DPCO face capped pricing — a permanent headwind for margins.
Factor 3: Revenue Quality — Geography, Therapy, and Customer Concentration
A pharma company earning 65% of revenue from the US and 70% of that from three products is structurally fragile. A pharma company earning 40% from India domestic, 25% from emerging markets, 20% from regulated markets, and 15% from CDMO is structurally anti-fragile. Revenue quality in pharma has three dimensions:
Geographic mix: Domestic revenue is the most stable, followed by emerging markets (India, Latin America, Africa), followed by EU/Japan, with the US being the most profitable but also the most volatile. Look at the 5-year trend of geographic split in the annual report.
Therapy mix: Chronic therapies (cardiac, diabetes, neurology, psychiatry) have far better economics than acute therapies (antibiotics, analgesics) because patients stay on chronic medication for decades. Companies with >50% revenue from chronic therapies enjoy structurally better margins and lower churn.
Customer concentration: In export-led generic businesses, check how much of US revenue comes from a single top customer — often a pharmacy benefit manager or wholesaler. Concentrations above 25% with one customer are a red flag.
Titan Biotech is a textbook positive example here — its 34.5% export revenue from 100+ countries means no single geography or customer can materially dent the business. That geographic diversification is what turns a small-cap ingredient maker into a structurally resilient compounder.
Factor 4: R&D Intensity and Product Pipeline
R&D spending in pharma is simultaneously the biggest long-term wealth creator and the biggest short-term earnings drag. The right R&D ratio depends entirely on the business model:
For pure generic formulators, 6–9% of sales is typical and healthy. For specialty / biosimilar players, 10–15% is required. For CDMO businesses, R&D is customer-funded and the company’s own P&L R&D should be minimal. For domestic branded players, R&D is often 2–4% and is spent more on brand-building than molecule discovery.
But the raw R&D number is only half the story. The real analysis is about R&D productivity — how many approvals are actually being generated per crore of spend? Track the ANDA filing rate, first-to-file opportunities, Para-IV certifications, and complex generic filings (inhalation, ophthalmic, injectable, transdermal). A company spending ₹500 crore on R&D and filing six simple oral solid ANDAs is quietly burning capital. A company spending the same amount and filing three complex injectable ANDAs is compounding value invisibly.
Factor 5: Margin Structure and Gross Margin Trends
In pharma, gross margin trends tell you more about the competitive landscape than any press release. Rising gross margins usually mean either backward integration is working, product mix is shifting up the value chain, or a complex molecule has reached exclusivity. Falling gross margins — especially in the US generics business — typically signal pricing pressure, channel consolidation among US pharmacy benefit managers, or commoditization.
Typical gross margin benchmarks to remember: API manufacturers operate at 30–45%, US generic formulators at 50–60%, domestic branded generics at 60–70%, specialty biosimilars at 55–65%, and CDMO players at 35–50%. Companies operating materially below their segment benchmark are either struggling with scale, carrying legacy inefficiencies, or about to face a rerating event.
Factor 6: Balance Sheet Strength — The Hidden Pharma Killer
Many investors forget that pharma is a capital-intensive business. Building a USFDA-compliant plant costs ₹500–1,500 crore. Building a bio-similar facility can cost ₹2,000 crore or more. Many Indian pharma companies have been financially crippled by aggressive acquisitions that looked strategic on paper but loaded the balance sheet with debt that later suffocated the core business.
The balance sheet checklist for pharma must include: debt-to-equity under 0.5 (ideally under 0.3), interest coverage above 6x, goodwill as a percentage of total equity (high goodwill = acquisition-heavy history, which usually ends badly), and the trend of gross block versus capital work in progress (sudden spikes indicate major capex cycles that may or may not be revenue-productive).
This is why Titan Biotech’s balance sheet is so instructive. Management slashed debt by 70.7% over the recent cycle and moved from net debt to net cash — a ₹53 crore swing that is the hallmark of disciplined, shareholder-friendly capital allocation. That is exactly the kind of balance sheet fortress you want in a small-cap pharma/biotech investment.
Factor 7: Capital Allocation and Management Track Record
Pharma is a business where management decisions compound or destroy value over decades. The fifteen-year history of Indian pharma is full of companies where the founder’s capital allocation skill (or lack of it) determined the entire shareholder outcome. Three questions separate the wealth creators from the wealth destroyers:
Dividend discipline: Does management share profits consistently with shareholders, or does it hoard cash and “strategically reinvest” into low-ROCE projects? Titan Biotech’s 14-year unbroken dividend track record is a masterclass in this discipline.
Acquisition history: Every large Indian pharma acquisition in the last 20 years should be studied. Some worked spectacularly (Sun’s acquisition of Taro). Many destroyed value (numerous US acquisitions by mid-tier Indian companies during 2012–2018). Pattern recognition is everything.
Promoter holding and pledging: In pharma specifically, high promoter holding (above 50%) with zero pledging is strongly correlated with long-term outperformance. Titan Biotech’s promoter stake increased from 48% to 55.87% with zero pledging — a textbook signal of insider conviction.
Factor 8: Valuation — The Right Multiple for the Right Model
Finally, valuation. And this is where most investors make their biggest mistake: applying the same P/E yardstick across all pharma business models. The right approach is model-specific:
For domestic branded generics: Free cash flow yield and EV/EBITDA are the right lenses — these are cash-machine businesses with predictable growth. Quality domestic players like Mankind or Torrent trade at 35–50x earnings, which is justified by their return on capital profiles.
For US generic formulators: P/E is dangerous because earnings are lumpy. Use EV/EBITDA through the cycle and cross-check with price-to-sales against historical band.
For CDMO players: Look at order book visibility, multi-year contracts, and valuations tend to be rich (40–60x earnings) because these are annuity businesses.
For API manufacturers: Cyclicality demands you value them through an entire margin cycle — not at peak margins. Use mid-cycle ROCE and apply a conservative multiple.
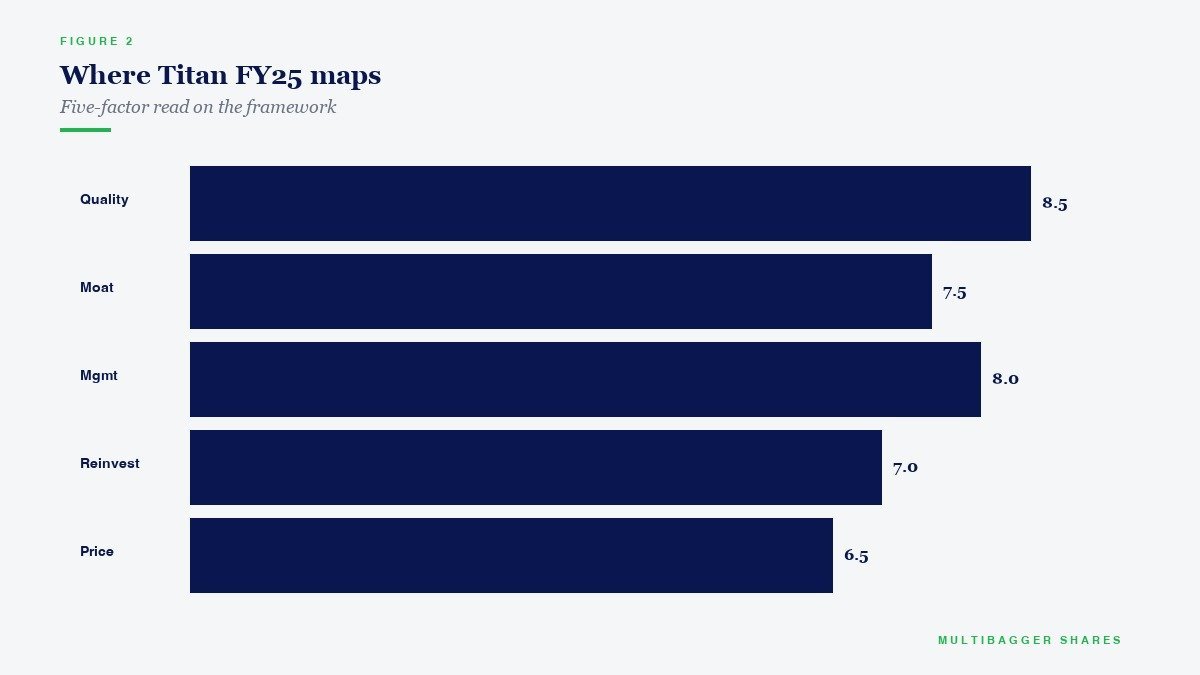
For small-cap biotech ingredient players like Titan Biotech: The framework is different again — earnings compounding (Titan Biotech has grown EPS at 28.6% CAGR over a decade), ROCE of 16.9%, book value growth of 9x in 11 years, and zero pledging are the primary quality markers. With a market cap of only ₹1,783 crore and a price of ₹432, it sits in a segment where disciplined quality investors — not traders chasing momentum — have historically built quiet fortunes.
Why This Framework Matters Today
The Indian pharma sector is entering one of the most interesting phases of its history. The “China+1” supply chain shift is structurally favourable to Indian API and CDMO players. The PLI scheme for bulk drugs is reshoring key intermediates. Domestic consumption of branded generics continues to compound at 10–12% annually driven by demographic and disposable income trends. Biosimilars are opening new export corridors in Europe and emerging markets. And the US generics pricing environment, after years of brutal erosion, is stabilizing.
But none of these macro tailwinds will help you if you don’t know which sub-segment you are investing in. A rising tide does not lift all pharma boats equally. This 8-factor framework is designed to help you identify exactly where in the pharma value chain you are putting your capital — and whether the company you are analyzing is structurally positioned to benefit.
The Concentrated Portfolio Lesson
One final word on portfolio construction. When you apply a rigorous framework like this to the pharma sector, you will almost always end up with a shortlist of just 3–5 companies you truly want to own. That is the right outcome. Do not force yourself to “diversify” by buying 15 pharma stocks just for the sake of exposure.
As Warren Buffett famously said, “Wide diversification is only required when investors do not understand what they are doing.” If you have done the work to deeply understand 5 pharma businesses, concentrate your pharma allocation in those 5 — not in 50 half-understood names. The greatest wealth creators in Indian pharma investing — Rakesh Jhunjhunwala on Lupin, Radhakishan Damani on Sun Pharma, and dozens of quiet portfolio managers who backed Divi’s or Mankind with conviction — made their fortunes through concentration, not diversification. Spreading thin across mediocre names is not risk management; it is the graceful admission that you don’t trust your own research.
Focus on Quality, Not F&O Gambling
While thousands of retail traders are today losing money chasing Bank NIFTY options and weekly expiries, quality value investors are quietly building positions in carefully researched pharma compounders. The contrast could not be starker. A SEBI study covering FY22–FY24 found that 93% of individual traders in equity F&O segment incurred net losses, with aggregate losses exceeding ₹1.8 lakh crore over three years. In FY24-25 alone, individual F&O traders lost ₹1.05 lakh crore — a 41% year-on-year jump in losses. That is not investing. That is wealth destruction at an industrial scale.
Meanwhile, the investor who studied a pharma company like Titan Biotech ten years ago, understood its fermentation-based moat, recognized the quality of its balance sheet, and held on — sat through the market noise and today owns a compounded, multibagger position. That is what value investing looks like in practice. That is what the 8-factor framework in this post is designed to help you replicate, methodically, across the entire Indian pharma landscape.
Your Action Plan
Pick three Indian pharma companies from different sub-segments — say one domestic branded player, one CDMO, one small-cap biotech / ingredient maker. Run each of them through the 8-factor framework in this post. Score each factor from 1 to 5. Tabulate the results. You will immediately see that the companies which score above 30 out of 40 are fundamentally different businesses from those scoring below 25. Over a decade, that numerical gap translates into multi-fold return differences.
This is the discipline that separates investors who build generational wealth from traders who churn their capital into brokerage commissions. Pharma rewards patience, rigor, and business understanding. It punishes laziness and story-chasing. Choose the right side of that equation.
For a complete deep-dive on fundamental analysis, capital allocation, and building a concentrated multibagger portfolio, watch our free video course playlist: Multibagger Value Investing Masterclass on YouTube.
📢 Join Our Telegram Channel
Get daily value investing lessons, stock analysis & Titan Biotech updates — delivered straight to your phone!
✈️ Join @longtermequityy on Telegram
🔔 Free • No spam • Value investing insights daily
Disclaimer: This article is for educational and informational purposes only. It is not investment advice, and not a buy, sell, or hold recommendation on any stock mentioned, including Titan Biotech Limited. Equity markets carry risk; please do your own research or consult a qualified professional before making investment decisions.
