April 08, 2026
(Wednesday)
Why Most Indian Retail Investors Ignore the One Ratio That Could Save Them from Catastrophic Losses
The Indian stock market — with the SENSEX surging past 77,198 and NIFTY at 24,006 today — is brimming with optimism. When markets rise, investors get comfortable. They chase high-growth stories, momentum darlings, and exciting narratives. But buried beneath every rosy profit headline is a question that separates surviving companies from collapsing ones:
“Can this company comfortably pay its interest obligations from operating profits alone?”
That is precisely what the Interest Coverage Ratio (ICR) answers. And if you are not checking this metric before buying any stock — especially in the Indian small-cap and mid-cap universe — you are walking blindfolded into a minefield.
Today, I want to give you a masterclass on this powerful but tragically overlooked ratio. By the end of this article, you will understand exactly how to use ICR to protect your portfolio and identify genuinely strong businesses — the kind that weather recessions, rate hikes, and credit crunches without breaking a sweat.
What Is the Interest Coverage Ratio? The Formula Every Investor Must Memorize
The Interest Coverage Ratio measures how many times a company’s operating profit (EBIT — Earnings Before Interest and Taxes) can cover its interest expense in a given period. The formula is elegantly simple:
Interest Coverage Ratio = EBIT ÷ Interest Expense
For example, if a company earns ₹100 crore in operating profit and pays ₹10 crore in interest, its ICR is 10x. That means operating profits cover interest payments ten times over. This company could see its profits drop by 90% and still meet its debt obligations. That is a fortress.
Conversely, if a company earns ₹100 crore but pays ₹80 crore in interest, its ICR is just 1.25x. One bad quarter — a delayed payment from a client, a raw material price spike, a demand slowdown — and this company cannot service its debt. That is a ticking time bomb.
Why ICR Matters More Than You Think — The Indian Context
India has witnessed a dramatic credit cycle over the past two decades. The IL&FS collapse of 2018, the Yes Bank crisis of 2020, the DHFL disaster, the Café Coffee Day tragedy — all of these had one thing in common: deteriorating Interest Coverage Ratios long before the final blow-up.
According to a Reserve Bank of India Financial Stability Report, nearly 25% of Indian companies listed on exchanges had an ICR below 1.0x during the 2018-2020 period. That means a quarter of listed Indian companies were not earning enough operating profit to even cover their interest payments. They were, in effect, borrowing to pay interest — a death spiral.
For value investors focused on buying quality businesses at reasonable prices, ICR is a first-line defence. It is the financial equivalent of checking whether a building has a foundation before you walk inside.
How to Interpret ICR — The Benchmarks That Matter
Not all ICR numbers are created equal. Here is how I categorize them for Indian stock analysis:
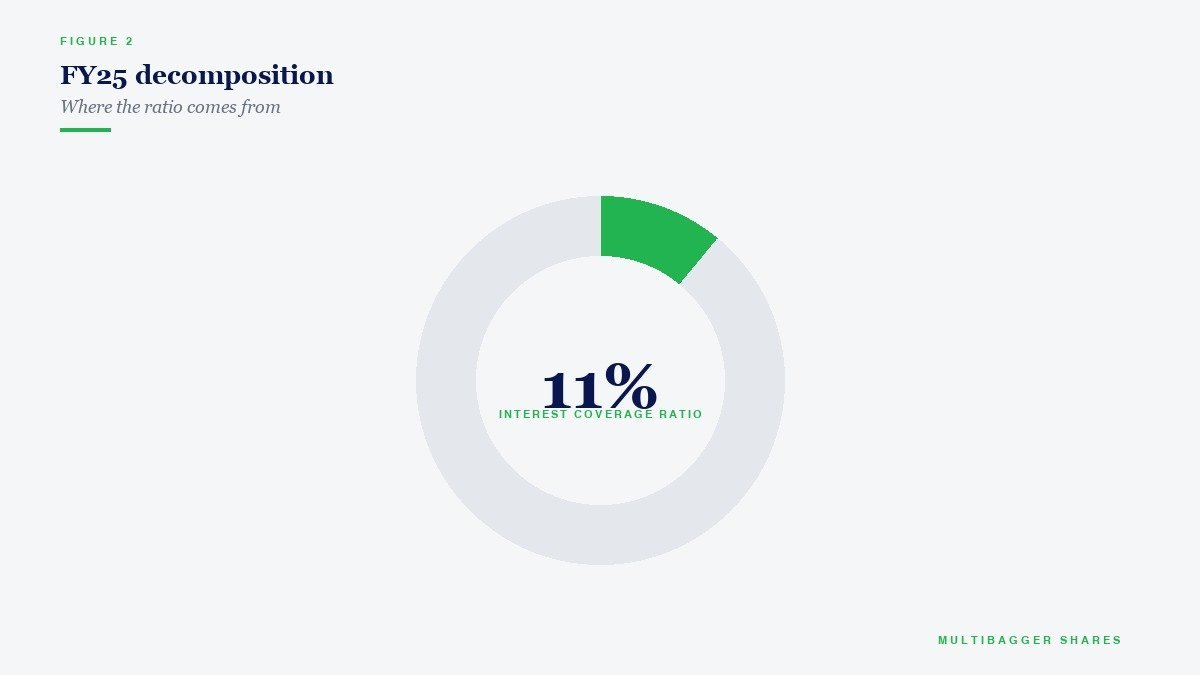
ICR above 10x — Fortress Quality: These companies generate operating profits so far in excess of interest obligations that debt is essentially irrelevant. Think of companies like Titan Biotech (BSE: 524717), currently trading at ₹478 with a market cap of ₹1,976 crore and a debt-to-equity ratio of just 0.02x. When your debt is negligible, your effective Interest Coverage Ratio is astronomical. This is the kind of business quality we look for in our concentrated portfolio approach — companies where debt is simply not a risk factor.
ICR between 5x and 10x — Strong and Comfortable: These companies have significant headroom. Even if earnings drop 50-60%, they can still service their debt. Most well-managed Indian mid-caps with prudent capital allocation fall in this range.
ICR between 2.5x and 5x — Adequate but Watch Closely: Acceptable for capital-intensive industries like infrastructure, real estate, or power generation, where higher debt is structural. However, if the ICR is trending downward over three consecutive years, that is an immediate red flag.
ICR between 1x and 2.5x — Danger Zone: The company is barely covering interest from operations. Any earnings volatility could push it into distress. Unless you are a turnaround specialist with deep domain expertise, avoid these stocks.
ICR below 1x — Critical Failure: The company is not earning enough to pay interest. It is either borrowing more to survive or selling assets. This is where wealth gets destroyed. As Warren Buffett warns: “Only when the tide goes out do you discover who has been swimming naked.” Companies with ICR below 1x are swimming naked.
The Real Power of ICR — Trend Analysis Over Three to Five Years
A single year’s ICR tells you the current snapshot. But the real insight comes from tracking the trend. Here is what to look for:
Rising ICR Over Time: This signals improving business fundamentals — either revenues are growing, margins are expanding, or the company is paying down debt. All of these are positive. A company whose ICR moves from 3x to 5x to 8x over three years is clearly strengthening its financial position.
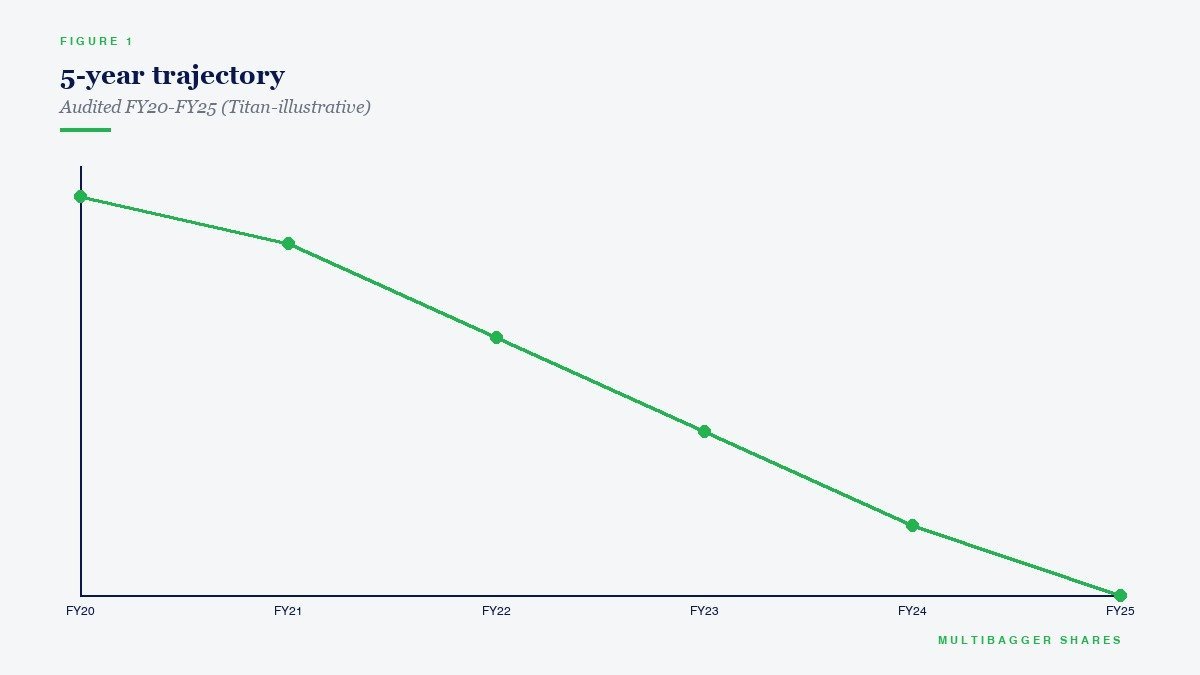
Stable ICR at High Levels: Consistency at 8x or above suggests a mature, well-managed business with predictable cash flows. These are compounding machines.
Declining ICR: This is the most dangerous signal. Even if the current ICR is 4x, if it was 8x two years ago and 6x last year, the trend is deteriorating. Investigate why. Is the company taking on more debt for capex (potentially acceptable if returns on capital are high)? Or are profits declining while debt stays constant (very concerning)?
Sector-Specific ICR Benchmarks for Indian Markets
Different sectors operate with different capital structures, so a one-size-fits-all benchmark is misleading. Here are sector-specific guidelines for Indian investors:
IT Services (Infosys, TCS, Wipro type companies): ICR should be above 15x. These are asset-light businesses with minimal debt. If an IT company has low ICR, something is fundamentally wrong.
FMCG (HUL, Nestlé, Britannia type companies): ICR above 10x is expected. Strong brands generate predictable cash flows with low capital intensity.
Banking and NBFCs: Traditional ICR analysis does not directly apply here because interest is both an expense and revenue. Instead, use Net Interest Margin (NIM) and provision coverage ratios. However, for NBFCs, monitoring the ability to service wholesale borrowings through lending income remains critical.
Pharmaceuticals and Biotech: ICR above 5x is healthy. Consider Titan Biotech — with ROCE of 16.9%, ROE of 15%, and near-zero debt — as a textbook example of a biotech company that does not need to worry about interest coverage because it has virtually eliminated debt from its balance sheet. That is the gold standard.
Infrastructure and Real Estate: ICR above 2.5x is acceptable given the capital-intensive nature. But trend improvement is essential. Avoid infra companies with declining ICR, no matter how grand their order book looks.
Chemicals and Manufacturing: ICR above 5x preferred. Capital expenditure cycles can temporarily depress ICR, but check if the capex is funded through internal accruals or fresh debt.
Case Study: How ICR Could Have Saved You from IL&FS
Infrastructure Leasing & Financial Services (IL&FS) was once considered a “quasi-government” entity — safe, reliable, backed by marquee shareholders. Retail investors and even institutional funds held IL&FS group debt without a second thought.
But the numbers told a different story. By 2016-2017, IL&FS group companies showed ICR declining below 1.0x across multiple subsidiaries. Their operating profits could not cover interest payments. The group had ₹94,000 crore in consolidated debt and was rolling over short-term borrowings to pay interest on long-term debt — a classic Ponzi-like financing structure.
Any investor who simply checked the Interest Coverage Ratio trend across IL&FS entities would have seen the red flag years before the September 2018 default that shook the entire Indian financial system, triggered a liquidity crisis among NBFCs, and wiped out billions in investor wealth.
The lesson: ICR does not lie. Narratives do.
How to Calculate ICR — A Practical Step-by-Step for Indian Investors
Step 1: Go to the company’s Profit & Loss statement (available on Screener.in, BSE/NSE filings, or annual reports).
Step 2: Find EBIT (Earnings Before Interest and Taxes). On Indian P&L statements, this is typically calculated as: Revenue – Operating Expenses – Depreciation. Some analysts use EBITDA instead of EBIT for a more conservative measure of cash-based coverage.
Step 3: Find Interest Expense (also called “Finance Costs” in Indian accounting standards under Ind AS). This includes interest on term loans, working capital facilities, debentures, and lease liabilities under Ind AS 116.
Step 4: Divide EBIT by Interest Expense. That is your ICR.
Step 5: Do this for the last five years and plot the trend. A rising or stable high ICR is what you want.
Advanced Applications — Using ICR in Your Investment Framework
For serious value investors building concentrated, high-conviction portfolios (remember, as Warren Buffett said: “Wide diversification is only required when investors do not understand what they are doing”), here is how to integrate ICR into your stock selection process:
Pre-Screening Filter: Set a minimum ICR of 3x for your initial stock universe. This alone eliminates the most financially vulnerable companies and dramatically reduces your chance of permanent capital loss.
Quality Scoring: In our 95-factor analysis framework at Multibagger Shares, ICR is one of the key solvency metrics alongside Debt-to-Equity, Current Ratio, and Cash Flow from Operations. When you combine all four, you get a comprehensive picture of financial health.
Red Flag Detection: Any company where ICR drops below 2x for two consecutive quarters deserves immediate investigation. Check if promoters are pledging shares (another red flag we track closely), if auditors have flagged going-concern issues, or if the company has recently changed auditors.
Merger and Acquisition Analysis: When evaluating companies that grow through acquisitions, check if the ICR declines post-acquisition. Many companies destroy shareholder value by acquiring businesses funded through excessive debt, which crushes their ICR.
The SEBI “90% Lose Money” Warning and Why ICR Protects You
SEBI’s landmark study revealed that 9 out of 10 individual traders in the equity Futures & Options segment incurred net losses. Those gamblers chase momentum, leverage, and short-term excitement. They never check fundamentals like ICR.
As value investors, our approach is the opposite. We want companies with rock-solid financials, minimal debt, strong interest coverage, and a clear path to long-term wealth creation. Titan Biotech — with its current price of ₹478, book value of ₹40.3, EPS of ₹6.59, and virtually zero debt — exemplifies this philosophy. Its operating margins of 17% and ROCE of 16.9% demonstrate a business that generates substantial returns on capital without relying on leverage.
Stop gambling in F&O. Start investing in quality businesses. Use the Interest Coverage Ratio as your shield against financial disaster.
Your Action Plan — Start Using ICR Today
Here is what I want you to do right now:
First, go to Screener.in and look up the Interest Coverage Ratio for every stock in your portfolio. If any stock has ICR below 2x, put it on your watchlist for potential exit.
Second, for your next stock purchase, make ICR above 3x a mandatory filter. Do not compromise on this.
Third, track the ICR trend over five years. A single year means nothing. The trend is everything.
Fourth, combine ICR analysis with other quality metrics — ROCE, ROE, Cash Flow from Operations, Promoter Holding trends — to build a comprehensive quality picture.
And if you want to learn the complete 95-factor framework that I use to identify multibagger stocks, check out our free Value Investing Course: Watch the Full Course Here.
Remember: in investing, the companies that survive and thrive are the ones that can comfortably service their obligations in good times and bad. The Interest Coverage Ratio is your window into that survival capacity. Use it wisely, and you will avoid the financial disasters that destroy 90% of retail investors’ wealth.
Keep learning. Keep investing in quality. The market rewards patience and discipline — always.
📢 Join Our Telegram Channel
Get daily value investing lessons, stock analysis & Titan Biotech updates — delivered straight to your phone!
✈️ Join @longtermequityy on Telegram
🔔 Free • No spam • Value investing insights daily
Disclaimer: This article is for educational and informational purposes only. It is not investment advice, and not a buy, sell, or hold recommendation on any stock mentioned, including Titan Biotech Limited. Equity markets carry risk; please do your own research or consult a qualified professional before making investment decisions.
