April 12, 2026
(Sunday)
Introduction: The Invisible Hand That Moves Indian Markets Every Single Day
If you have been watching the Indian stock market in 2026, you have witnessed something extraordinary. Foreign Institutional Investors (FIIs) have pulled out over ₹1.04 lakh crore from Indian equities since January, yet Domestic Institutional Investors (DIIs) have absorbed nearly all of it — keeping the market from a far worse crash. The SENSEX, currently near 76,632 and NIFTY 50 around 24,051 levels, would have been much lower without the powerful DII buying support.
Understanding FII and DII flows is not just academic knowledge — it is a practical survival skill for every Indian investor. These institutional flows are the single largest driver of short-term market movements, and understanding them gives you a massive edge over the 90% of retail investors who simply react to headlines without understanding the forces behind them.
Today, I will break down the complete FII/DII framework — what these flows are, why they matter, how to track them, and most importantly, how a concentrated value investor should use this data to their advantage.
What Exactly Are FII and DII Flows?
Foreign Institutional Investors (FIIs), also called Foreign Portfolio Investors (FPIs), are entities based outside India that invest in Indian securities. These include global hedge funds, pension funds, sovereign wealth funds, and mutual funds from the United States, Europe, Singapore, and other countries. When CNBC flashes “FIIs sold ₹3,000 crore today,” they are referring to the net buying or selling activity of these foreign entities on Indian stock exchanges.
Domestic Institutional Investors (DIIs) include Indian mutual funds, insurance companies like LIC and HDFC Life, pension funds like EPFO, and banks. These are entities that pool Indian savings and deploy them into Indian equities. The rise of SIP (Systematic Investment Plan) culture — with monthly SIP flows now exceeding ₹25,000 crore — has made DIIs a formidable counterforce to FII selling.
Every trading day, both NSE and BSE publish the net buy/sell figures for FIIs and DIIs in the cash segment. This data is freely available on NSE India’s website and platforms like Trendlyne and MoneyControl. Smart investors check this data daily — it takes 30 seconds and gives you a pulse on the market’s institutional sentiment.
Why FII Flows Have Such Outsized Impact on Indian Markets
Here is a fact that surprises most retail investors: FIIs hold approximately 16-18% of the total market capitalisation of Indian listed companies. Yet their daily trading activity often accounts for 30-40% of total market turnover. This means FIIs punch far above their weight in terms of price impact.
When FIIs sell aggressively — as they have in 2026, with ₹37,933 crore of net outflows in just the first 8 days of April alone — it creates immediate selling pressure that pushes prices down. Conversely, when FIIs buy aggressively, it creates a liquidity-driven rally that lifts the entire market.
The key reasons FIIs have been selling Indian equities in 2026 include: (1) geopolitical tensions including the Iran situation and global trade war fears from Trump tariffs, (2) Indian market valuations that were stretched after the 2023-2024 bull run, (3) a strong US dollar making dollar-denominated returns from India less attractive, and (4) reallocation of capital to other emerging markets offering better risk-reward.
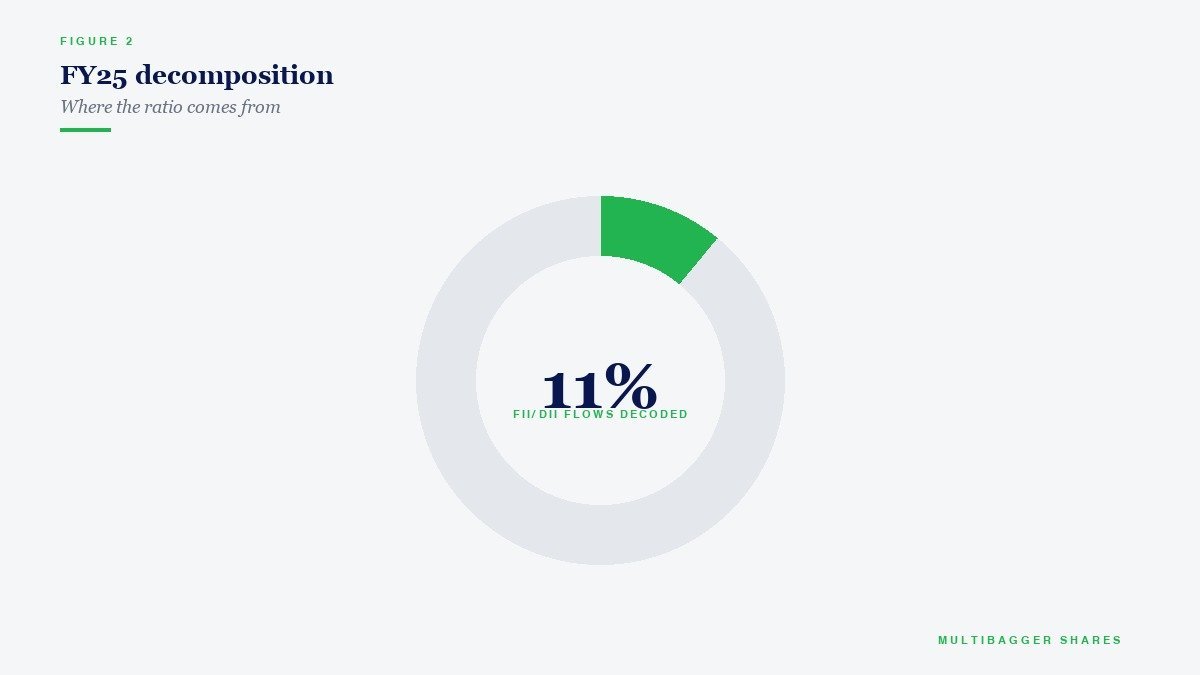
In April 2026 alone, FIIs have sold approximately ₹37,933 crore while DIIs have bought ₹34,617 crore — absorbing over 91% of the foreign selling pressure. This is a structural shift from even 5 years ago, when India had no such domestic cushion.
The DII Revolution: India’s Domestic Shield
The biggest story in Indian capital markets over the last decade is not any individual stock or sector — it is the rise of domestic institutional investment. Monthly SIP flows have grown from ₹3,000 crore in 2016 to over ₹25,000 crore in 2026. This is a tenfold increase in just 10 years.
What does this mean practically? It means that Indian markets now have a built-in shock absorber. When FIIs panic and sell (as they always do during global crises), DIIs step in and buy. This is exactly what happened on April 7, 2026, when FIIs pulled out ₹8,692 crore but DIIs bought ₹7,980 crore — absorbing 92% of the selling.
As Warren Buffett famously said, “Wide diversification is only required when investors do not understand what they are doing.” The retail investors pouring money into SIPs are inadvertently creating a powerful institutional buyer — but as individual investors, you should not blindly follow the DII playbook of buying index-heavy portfolios. Instead, use the understanding of FII/DII dynamics to time your purchases of deeply researched, high-conviction multibagger stocks.
How Smart Value Investors Use FII/DII Data
Here is the most important insight of this entire article: FII selling creates the buying opportunities that make multibaggers. When foreign institutions sell aggressively, they push down prices indiscriminately — quality stocks fall along with mediocre ones. This is precisely when a concentrated value investor with deep research should be deploying capital into their best 5-10 ideas.
Consider Titan Biotech (BSE: 524717), currently trading at approximately ₹432 with a market capitalisation of ₹1,783 crore. This is a SEBI-compliant, fundamentally strong company with ROCE of 16.9%, ROE of 15.0%, and a book value of ₹40.3 per share. During periods of heavy FII selling, small-cap quality stocks like Titan Biotech often get unfairly punished because FIIs primarily sell large-cap and mid-cap holdings, which triggers a risk-off sentiment that drags down the entire market including small-caps.
The correct response during FII selling waves is not to panic — it is to review your research and buy more of what you already know is fundamentally strong. The greatest investors in history — Buffett, Munger, Jhunjhunwala, Pabrai — all made their biggest returns by buying aggressively when institutional selling created temporary price dislocations.
The 5-Step FII/DII Analysis Framework for Indian Value Investors
Step 1: Track daily FII/DII data. Visit NSE India’s FII/DII activity page or Trendlyne’s macro data section every evening. Note whether FIIs are net buyers or sellers, and the magnitude. A single day of ₹500 crore selling is noise; ten consecutive days of ₹5,000+ crore selling is a signal.
Step 2: Watch the cumulative monthly trend. Individual days are volatile. What matters is the monthly cumulative picture. If FIIs have sold ₹30,000+ crore in a single month (as in April 2026), the market is likely under significant institutional stress — and this stress creates opportunity for prepared investors.
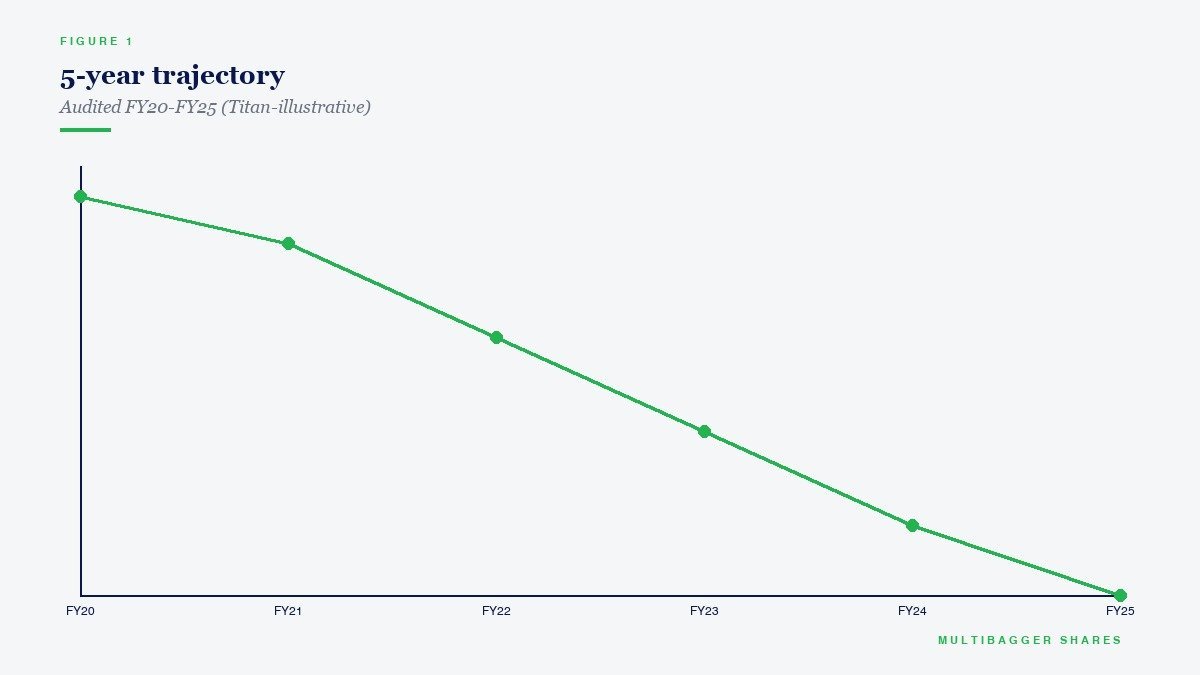
Step 3: Monitor the DII absorption ratio. If DIIs are absorbing 80%+ of FII selling, the market has strong domestic support and is unlikely to crash further. If DIIs are absorbing less than 50%, the downside risk is higher. In April 2026, the DII absorption ratio has been above 90% — a very positive signal.
Step 4: Check FII/DII activity in your specific sector. FIIs tend to sell what is most liquid — large-cap banking, IT, and FMCG stocks. Small-cap quality stocks often face only indirect selling pressure. This creates a paradox: the best buying opportunities are in quality small-caps during FII selling waves, because the price drops are sentiment-driven, not fundamentals-driven.
Step 5: Use extreme FII selling as your buy signal. When FII monthly outflows exceed ₹20,000 crore and media headlines scream “FIIs fleeing India,” that is historically one of the best times to invest. The data proves this — after every major FII selling wave (2008, 2013, 2020, 2022), the market recovered and reached new highs within 12-18 months.
Historical Evidence: What Happened After Major FII Selling Episodes
Let me give you the data that will change how you think about FII selling forever:
2008 Global Financial Crisis: FIIs pulled out approximately ₹52,987 crore from Indian equities. The SENSEX crashed from 21,000 to 8,000. Yet within 5 years, the SENSEX was back above 21,000 and within 10 years it had tripled. Investors who bought during peak FII selling in October 2008 earned 400%+ returns.
2013 Taper Tantrum: FIIs sold approximately ₹44,162 crore between May-August 2013. The Rupee crashed to ₹68 per dollar. Yet within 2 years, the SENSEX reached all-time highs. The taper tantrum was a gift for value investors.
2020 COVID Crash: FIIs sold ₹61,973 crore in March 2020 alone. The NIFTY crashed from 12,000 to 7,500 in just 30 days. Yet by December 2020, NIFTY was above 14,000 — a 90% recovery in just 9 months. Quality small-cap stocks gave 200-500% returns from COVID lows.
2022 FII Exodus: FIIs pulled out a record ₹1.21 lakh crore in 2022. The market corrected 15% from its highs. Yet by 2024, both SENSEX and NIFTY had set multiple new all-time highs.
The pattern is crystal clear: FII selling creates the conditions for wealth creation. Every major FII selling wave in Indian market history has been followed by a powerful recovery.
The Myth of “Following FII Money”
Many retail investors make the catastrophic mistake of trying to follow FII money — buying when FIIs buy and selling when FIIs sell. This is the exact opposite of what you should do.
FIIs are not long-term investors in India. They are portfolio allocators who shift money between countries based on macro factors like currency movements, interest rate differentials, and relative valuations. Their investment horizon is often just 6-12 months. A value investor’s horizon should be 5-10 years minimum.
When you sell your quality holdings just because FIIs are selling, you are letting someone with a completely different investment objective and time horizon dictate your decisions. This is like a farmer abandoning his crop because a tourist said it might rain tomorrow.
Instead, use FII selling as a contrarian signal. When FIIs sell, quality stocks become cheaper. When quality stocks become cheaper, your expected future returns go up. This is simple mathematics, not speculation.
How to Track FII/DII Data: Free Tools Every Indian Investor Should Use
NSE India (nseindia.com/reports/fii-dii): The official source. Published daily by 7 PM. Shows FII and DII provisional figures for cash and derivatives segments.
Trendlyne (trendlyne.com/macro-data/fii-dii/): Excellent visualisation of FII/DII trends over weeks, months, and years. Shows cumulative flows and absorption ratios.
MoneyControl FII/DII Tracker: Real-time data with historical comparison. Good for tracking sector-wise institutional activity.
NSDL FPI Monitor (fpi.nsdl.co.in): Shows detailed FPI investment data by country of origin and sector — useful for understanding which types of foreign investors are buying or selling.
Spending 2 minutes daily reviewing this data will give you a massive informational edge over the retail crowd that only reacts to price movements without understanding the institutional forces driving them.
The Titan Biotech Lens: How Quality Small-Caps Navigate FII Storms
Titan Biotech (BSE: 524717) provides a textbook example of how quality small-cap companies are resilient during FII selling storms. With a current price of approximately ₹432, a market cap of ₹1,783 crore, ROCE of 16.9%, and ROE of 15.0%, this is a fundamentally strong business.
FIIs rarely hold significant positions in small-cap stocks below ₹5,000 crore market cap. This means that FII selling pressure affects small-caps primarily through sentiment contagion, not through actual selling of those specific stocks. When the NIFTY falls 2% because FIIs sold ₹5,000 crore of large-cap stocks, small-caps often fall in sympathy — creating an artificial discount on fundamentally sound businesses.
This is exactly the kind of market inefficiency that concentrated value investors exploit. If you have done deep research on 5-10 high-conviction ideas (using frameworks like our comprehensive 95-factor analysis), you should view FII-driven market dips as opportunities to add to your positions at better prices.
Remember what SEBI’s own study found: 9 out of 10 individual traders in the equity Futures & Options segment incurred net losses. F&O trading is essentially gambling. Instead of trying to trade FII/DII data for short-term profits, use it as a strategic input for your long-term value investing decisions.
The 2026 Outlook: What FII/DII Trends Tell Us About the Road Ahead
As of April 2026, FIIs have withdrawn over ₹1.04 lakh crore from Indian equities year-to-date. This is significant but not unprecedented — they pulled out ₹1.21 lakh crore in all of 2022. The key difference in 2026 is that DIIs are far stronger than they were in 2022, with monthly SIP flows providing a consistent ₹25,000+ crore of buying support.
The fundamentals of India’s economy remain strong. GDP growth continues at 6.5%+, corporate earnings are growing, and the long-term structural story of India’s demographic dividend, rising middle class, and formalisation of the economy remains intact. FII selling is creating a valuation reset that will ultimately benefit long-term investors.
For our community, the message is clear: stay invested in quality, ignore the noise of daily FII/DII headlines, but use major FII selling waves as strategic entry points for your highest-conviction ideas. The greatest wealth in Indian markets has always been created by those who bought when others were selling in panic.
Key Takeaways
First, FII and DII flows are the largest institutional forces moving Indian stock prices daily. Understanding them gives you a significant edge over uninformed retail investors.
Second, FII selling is historically a buying opportunity, not a selling signal. Every major FII selling wave in Indian history has been followed by a powerful market recovery within 12-18 months.
Third, DIIs have become a powerful domestic shield. With SIP flows exceeding ₹25,000 crore monthly, India’s dependence on foreign capital for market stability has reduced dramatically.
Fourth, quality small-caps like Titan Biotech (₹432, ROCE 16.9%) are often unfairly punished during FII selling waves due to sentiment contagion — creating buying opportunities for prepared investors.
Fifth, never follow FII money blindly. Their investment horizon and objectives are completely different from a long-term value investor’s. Use their selling as your buying signal, not as a reason to panic.
To deepen your understanding of value investing frameworks, watch our complete free course on YouTube: Value Investing Masterclass Playlist.
📢 Join Our Telegram Channel
Get daily value investing lessons, stock analysis & Titan Biotech updates — delivered straight to your phone!
✈️ Join @longtermequityy on Telegram
🔔 Free • No spam • Value investing insights daily
Disclaimer: This article is for educational and informational purposes only. It is not investment advice, and not a buy, sell, or hold recommendation on any stock mentioned, including Titan Biotech Limited. Equity markets carry risk; please do your own research or consult a qualified professional before making investment decisions.
