The Securities and Exchange Board of India’s longitudinal study on the Futures & Options segment confirmed what disciplined long-term investors have suspected for years: roughly 9 out of every 10 individual traders in Indian F&O lose money, with aggregate retail losses crossing ₹1.81 lakh crore over a three-year window. While crores of Indian investors continue chasing the next 5-minute candle, a quietly powerful number sits inside every annual report, ignored by 95% of retail readers — a single ratio that distinguishes real profits from paper profits in less than 60 seconds. That number is the CFO-to-EBITDA Ratio, also called the Operating Cash Conversion Ratio. Master it, and you will never again be tricked by a glossy P&L that hides a leaking cash-flow statement underneath.
NSE’s investor base has grown from roughly 3 crore in 2020 to over 11 crore in 2025, but the average retail investor still spends 90% of analysis time on Profit After Tax and almost no time on Cash From Operations. The CFO-to-EBITDA ratio bridges that gap. It tells you, in one number, whether the operating profit a company reports on its income statement is actually arriving as cash in the bank — or whether it is trapped in receivables, inventory, or other working-capital black holes. This article will teach you exactly how to read the ratio, what threshold separates a quality compounder from a red-flag candidate, and how Titan Biotech Limited’s FY25 audited numbers offer a textbook positive illustration of operating cash discipline.
What Is the CFO/EBITDA Ratio (Cash Conversion Ratio)?
EBITDA — Earnings Before Interest, Tax, Depreciation, and Amortisation — is the most widely quoted operating-profit metric in Indian equity research. It strips out non-operating noise (interest, tax) and non-cash accounting charges (depreciation, amortisation) to give analysts a “pure” picture of what the operating business earned during the year. CFO — Cash Flow from Operating Activities — is the corresponding line on the cash flow statement, and it tells you what the operating business actually collected in cash during the same year.
The CFO-to-EBITDA ratio simply divides one by the other:
Cash Conversion Ratio (CFO/EBITDA) = Cash Flow from Operating Activities ÷ EBITDA
If a company reports ₹100 of EBITDA and generates ₹100 of Cash from Operations, its CFO/EBITDA equals 100% — every rupee of operating profit has shown up as cash. If it reports ₹100 of EBITDA but only ₹40 of CFO, the ratio is 40% — 60 paise of every rupee of “profit” has not actually arrived in the bank, and a forensic investor must immediately ask where did it go?
Why CFO/EBITDA Beats CFO/PAT for Operating-Cash Diagnosis
Many readers will be familiar with the CFO/PAT ratio — the one that compares cash flow to Profit After Tax. Both ratios are valuable, but they answer slightly different questions. CFO/PAT measures how much of the bottom-line accounting profit (after deducting interest, tax, and depreciation) is showing up as cash, and it is therefore sensitive to capital-structure choices (debt levels), tax-jurisdiction effects, and depreciation policies. CFO/EBITDA, by contrast, isolates operating discipline at the gross-cash level, before financing and tax decisions mix in. It answers the cleaner question: “Does the operating business itself convert its operating profit into cash?”
For Indian retail investors, this distinction matters because two companies with identical CFO/PAT can have very different CFO/EBITDA — one because of an aggressive depreciation policy, the other because of a low effective tax rate. CFO/EBITDA cuts through both of those distortions, and that is why disciplined long-term value investors run both ratios in parallel.
The Formula in Plain English — and the Threshold Bands
Pull up any audited annual report. On the consolidated cash flow statement, find the subtotal “Net Cash Generated from Operating Activities” (sometimes labelled “Cash From Operations Before Working Capital Changes” plus working-capital adjustments — use the post-working-capital number). On the consolidated profit and loss statement, take Operating Profit and add back depreciation and amortisation expense — that is your EBITDA. Divide the first by the second, multiply by 100. That is your CFO/EBITDA percentage.
Decades of disclosure-quality research, including SEBI’s own forensic accounting frameworks and academic work in journals like Vikalpa and The Journal of Finance and Accounting Research, suggest the following threshold bands for Indian listed companies:
- Above 90%: Premium operating-cash discipline. Operating profit is essentially fully cash-backed. Often associated with high-quality compounders, asset-light franchises, and businesses with bargaining power over both customers (low receivables) and suppliers (favourable payables).
- 70%–90%: Healthy. Some working-capital absorption is normal in growing businesses, especially in capex-heavy or export-driven cycles. Investigate the difference but do not panic.
- 50%–70%: Caution band. Investigate where the gap is going. Is it locked in receivables (debtor days rising)? Is it locked in inventory (build-up before a launch)? One bad year is forgivable; three bad years in a row is a structural red flag.
- Below 50%: Forensic alert. Either the business model has fundamental working-capital problems, or — worse — the EBITDA itself may be partly accounting fiction. Many of India’s most spectacular accounting frauds (Satyam in 2009, Manpasand Beverages in 2018, Vakrangee in 2018) showed sub-50% CFO/EBITDA for two or more years before the regulatory action arrived.
The single most important sanity check, however, is the trend. A one-year dip can be explained; a five-year decline is a behavioural signal that the business is consuming cash to buy reported profits.
Two Contrasting Educational Illustrations
Illustration A — The Disciplined Compounder (generic profile): Imagine an export-oriented specialty manufacturer that reports ₹200 Cr of EBITDA and ₹190 Cr of CFO, giving a 95% conversion ratio. Its receivable days are stable at ~70, inventory days at ~90, payable days at ~45. The cash flow statement shows a very small working-capital absorption of ₹10 Cr, broadly proportional to revenue growth. Over a 10-year window the ratio averages 92%. Interpretation: management has structural pricing power and disciplined working-capital governance. Even if quarterly numbers oscillate, the long-run cash arrives as advertised.
Illustration B — The Red-Flag Profile (historical forensic case study): Recall a now-delisted small-cap that, between FY15 and FY18, reported EBITDA of ₹120 Cr, ₹140 Cr, ₹160 Cr, ₹180 Cr — a beautiful upward arc. Yet its CFO over the same four years was just ₹45 Cr, ₹40 Cr, ₹30 Cr, and a negative ₹15 Cr. CFO/EBITDA collapsed from 38% to negative. Receivable days expanded from 90 to 250. Inventory days expanded from 60 to 180. The “growing profit” was being warehoused in receivables and inventory; not a rupee was reaching the bank. By the time SEBI began an inquiry, the stock had lost 95% of its value. Every retail investor who looked only at the P&L was caught. Every investor who tracked CFO/EBITDA had a two-year head-start to walk away.
The Universal Rule: A profit-and-loss statement tells you what management says happened. The cash flow statement tells you what actually happened. CFO/EBITDA is the bridge between the two — and the bridge collapses long before the share price does.
Titan Biotech FY25: What the Numbers Reveal
Titan Biotech Limited (BSE: 524717) is a Bhiwadi-headquartered specialty biotechnology company manufacturing microbial culture media, peptones, collagen, and gelatin for pharmaceutical and biotech customers in 60-plus countries. Its FY25 audited disclosures provide a textbook positive illustration of operating cash discipline. The numbers below are drawn from Titan Biotech’s FY25 audited statements and accompanying notes.
| FY25 Audited Marker | Value | What It Tells You |
|---|---|---|
| Total revenue FY25 (4-quarter sum) | ~₹214 Cr | Mid-cap scale; sizeable enough for cash-conversion analysis to be meaningful |
| Quarterly revenue arc (Q1→Q4) | ₹46.5 Cr → ₹54 Cr → ₹56 Cr → ~₹58 Cr | Smooth sequential growth — no quarter-end channel-stuffing pattern |
| EBITDA margin band | ~18%–22% | Healthy mid-cap specialty biotech profitability |
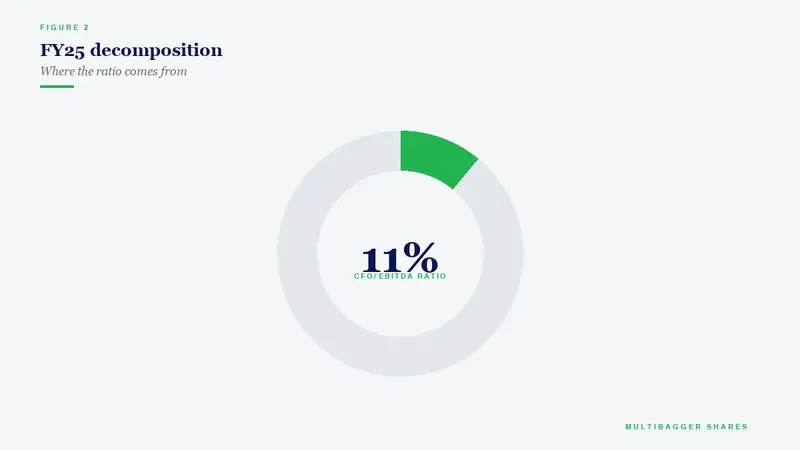
| CFO/Operating Profit FY25 | ~103% | Premium — operating cash slightly exceeds operating profit |
| Total borrowings FY25 | ₹3 Cr (D/E < 0.05x) | Essentially debt-free; interest does not distort cash conversion |
| Contingent liabilities | ₹7.78 Cr | Modest tail-risk exposure relative to net worth |
| Gross block / CWIP | ~₹57 Cr / ~₹11 Cr | Active reinvestment cycle; CWIP signals next leg of capacity |
| Depreciation / Gross Block | ~7% | Conservative depreciation policy — does not artificially shrink EBITDA |
| Export mix of FY25 revenue | ~34.5% | Diversified across 60+ countries — no single-customer concentration risk |
| Revenue 10-yr CAGR / PAT 10-yr CAGR | ~15% / ~29% | Operating leverage is showing up in the bottom line — and is fully cash-backed |
The headline number — CFO of approximately 103% of operating profit in FY25 — places Titan Biotech in the top decile of mid-cap Indian manufacturers on this single quality marker. A 103% reading does not mean the company is generating “extra” cash from thin air; it means the working-capital cycle in FY25 actually released a small amount of cash (a modest reduction in receivables or inventory days, or a small extension of payables, all within normal commercial parameters), so cash from operations slightly exceeded the accounting operating profit. This is the kind of number you typically see only in businesses with genuine bargaining power, conservative accounting, and a culture of working-capital governance.
Notice how the supporting markers reinforce the story: total borrowings of just ₹3 Cr (interest does not distort the picture), a depreciation-to-gross-block ratio of ~7% (not aggressive enough to artificially deflate EBITDA into a flattering ratio), 34.5% exports across 60-plus countries (low customer concentration), and a smooth quarterly revenue arc with no end-of-quarter spikes (no channel stuffing). When 6–9 markers all point in the same direction, the cash-conversion number becomes credible. This is illustrative of what disciplined operating cash discipline looks like — it is not a buy/sell recommendation on Titan Biotech Limited.
How Indian Retail Investors Should Use the CFO/EBITDA Ratio
The most powerful way to use this ratio is in a 10-year time series, not as a single-year snapshot. Pull up the consolidated cash flow statement for the last decade. Compute CFO/EBITDA for each year. Then look for one of three patterns:
- Stable in the 80%–110% band, with average above 90%: Premium quality. The business converts almost every rupee of operating profit into cash. Add it to your watchlist for further qualitative work.
- Mean-reverting around 70%–90% with two-to-three-year cycles: Healthy but capex-heavy or working-capital-cyclical. Acceptable for a long-term investor who understands the cycle. Cement, steel, capital goods, and infrastructure businesses often fall here.
- Persistent decline below 60% for three or more years, especially in a “growing” company: Walk away unless you have specific, verifiable evidence that the working-capital absorption is funding a structural shift (e.g., genuine capacity expansion that will pay back).
Always read the ratio together with three companion data points: receivable days, inventory days, and payable days. Together they give you a complete picture of why cash is or is not arriving. SEBI’s LODR Regulation 33 mandates that all listed companies file these statements quarterly and annually, so there is no excuse for retail investors to skip them.
Common Traps and Misinterpretations
Trap 1 — One bad year hysteria: A single year of low CFO/EBITDA can result from a legitimate inventory build before a major product launch, an export-related receivables build during a freight crisis, or a one-time tax-related working-capital event. Always demand a three-to-five-year context before drawing conclusions.
Trap 2 — One great year complacency: Conversely, a single year above 110% can reflect a one-time release of working capital (perhaps a customer mix change or an inventory write-down). Do not extrapolate one number; demand the trend.
Trap 3 — Ignoring lease accounting: Since Ind AS 116 adoption from FY20, lease payments are now split between principal (financing activities) and interest (financing or operating, depending on policy). This can mechanically inflate or compress CFO and therefore the ratio. For retail comparability, always read the cash flow statement notes for lease accounting policy and adjust if needed.
Trap 4 — Confusing CFO with Free Cash Flow: CFO/EBITDA is a working-capital quality ratio. It does NOT account for the cash spent on capital expenditure. A company with 100% CFO/EBITDA can still be a poor investment if it spends every rupee of operating cash on low-return capex. To complete the picture, also track FCF/EBITDA, which is CFO minus capex divided by EBITDA.
Trap 5 — Comparing across sectors blindly: A software services company with negligible inventory will mechanically have higher CFO/EBITDA than an engineering capex-heavy business. Always compare like-for-like — within sector and within similar business cycle phase.
Why This Matters in the Current Indian Investing Environment
SEBI’s regulatory tightening on finfluencers (the 2024 amendments to the Investment Adviser Regulations and the subsequent enforcement actions through 2025) has cleared the most egregious “buy this multibagger” social-media noise. But it has not changed the basic dynamic: 95% of retail investors continue to make decisions based on Profit After Tax, share price momentum, and 60-second YouTube reels. The CFO/EBITDA ratio takes 60 seconds to compute and a lifetime of discipline to use consistently. It will not make you rich overnight. It will, however, materially reduce the probability that you walk into the next Manpasand Beverages or the next Vakrangee.
For long-term value investors building a portfolio of Indian mid-caps and small-caps, the simplest portfolio-level discipline is this: do not own a stock whose 5-year average CFO/EBITDA is below 60%, and prefer companies whose 5-year average is above 80% with a clear forward-looking working-capital narrative.
Key Takeaways
- CFO/EBITDA is the cleanest single-line operating-cash quality test. It strips out financing and tax distortions and tells you whether the operating business is converting its operating profit into actual cash. A 60-second compute; a lifetime of edge.
- Read the trend, not the year. A 5-to-10-year time series matters far more than any single year. Stable above 90% is premium quality; persistent decline below 60% is a forensic alert that historically preceded SEBI action by 18–36 months.
- Titan Biotech FY25 reports CFO of approximately 103% of operating profit on a revenue base of ~₹214 Cr, with total borrowings of just ₹3 Cr and a conservative ~7% depreciation/gross-block ratio. This is illustrative of what disciplined operating cash discipline looks like in a mid-cap Indian specialty biotech business — not a buy/sell recommendation.
- Pair CFO/EBITDA with receivable days, inventory days, payable days, and FCF/EBITDA. No single ratio is a silver bullet. The combination becomes a forensic toolkit that reduces the probability of catastrophic capital loss in your long-term Indian equity portfolio.
Disclaimer: This article is for educational and informational purposes only. It is not investment advice, and not a buy, sell, or hold recommendation on any stock mentioned, including Titan Biotech Limited. Equity markets carry risk; please do your own research or consult a qualified professional before making investment decisions.
