Survivorship Bias: The Invisible Statistical Trap That Makes Indian Investors Overestimate Returns, Chase Past Winners, and Ignore the Graveyard of Failed Stocks — How to Think Clearly About Market Data and Build a Truly Resilient Portfolio

Hero header with title 'Survivorship Bias' and subtitle; below, a 2x2 color-block diagram labeled Lucky, Disciplined Investor, Confused, Bias-Trapped.

📅 Published April 09, 2026 (Thursday) Table of Contents Toggle The Dangerous Illusion: Why the Stocks You Study Are Not the Full Picture What Exactly Is Survivorship Bias? The Graveyard of Indian Stocks: What Nobody Talks About How Survivorship Bias

Loss Aversion: Why the Fear of Losing ₹1 Hurts Twice as Much as the Joy of Gaining ₹1 — How Indian Investors Can Overcome This Devastating Bias and Hold Multibaggers for the Long Term

Hero header for 'Loss Aversion' article with a four-quadrant color diagram labeled Lucky, Disciplined Investor, Confused, Bias-Trapped (investor mindsets).

📅 Published April 09, 2026 (Thursday) Table of Contents Toggle The ₹1 Lakh Experiment That Reveals Your Biggest Investment Weakness What Exactly Is Loss Aversion? The Science Behind the Pain The Indian Investor’s Loss Aversion Tax: Real Numbers Kahneman’s Prospect

Loss Aversion: Why the Fear of Losing ₹1 Hurts Twice as Much as the Joy of Gaining ₹1 — How Indian Investors Can Overcome This Devastating Bias and Hold Multibaggers for the Long Term

Hero header for 'Loss Aversion' article with a four-quadrant color diagram labeled Lucky, Disciplined Investor, Confused, Bias-Trapped (investor mindsets).

📅 Published April 09, 2026 (Thursday) Table of Contents Toggle The ₹1 Lakh Experiment That Reveals Your Biggest Investment Weakness What Exactly Is Loss Aversion? The Science Behind the Pain The Indian Investor’s Loss Aversion Tax: Real Numbers Kahneman’s Prospect

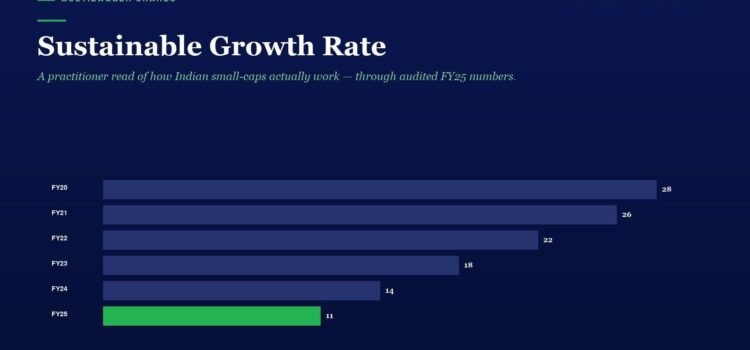
Sustainable Growth Rate

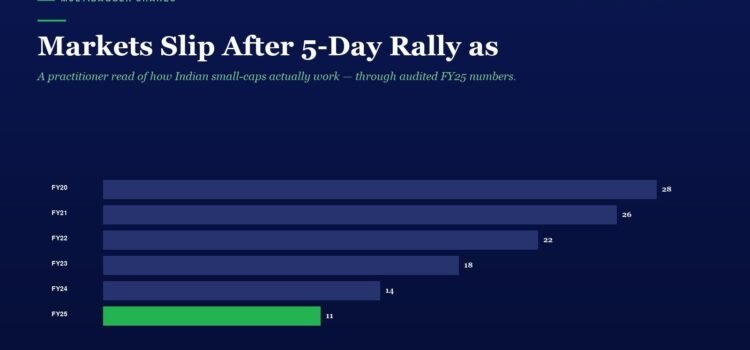
Infographic banner titled 'Sustainable Growth Rate' with a horizontal bar chart showing yearly values from FY20 to FY25; FY25 is highlighted in green (11) and the other bars are purple with values FY20 28, FY21 26, FY22 22, FY23 18, FY24 14; top-left label reads 'Multibagger Shares' and subtitle notes 'Daily Edition' style.

Most Indian investors obsess over revenue growth, profit margins, and return ratios when analyzing a small-cap stock. But there is one metric that quietly answers the most important question in fundamental analysis: How fast can this company grow using only