R&D and Innovation Pipeline

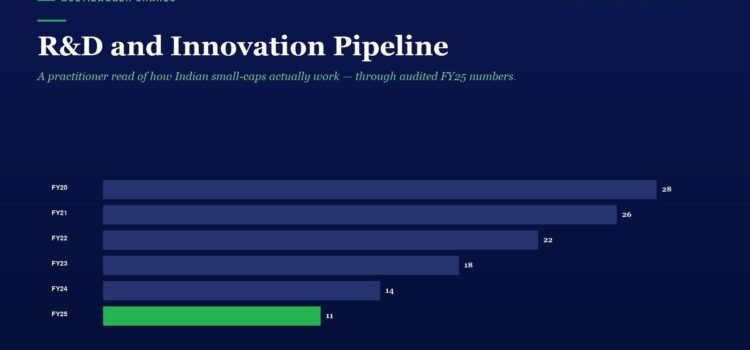
Bar chart: R&D and Innovation Pipeline; FY20 28, FY21 26, FY22 22, FY23 18, FY24 14, FY25 11.

In the world of Indian small-cap investing, most analysts focus on backward-looking metrics — what happened to revenue last quarter, what margins were last year. But the most forward-looking fundamental signal in any manufacturing company is its R&D and innovation

Export Revenue Mix

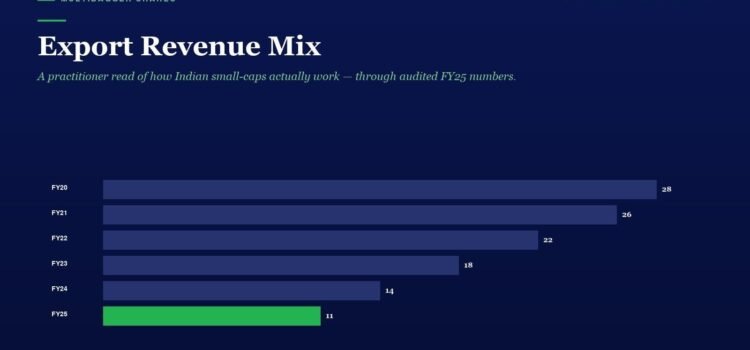
Infographic: horizontal bar chart of export revenue by fiscal year from FY20 to FY25; FY20 28, FY21 26, FY22 22, FY23 18, FY24 14, FY25 11 (green bar).

When Indian investors evaluate small-cap companies, they almost always focus on the domestic story — revenue growth, margins, market share within India. What they rarely examine is how much of the revenue comes from outside India, and why that geographic

Asset Turnover Ratio

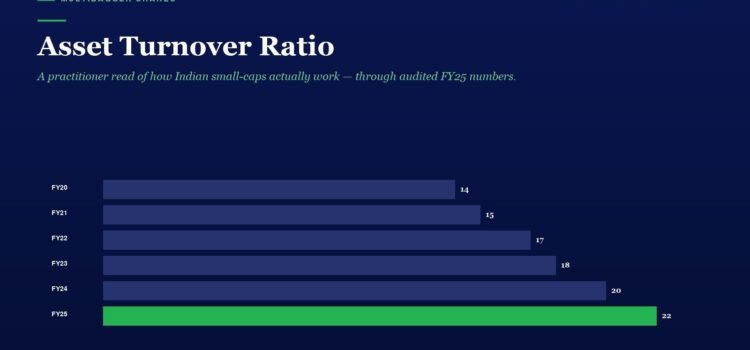
Horizontal bar chart titled Asset Turnover Ratio showing year-by-year values from FY20 to FY25; FY25 bar is green at 22.

Every balance sheet tells a story. But the most powerful stories aren’t always found in the profit and loss statement — they’re hidden in the relationship between a company’s assets and its ability to generate revenue from them. The Asset

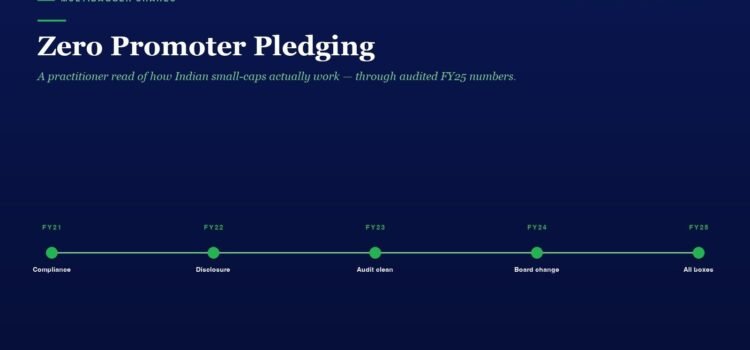
Zero Promoter Pledging

Hero section with the title "Zero Promoter Pledging" and a green milestone timeline from FY21 to FY25 (Compliance to All boxes). Reading the bottom timeline shows five milestones along the line: Compliance, Disclosure, Audit clean, Board change, All boxes.

In the Indian stock market, there is one silent killer that has destroyed more retail investor wealth than any market crash, any earnings miss, or any global crisis. It is called promoter pledging — and most investors do not even

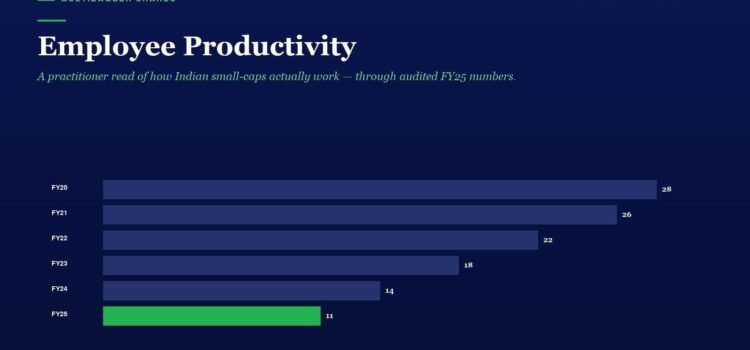
Employee Productivity

Infographic titled 'Employee Productivity' with horizontal bars showing FY20–FY25 values, peaking at 28 in FY20 and ending at 11 in FY25.

Behind every great company, there are great people. Yet most investors spend hours analysing revenue growth, profit margins, and return ratios — but never once look at how productively a company deploys its most valuable resource: its workforce. Employee productivity

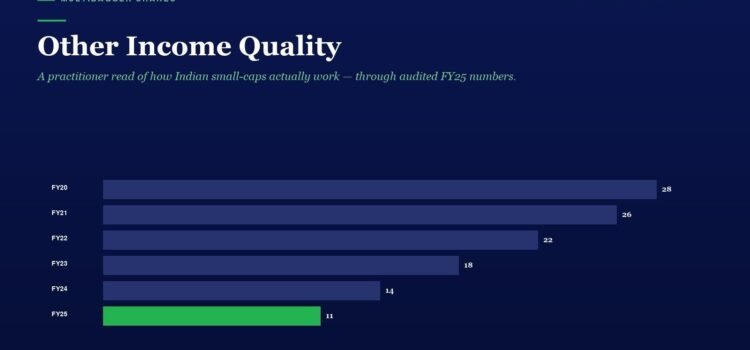
Other Income Quality

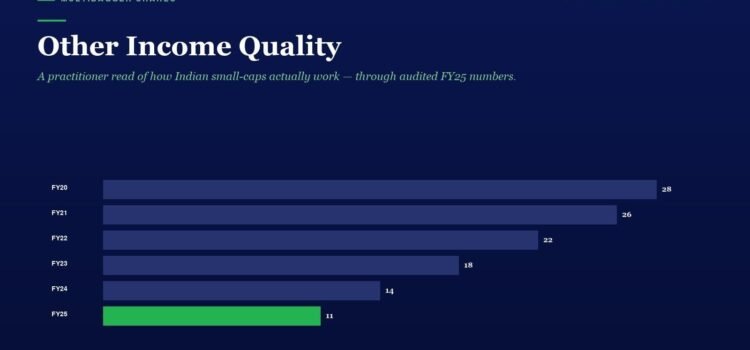
Infographic titled 'Other Income Quality' with six horizontal bars for FY20–FY25; values 28, 26, 22, 18, 14, 11; FY25 bar is green.

When you study a company’s Profit & Loss statement, most investors zoom straight to revenue, operating profit, and net profit. But there is a line item sitting quietly between Operating Profit and Profit Before Tax that can reveal an enormous

Other Income Quality

Bar chart titled 'Other Income Quality' showing yearly values FY20–FY25, declining from 28 to 11; FY25 bar is green.

When you study a company’s Profit & Loss statement, most investors zoom straight to revenue, operating profit, and net profit. But there is a line item sitting quietly between Operating Profit and Profit Before Tax that can reveal an enormous

Working Capital Efficiency

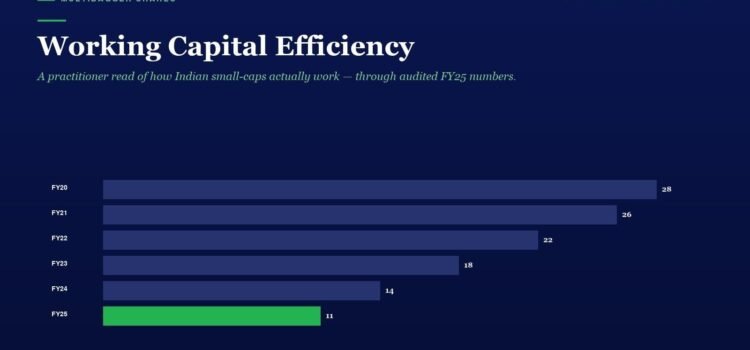
Infographic bar chart showing Working Capital Efficiency from FY20 to FY25; FY20 28, FY21 26, FY22 22, FY23 18, FY24 14, FY25 11 (green bar for FY25).

When investors evaluate a company, they typically look at revenue growth, profit margins, and return ratios. But there is a hidden layer of business quality that separates truly well-managed companies from those that merely look good on the surface: working