Between 2019 and 2025, India added approximately 8 crore demat accounts. NSE’s investor base alone expanded from 3 crore to over 11 crore in that window. Yet in February 2025 SEBI re-published the now-infamous finding that 93% of individual traders in the equity derivatives segment lost money in FY22, FY23 and FY24 combined — with aggregate losses of more than ₹1.81 lakh crore. The gap between “investor count” and “wealth created” has rarely been wider.
One of the simplest reasons retail wealth creation lags so dramatically is that most investors evaluate companies on average profitability — the headline RoE, the headline RoCE printed in every screener — while real wealth compounding is decided at the margin. The headline ratio tells you what the existing capital base earned last year. It does not tell you what every new rupee management plans to reinvest will actually earn. That distinction is the difference between the 100-bagger and the slow leak.
The metric that captures this distinction is Incremental Return on Invested Capital — almost always abbreviated as Incremental RoIC. It is a metric Michael Mauboussin (Counterpoint Global / Columbia Business School) repeatedly singles out in his “Calculating Return on Invested Capital” and “The Math of Value and Growth” notes as the single most important number for a long-term equity investor. Bruce Greenwald frames the same idea in Value Investing: From Graham to Buffett and Beyond as the “return on incremental investment” that separates a real franchise from an accounting illusion. Today we are going to teach exactly how to compute it from any Indian annual report, how to read it across cycles, and where the metric quietly breaks.
What Is Incremental Return on Invested Capital?
RoIC — Return on Invested Capital — measures how much operating profit a business produces per rupee of capital deployed in the business. Two heads of capital count: shareholders’ equity and interest-bearing debt. Together they fund the fixed assets, the working capital, the goodwill and the cash a firm needs to run.
The headline RoIC is a stock ratio — a snapshot at one moment in time:
RoIC (year) = NOPAT (year) ÷ Invested Capital (year)
where NOPAT = EBIT × (1 − effective tax rate) and Invested Capital = Equity + Total Debt − Cash & Equivalents.
Incremental RoIC is a flow ratio. It asks a different and harder question: of the extra rupees of capital the company put into the business this year (or over the last three or five years), how many extra rupees of after-tax operating profit did those rupees produce?
Incremental RoIC = ΔNOPAT ÷ ΔInvested Capital
over any window — typically the trailing 3 years or 5 years.
The arithmetic is almost embarrassingly simple. The discipline is in choosing windows, normalising for cycles, and resisting the temptation to read year-to-year noise as a signal. But once you compute it correctly, you have peered behind the headline number and seen what management’s most recent capital decisions actually delivered.
Formula, Step By Step
The four-step calculation any retail investor can do with an annual report and a calculator:
Step 1 — Pick a base year and a comparison year. The most common windows are FY(t) vs FY(t−3) and FY(t) vs FY(t−5). Three years smooths out one-year capex lumpiness. Five years smooths a full mini-cycle. Avoid year-over-year incremental RoIC — a single large capex bump or working-capital release will throw the ratio to either −200% or +800% and tell you nothing.
Step 2 — Compute NOPAT for both years. NOPAT = Operating Profit (EBIT) × (1 − effective tax rate). Use the company’s effective tax rate from the P&L — not the statutory 25%. For Indian companies the effective rate now sits between 22% and 26% post the September 2019 corporate tax cut, but older comparison years (FY18, FY19) may show 30%+. Always use each year’s actual effective rate to avoid manufacturing a fake margin expansion.
Step 3 — Compute Invested Capital for both years. The textbook formula is Invested Capital = Total Equity + Total Debt − Cash & Cash Equivalents. The cash subtraction is critical: a company sitting on ₹500 Cr of fixed deposits is not deploying that capital in the business, and including it understates the true RoIC of the operating business. Some analysts use the asset-side reconstruction: Invested Capital = Net Fixed Assets + Net Working Capital + Goodwill. Both definitions converge for most non-financial Indian companies. Pick one and stay consistent.
Step 4 — Take the deltas and divide. Incremental RoIC = (NOPAT in year t − NOPAT in year t−3) ÷ (Invested Capital in year t − Invested Capital in year t−3). Compare against the company’s cost of capital. In India, a fair pre-tax cost of capital for a debt-light industrial company sits around 12–14%. An Incremental RoIC comfortably above that line indicates value creation; a ratio below it indicates value destruction — new rupees are earning less than the cost of the capital that funds them. Crucially, this can be true even when the headline RoIC still looks respectable, because the headline ratio is weighted heavily toward legacy capital deployed at much higher returns a decade earlier.
Two Contrasting Examples: Discipline vs Red Flag
Illustration A — The Disciplined Compounder (composite, illustrative)
A specialty chemicals firm reports the following figures over a five-year window. Revenue grows from ₹400 Cr to ₹800 Cr. EBIT grows from ₹60 Cr to ₹160 Cr. Effective tax rate steady at 25%. So NOPAT moves from ₹45 Cr to ₹120 Cr — a delta of ₹75 Cr. Over the same period invested capital grows from ₹300 Cr to ₹550 Cr — a delta of ₹250 Cr (about ₹200 Cr of fresh capex plus ₹50 Cr of working-capital expansion).
Incremental RoIC = ₹75 Cr ÷ ₹250 Cr = 30%. The headline FY25 RoIC of ₹120 Cr ÷ ₹550 Cr is 21.8%. The incremental is higher than the headline, meaning the company’s most recent investments are earning better than its legacy stock of capital. This is the hallmark of a maturing compounder hitting operating leverage — exactly the pattern Greenwald describes when a firm enters its “franchise” phase. Every fresh rupee of investment is widening the moat, not diluting it.
Illustration B — The Quiet Red Flag (composite, illustrative)
A diversified industrial conglomerate reports headline RoCE of 14% — respectable on the surface. But over the trailing five years revenue grew from ₹6,000 Cr to ₹9,000 Cr (a modest 8.4% CAGR) while invested capital ballooned from ₹4,500 Cr to ₹8,500 Cr (a 13.6% CAGR — driven by an acquisition, a greenfield expansion, and a goodwill addition). NOPAT moved from ₹630 Cr to ₹1,000 Cr — a delta of ₹370 Cr against a capital delta of ₹4,000 Cr.
Incremental RoIC = ₹370 Cr ÷ ₹4,000 Cr = 9.25%. Against a cost of capital of 12–14%, every fresh rupee deployed is destroying value. The headline 14% RoCE looks fine because the legacy capital from FY15 is still earning the old high return. The incremental ratio exposes what the screener cannot: the moat is leaking, and the company is essentially recycling old high-return capital into new low-return projects to preserve the headline number. This is the silent failure mode Mauboussin warns about — a company that is “growing” in a way that is mathematically value-destructive.
The key insight is that neither example required examining strategy decks, management commentary, or quarterly concalls. Pure annual-report numbers, two windows, four divisions — and the second company is exposed. This is forensic value investing at its purest.
Titan Biotech FY25: What the Numbers Reveal
To anchor this discussion in a real Indian disclosure pattern, consider how Titan Biotech Limited (BSE: 524717) — a specialty biotechnology business headquartered in Bhiwadi, Rajasthan — presents the underlying inputs for an incremental-RoIC calculation in its FY25 audited filings. The following pool is drawn from the company’s FY25 audited disclosures.
| FY25 Audited Marker | Value |
|---|---|
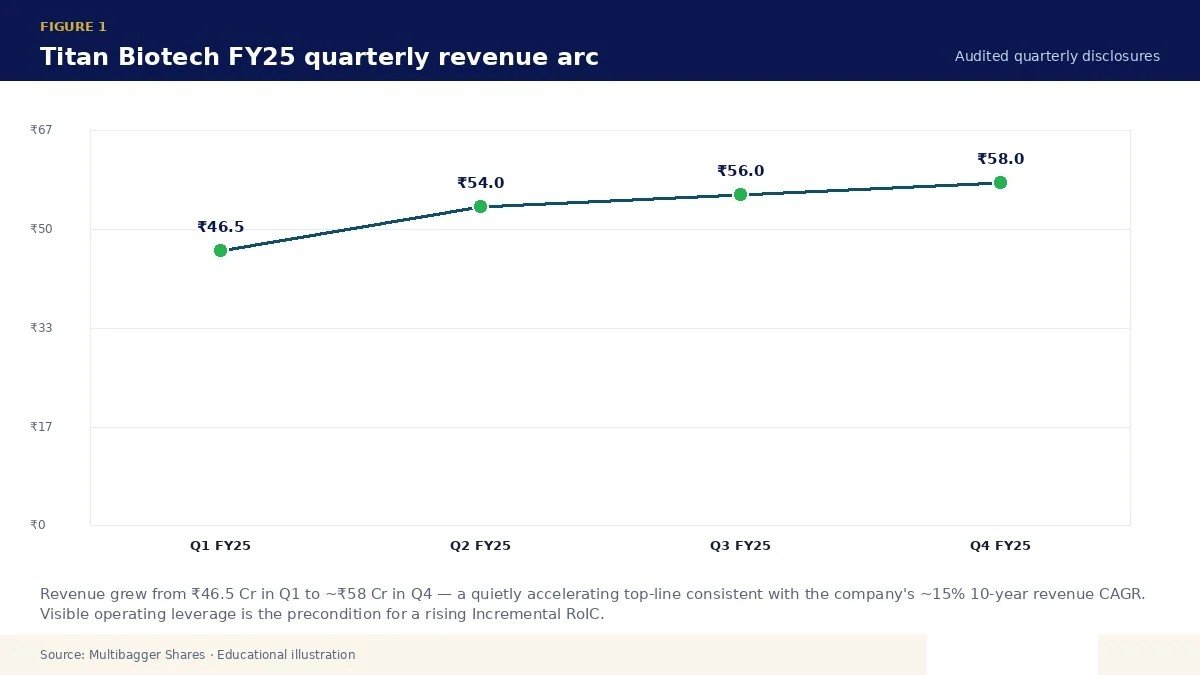
| Total Revenue FY25 (4-quarter sum) | ~₹214 Cr |
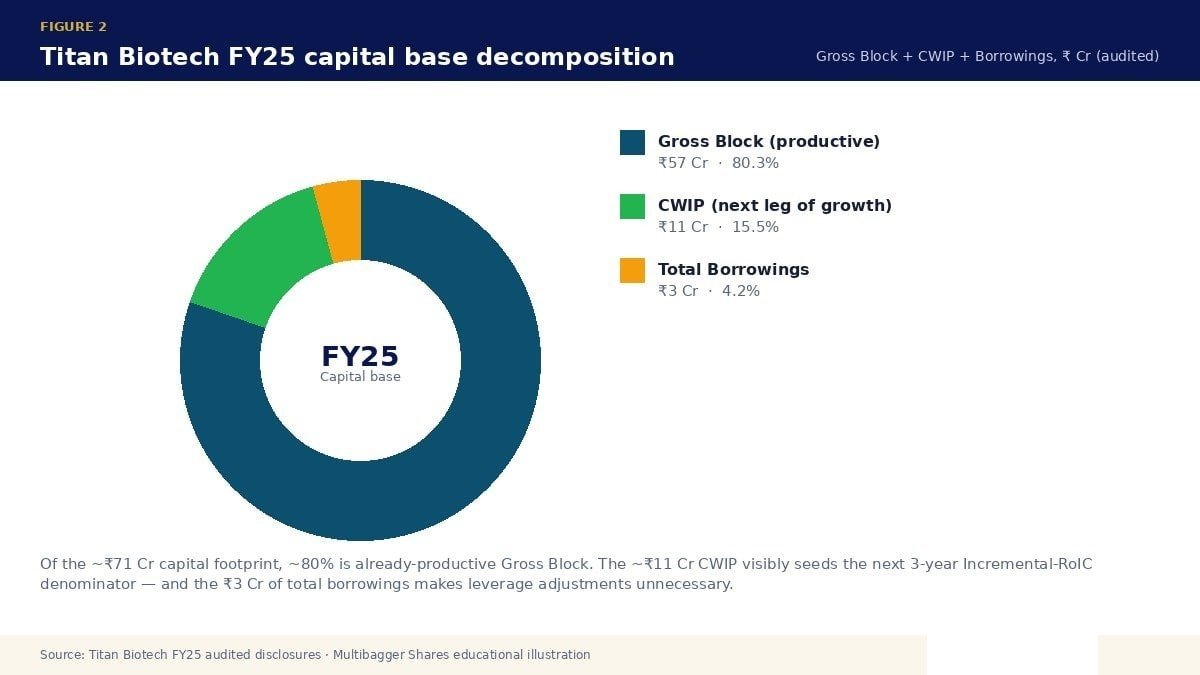
| Gross Block FY25 | ~₹57 Cr |
| Capital Work-in-Progress FY25 | ~₹11 Cr |
| Total Borrowings FY25 | ₹3 Cr |
| Debt / Equity FY25 | < 0.05x |
| Cash Flow from Operations / Operating Profit FY25 | 103% |
| Revenue 10-year CAGR | ~15% |
| PAT 10-year CAGR | ~29% |
| Export Mix FY25 | ~34.5% of revenue |
Three structural features of this disclosure set make it an instructive illustration of how a disciplined Indian SME-mid-cap surfaces the inputs an Incremental-RoIC analyst needs. First, the capital base is small and clearly visible. Gross Block of ~₹57 Cr plus CWIP of ~₹11 Cr against revenue of ~₹214 Cr means the asset turn (Revenue / Net Fixed Assets) sits at a healthy 3-4x — a number more often seen in lighter consumer staples than in chemicals. Second, debt is essentially absent. With total borrowings of just ₹3 Cr the invested-capital base is, for all practical purposes, the equity base, which means the Incremental-RoIC calculation does not have to be cleaned up for changing leverage assumptions. Third — and most important for the metric we are teaching today — the 10-year revenue CAGR of ~15% paired with the 10-year PAT CAGR of ~29% says the company has not just grown; it has grown profitably, with PAT compounding roughly two times faster than revenue. That is the empirical fingerprint of rising returns on each successive vintage of capital.
The CFO/OP ratio of 103% is the cleanest possible illustration of the “cash-backed earnings” safety check that always belongs next to an Incremental-RoIC calculation. A company can manufacture a high incremental ratio on paper by capitalising costs, stretching receivables or under-providing for inventory obsolescence — but those tricks always show up as a CFO/OP ratio that drifts well below 100%. When operating cash exceeds operating profit, as it does here in FY25, every rupee of incremental NOPAT being plugged into the numerator of Incremental RoIC has already been independently corroborated by the cash flow statement. The CWIP of ~₹11 Cr also signals that the next leg of capital deployment is already underway; in three years that ₹11 Cr will move into Gross Block, depreciation will follow, and the ΔInvested-Capital denominator for an FY28-vs-FY25 incremental analysis will already be partly visible to today’s reader. This is an educational illustration of what disciplined fundamentals look like and is not a buy/sell recommendation on any stock.
How Retail Investors Should Actually Use This Metric
The temptation, once you learn Incremental RoIC, is to rank every stock in your watchlist by the headline incremental number and act on the top quartile. Resist that temptation. The metric is most useful as a filter, not a ranker, because the denominator (ΔInvested Capital) is highly sensitive to cycle timing.
Use it in four ways. First, as a moat-test confirmation: when you believe a company has a durable competitive advantage, the empirical proof is that Incremental RoIC stays well above cost of capital across two consecutive 3-year windows. One window is luck; two windows is a pattern. Second, as a growth-quality check when a company guides aggressive capex: compute the implied Incremental RoIC the announced capex would need to deliver to justify the headline RoCE. If the required ratio is north of 25%, get suspicious. Third, as a relative-discipline lens across peers in the same sector. Two specialty chemicals firms with identical headline RoCE can show wildly different Incremental RoIC — and the difference is the entire investment thesis. Fourth, as a capital-allocation test after a large acquisition. If the headline RoIC barely moved but Incremental RoIC collapsed, the acquisition is empirically value-destructive even if the deck called it “accretive in year one”.
Common Traps and Misinterpretations
Trap 1 — Reading a single year as a signal. A company that just commissioned a ₹500 Cr plant will show an Incremental RoIC of close to zero in the year the plant first appears in Gross Block but produces only half a year of NOPAT. This is a denominator artefact, not a business failure. Always smooth across at least three years.
Trap 2 — Ignoring cash on the balance sheet. An Indian IT services firm sitting on ₹15,000 Cr of cash will look like it has a low headline RoIC if you do not subtract cash from invested capital — and the Incremental RoIC will be similarly muddled. Always strip cash and equivalents from the invested capital figure in both years.
Trap 3 — Goodwill accounting after an acquisition. Indian Ind-AS rules add the acquired entity’s goodwill to consolidated invested capital. If the acquired entity itself was a high-return business, you can get a perverse outcome where the post-acquisition Incremental RoIC looks worse simply because of the goodwill mark-up — even though the operating business is performing well. Mauboussin recommends computing Incremental RoIC both with and without goodwill to isolate the operating effect.
Trap 4 — Using EBIT instead of NOPAT. Skipping the tax adjustment systematically overstates the ratio for companies in higher-tax states (older Indian PSUs at 30%+) and understates it for companies enjoying R&D weighted deductions or 80-IA holidays. Always tax-effect the operating profit.
Trap 5 — Comparing across capital structures. A company that just did a buyback shrinks its equity base mechanically, which can cause Incremental RoIC to spike for accounting reasons unrelated to operating quality. Re-add the buyback amount to the closing equity for a clean comparison.
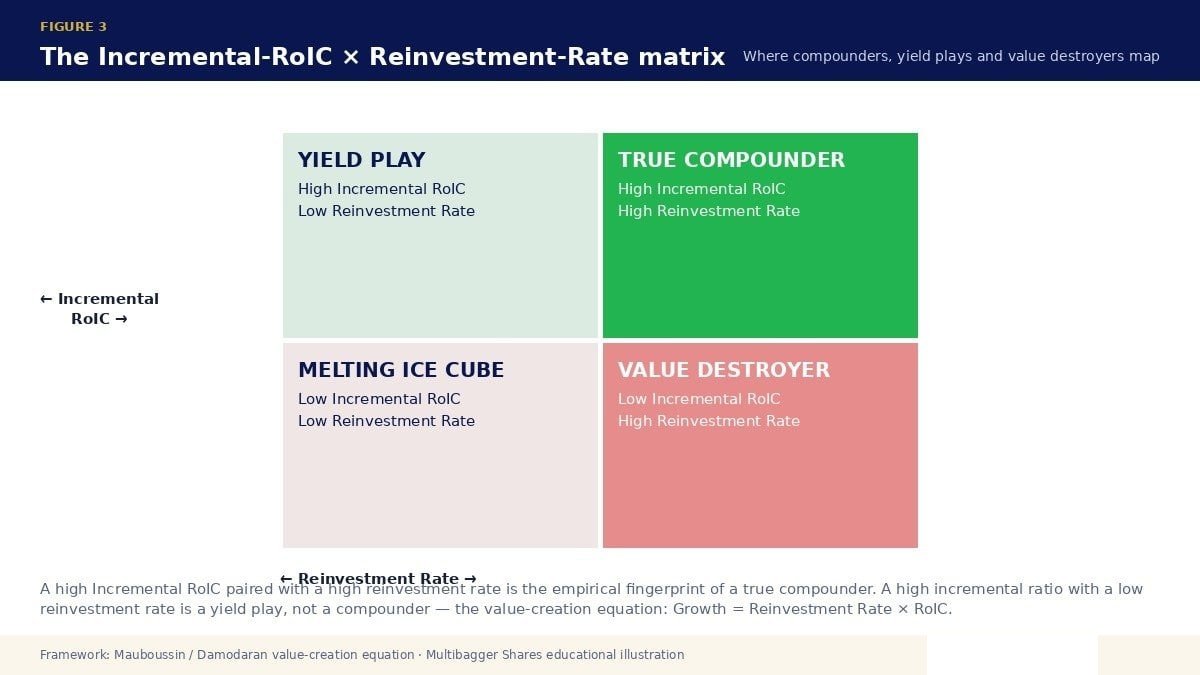
Trap 6 — Confusing Incremental RoIC with the Reinvestment Rate. The two together form the “value-creation equation” popularised by Damodaran: Growth = Reinvestment Rate × RoIC. Incremental RoIC tells you the quality of each new rupee; the reinvestment rate tells you the quantity of rupees the business chooses to reinvest. A high-Incremental-RoIC company that returns 90% of earnings as dividends is not a compounder — it is a yield play. A moderate-Incremental-RoIC company that reinvests 80% of earnings can still compound book value handsomely.
Key Takeaways
- The headline RoIC is a stock; Incremental RoIC is a flow. The headline ratio describes the historical compound of all past capital. Incremental RoIC describes the productivity of the most recent rupees management deployed — and is therefore the better forward-looking quality signal for any long-term Indian equity investor.
- Always benchmark against cost of capital, not against peers. An Incremental RoIC of 18% beats a peer’s 14% — but if the cost of capital is 22%, both companies are destroying value. The peer comparison is a sideshow; the absolute comparison against cost of capital is the only one that decides whether shareholder wealth is being created.
- Pair Incremental RoIC with the cash-flow safety check. The single most actionable corroboration is the CFO / Operating Profit ratio, which Titan Biotech’s FY25 audited filings disclose at 103% — cash generation slightly exceeding operating profit. When this ratio sits comfortably above 80–90% across multiple years, the Incremental-RoIC numerator can be trusted; when it persistently sits below 70%, treat the headline ratio with structured suspicion regardless of how attractive the arithmetic looks.
- Use 3-year and 5-year windows, never year-on-year. Capex lumpiness, working-capital seasonality, and one-time tax adjustments will make annual Incremental-RoIC swing wildly. Smoothing across at least three years filters out the noise, and a five-year window adds a full mini-cycle of context. Anything shorter is forensic theatre, not forensic analysis.
SEBI Disclaimer
Disclaimer: This article is for educational and informational purposes only. It is not investment advice, and not a buy, sell, or hold recommendation on any stock mentioned, including Titan Biotech Limited. Equity markets carry risk; please do your own research or consult a qualified professional before making investment decisions.
