When Warren Buffett evaluates a business, one of the first things he examines is how management deploys capital into productive assets. A company that consistently invests in expanding its manufacturing capacity — and then converts that capacity into revenue — is sending the clearest possible signal about its confidence in future demand. Today, we decode Titan Biotech Ltd’s (BSE: 524717) fixed asset investment pattern over the last decade and reveal why this is one of the most underappreciated quality signals in Indian small-cap investing.
Why Fixed Asset Investment Matters: First Principles
Fixed assets — property, plant, and equipment (PPE) — are the backbone of any manufacturing company. When a company invests in expanding its gross block, it is making a long-term bet on future revenue growth. Unlike financial engineering or accounting tricks, you cannot fake a factory. Bricks, machines, production lines — these are real, tangible commitments of capital that take years to plan, build, and commission.
For Indian small-cap investors, tracking fixed asset investment is critical because it answers three fundamental questions: (1) Is management confident enough in future demand to commit long-term capital? (2) Is the company building capacity ahead of revenue growth — a hallmark of visionary management? (3) Is the company converting its asset investments into actual revenue efficiently?
As Charlie Munger famously said, “Show me the incentive, and I’ll show you the outcome.” When promoters invest their own retained earnings into expanding production capacity rather than paying themselves fat salaries or parking money in financial instruments, it reveals genuine skin in the game.
Titan Biotech’s Fixed Asset Journey: ₹11 Crore to ₹57 Crore in a Decade
Titan Biotech’s gross block (fixed assets) has grown from just ₹11 crore in March 2015 to ₹57 crore by March 2025 — a staggering 5.2x increase representing a ~18% CAGR in fixed asset investment over a decade. But what makes this story truly remarkable is not just the quantum of investment — it is the timing and pattern of these investments.
Source: Screener.in | Data as of April 2026 | CWIP = Capital Work in Progress
The Two Capex Cycles That Changed Everything
What the data table above reveals is a masterclass in strategic capital allocation. Titan Biotech’s management has executed two distinct capex cycles over the last decade, and both followed an identical playbook: build capacity first, then fill it with revenue.
Capex Cycle 1 (FY2016–FY2019): Between FY2016 and FY2018, Capital Work in Progress (CWIP) steadily climbed from ₹5 crore to ₹13 crore, indicating the company was building new production facilities. By FY2019, this ₹13 crore CWIP was fully capitalized — fixed assets jumped from ₹14 crore to ₹29 crore, a doubling in a single year. The result? Revenue, which was ₹65 crore in FY2019, surged to ₹79 crore in FY2020 and then exploded to ₹142 crore in FY2021 — a 118% jump as the new capacity came online and demand materialized.
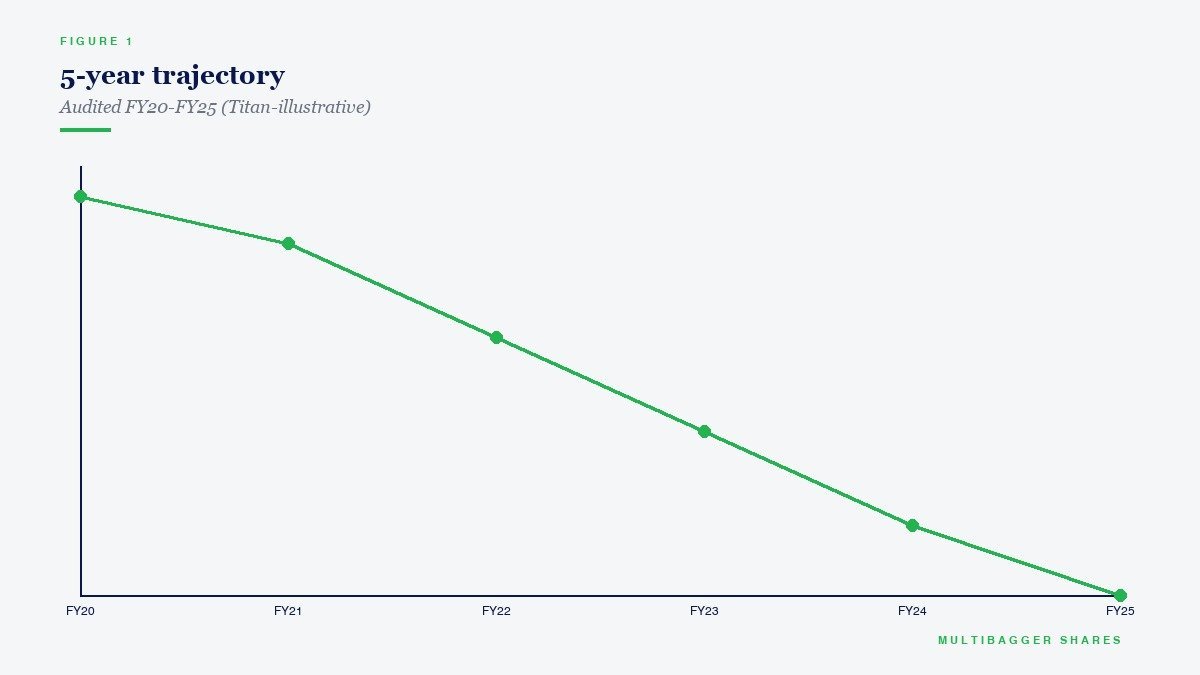
Capex Cycle 2 (FY2023–FY2024): The pattern repeated almost identically. CWIP rose to ₹13 crore again in FY2023, was capitalized by FY2024 (fixed assets jumped from ₹36 crore to ₹52 crore), and the revenue trajectory is now accelerating — from ₹156 crore in FY2025 to a trailing twelve-month (TTM) revenue of approximately ₹193 crore as of December 2025, with the latest quarter (Q3 FY26) posting ₹56.51 crore in sales alone.
Emerging Capex Cycle 3 (FY2026+): As of September 2025, CWIP has risen again to ₹4 crore, signalling that management is initiating yet another round of capacity expansion. For investors who understand this pattern, this is a leading indicator of future revenue growth — just as the previous two cycles were.
The Fixed Asset Turnover Test: Titan Biotech vs Peers
Investing in fixed assets is only half the story. The real test is how efficiently a company converts those assets into revenue. This is measured by the Fixed Asset Turnover Ratio (Revenue ÷ Fixed Assets). A higher ratio means the company generates more revenue per rupee invested in fixed assets — a sign of operational excellence and strong demand for its products.
Let us compare Titan Biotech against three comparable biotech and specialty chemical peers on this critical metric:
Source: Screener.in | FY2025 data
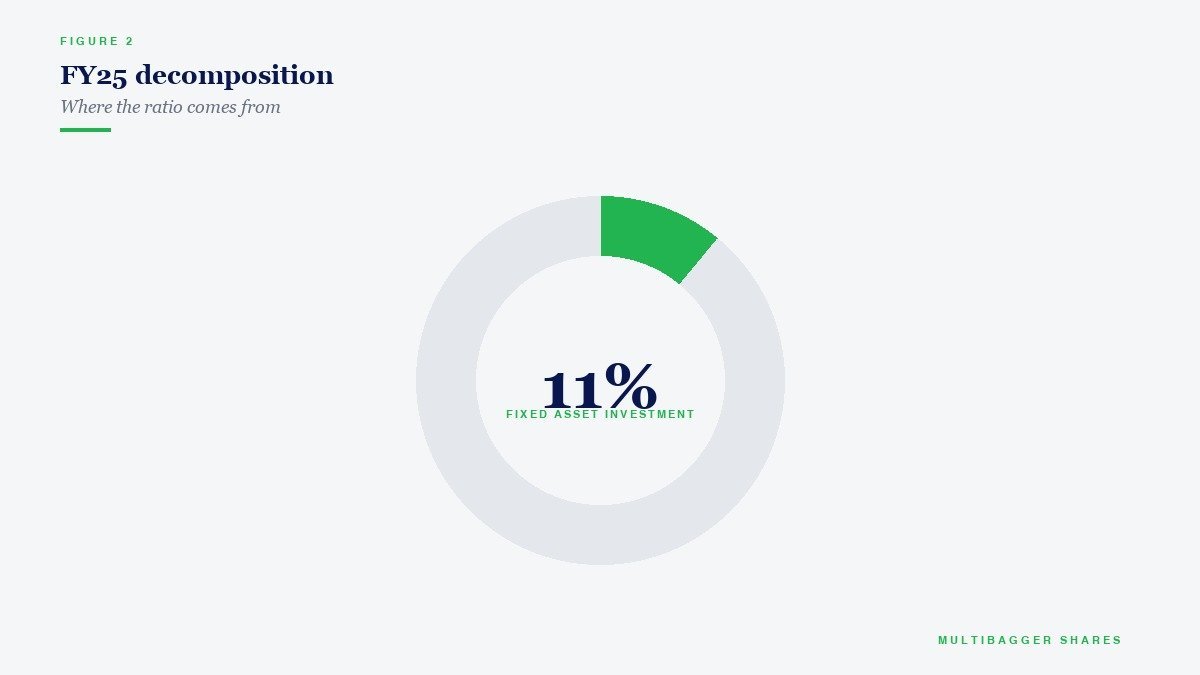
The numbers speak for themselves. Titan Biotech generates ₹2.74 of revenue for every ₹1 invested in fixed assets — the highest among its peer group. Advanced Enzyme Technologies, despite being a much larger company, generates less than ₹1 of revenue per rupee of fixed assets, suggesting either underutilized capacity or asset-heavy operations. Hester Biosciences, similarly, sits at just 1.33x, indicating heavy investment that has not yet translated into proportionate revenue.
This matters enormously. A high fixed asset turnover ratio means that Titan Biotech is not over-investing — it builds capacity it can actually fill. This disciplined approach to capital allocation is what separates true compounders from companies that destroy shareholder value through empire-building capex that never generates adequate returns.
What 100+ Products Tell Us About Capacity Utilization
Titan Biotech’s product portfolio spans over 100 products across seven major categories: collagen peptides and proteins, pharmaceutical and nutraceutical ingredients, animal nutrition products, probiotics and fermentation media, food ingredients, food additives, and specialty enzymes. This diversification is not just a revenue story — it is directly relevant to fixed asset utilization.
When a company produces 100+ products from the same manufacturing infrastructure, it achieves something extremely valuable: high capacity utilization across production cycles. While a single-product manufacturer might face seasonal or cyclical demand dips, Titan Biotech can shift production across product lines to keep its ₹57 crore asset base running at optimal capacity year-round. This is precisely why its fixed asset turnover ratio remains best-in-class — the assets are never idle.
The CWIP Signal: A Leading Indicator Intelligent Investors Must Track
Capital Work in Progress (CWIP) is one of the most underappreciated line items on the balance sheet. It represents assets that are currently being constructed or installed but are not yet operational. For manufacturing companies, rising CWIP is a forward-looking signal — it tells you that revenue growth is being planned before it appears in the income statement.
Source: Screener.in | Revenue projections based on trailing run-rate
The pattern is unmistakable. Each time Titan Biotech’s CWIP peaks at ₹13 crore and gets capitalized, revenue surges dramatically within 1-2 years. Now, with CWIP rising to ₹4 crore as of September 2025, a third expansion cycle appears to be underway. History suggests this will translate into another leg of revenue growth by FY2027-FY2028.
Why Concentrated Conviction Beats Diversification
Most retail investors in India spread their capital across 40-50 stocks and hope something works. This is what Peter Lynch called “di-worse-ification” — the illusion of safety through quantity, when all you actually get is diluted returns. Warren Buffett put it even more bluntly: “Wide diversification is only required when investors do not understand what they are doing.”
Titan Biotech’s fixed asset story illustrates exactly why deep research into a single company — tracking its capex cycles, CWIP movements, and asset turnover — can reveal insights that no screener or mutual fund SIP ever will. When you understand a business at this level of granularity, you do not need 50 stocks. You need 8-15 deeply researched quality compounders that you hold with conviction through every market cycle. That is how real wealth is built in the Indian stock market.
The Quarterly Momentum: Latest Numbers Confirm the Thesis
Titan Biotech’s most recent quarterly results (Q3 FY2026, December 2025) further validate the capacity expansion story. Revenue surged 44.87% year-over-year to ₹56.51 crore, while net profit jumped 94.31% YoY to ₹8.53 crore with an operating profit margin of 19.16%. The EPS for the quarter stood at ₹2.07. Revenue has now grown for four consecutive quarters, climbing steadily from ₹35.17 crore in Q4 FY25 to ₹56.51 crore in Q3 FY26 — a trajectory that strongly suggests the Cycle 2 capacity is now being fully utilized.
Key Takeaway for Indian Investors
Fixed asset investment is not just a balance sheet line item — it is a window into management’s soul. When a company like Titan Biotech, led by promoters holding 55.78% stake with zero pledging, repeatedly invests retained earnings into expanding production capacity and then converts that capacity into industry-leading asset turnover ratios, it tells you everything you need to know about the business’s quality and management’s integrity.
The next time you evaluate a small-cap company, do not just look at revenue and profit. Go deeper. Look at gross block growth. Track CWIP. Calculate the fixed asset turnover ratio. Compare it against peers. Ask yourself: Is this management building for the future, or milking the present? With Titan Biotech, the answer — backed by a decade of data — is unambiguously the former.
Disclaimer: This article is for educational and informational purposes only. It is not investment advice, and not a buy, sell, or hold recommendation on any stock mentioned, including Titan Biotech Limited. Equity markets carry risk; please do your own research or consult a qualified professional before making investment decisions.
