April 9, 2026
(Wednesday)
Why Forensic Accounting Is the Most Important Skill You’ve Never Learned
In the Indian stock market, where over 5,000 listed companies compete for your investment rupees, the ability to read financial statements is not enough. You must learn to read between the lines — because the most dangerous companies are not the ones that show bad numbers. They are the ones that show artificially good numbers.
According to estimates, at least 1,200 companies listed on Indian stock exchanges have counterfeited their financial statements at some point — including 20-25 firms from benchmark indices like SENSEX and NIFTY. Today, with SENSEX at approximately 76,850 (down ~700 points) and NIFTY 50 at 23,764 (down ~233 points on April 9, 2026), many retail investors are focused on price movements and missing something far more critical: whether the earnings they’re paying for are even real.
This is where forensic accounting comes in — the science of detecting financial fraud, earnings manipulation, and accounting trickery before the market discovers it and crashes the stock 50-80% in a single day.
Think of Satyam (2009), DHFL (2019), Manpasand Beverages (2019), or more recently several small-cap companies that were flagged for round-tripping revenue. In every case, the warning signs were present in the financial statements years before the fraud was exposed. Investors who knew forensic accounting red flags could have exited early. Those who didn’t lost everything.
The Beneish M-Score: Your Mathematical Fraud Detector
In 1999, Professor Messod Beneish at Indiana University developed a statistical model that correctly identifies 76% of earnings manipulators with only a 17.5% false-positive rate. This model — called the Beneish M-Score — uses 8 financial variables that capture the most common patterns of earnings manipulation.
The complete formula is:
M-Score = -4.84 + 0.92×DSRI + 0.528×GMI + 0.404×AQI + 0.892×SGI + 0.115×DEPI – 0.172×SGAI + 4.679×TATA – 0.327×LVGI
Interpretation:
- M-Score below -2.22 → Company is likely NOT manipulating earnings (safe zone)
- M-Score between -2.22 and -1.78 → Grey zone — investigate further
- M-Score above -1.78 → High probability of earnings manipulation (danger zone)
Let’s break down each variable so you can calculate this yourself for any Indian company:
The 8 Variables of the Beneish M-Score — Decoded for Indian Investors
1. DSRI — Days’ Sales in Receivables Index
Formula: (Receivables_t / Revenue_t) ÷ (Receivables_t-1 / Revenue_t-1)
This measures whether receivables are growing faster than revenue. A DSRI significantly above 1.0 means the company is booking revenue that hasn’t been collected — a classic sign of fictitious sales. In Indian small-caps, this is the #1 red flag. When a company reports 30% revenue growth but receivables have jumped 60%, ask yourself: are these real customers paying real money, or is the company stuffing channels and booking phantom revenue?
Red flag threshold: DSRI above 1.465
2. GMI — Gross Margin Index
Formula: Gross Margin_t-1 ÷ Gross Margin_t
A GMI above 1.0 means gross margins are declining — the company’s core profitability is deteriorating. Companies under margin pressure have stronger incentives to manipulate earnings to hide the decline. When margins shrink, management may capitalise expenses, defer write-offs, or engage in aggressive revenue recognition to maintain the appearance of profitability.
Red flag threshold: GMI above 1.193
3. AQI — Asset Quality Index
Formula: [1 – (Current Assets_t + PP&E_t) / Total Assets_t] ÷ [1 – (Current Assets_t-1 + PP&E_t-1) / Total Assets_t-1]
A rising AQI means a growing proportion of assets are neither current assets nor fixed assets — they’re intangible, deferred, or capitalised costs. This is how companies hide expenses by converting them into assets on the balance sheet. In India, watch for sudden increases in “Intangible Assets Under Development,” “Capital Work in Progress (CWIP),” or “Deferred Tax Assets.” These categories are favourite hiding spots for manipulators.
Red flag threshold: AQI above 1.254
4. SGI — Sales Growth Index
Formula: Revenue_t ÷ Revenue_t-1
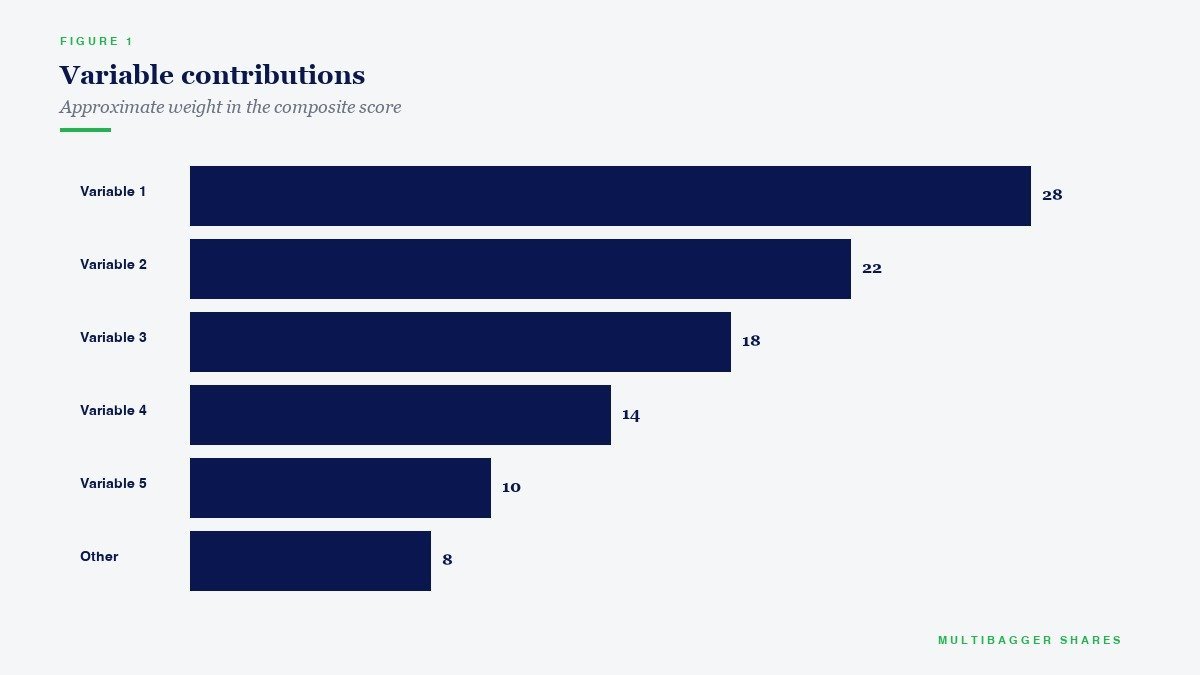
High growth companies face intense pressure to maintain their growth narrative. An SGI above 1.607 doesn’t mean the company is manipulating — but it means the incentive to manipulate is high. When analysts expect 40% growth and the company is tracking at 25%, the temptation to book future revenue early or engage in channel stuffing becomes overwhelming. Always apply extra scrutiny to companies with extremely high revenue growth.
Red flag threshold: SGI above 1.607
5. DEPI — Depreciation Index
Formula: Depreciation Rate_t-1 ÷ Depreciation Rate_t
A DEPI above 1.0 means the company is depreciating assets more slowly than before — artificially boosting profits by spreading costs over a longer period. In India, watch for sudden changes in depreciation policy disclosed in the Notes to Accounts. If a company changes the useful life of plant and machinery from 10 years to 15 years, that single accounting change can boost reported profits by 15-25% with zero improvement in actual business performance.
Red flag threshold: DEPI above 1.077
6. SGAI — SGA Expense Index
Formula: (SGA_t / Revenue_t) ÷ (SGA_t-1 / Revenue_t-1)
An SGAI above 1.0 means selling, general and administrative expenses are rising as a percentage of revenue — suggesting declining efficiency. The coefficient for SGAI in the M-Score is actually negative (-0.172), meaning rising SGA expenses slightly reduce the M-Score. This is because companies that are manipulating often show artificially low SGA ratios since they may be capitalising operating expenses.
Context: Low or declining SGAI can actually be suspicious if combined with high AQI
7. TATA — Total Accruals to Total Assets
Formula: (Net Income – Cash Flow from Operations) ÷ Total Assets
This is the single most important variable in the entire model — its coefficient of 4.679 is by far the highest. TATA measures the gap between reported profits and actual cash generated. A high positive TATA means the company is reporting profits that are not supported by cash flows. This is the ultimate forensic test: if a company says it earned ₹100 crore but only generated ₹30 crore in operating cash flow, where did the other ₹70 crore go?
Red flag threshold: TATA above 0.018 (even small positive values are concerning)
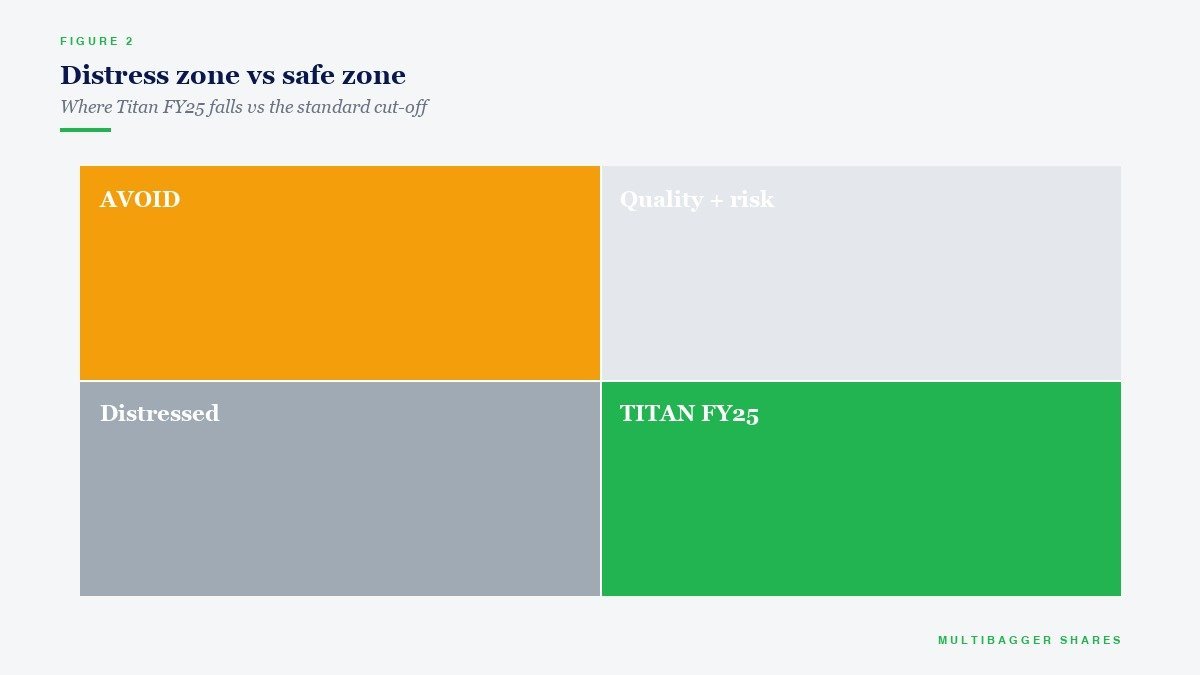
This is precisely why, when we analyse companies like Titan Biotech (BSE: 524717, CMP: ₹454, Market Cap: ₹1,877 Cr), we always verify that operating cash flows validate reported profits. Titan Biotech’s cash flow quality has been strong — operating cash flows have consistently supported reported net income, which is exactly what you want to see. A company with ROCE of 16.9% and ROE of 15.0% where cash flows match earnings is a fundamentally clean business.
8. LVGI — Leverage Index
Formula: Total Debt_t / Total Assets_t ÷ Total Debt_t-1 / Total Assets_t-1
Rising leverage creates pressure to manipulate. Companies taking on debt need to show strong earnings to justify the borrowing. An LVGI above 1.0 combined with a high M-Score is a particularly dangerous combination. In the Indian context, companies that have rapidly increased debt while simultaneously showing strong profit growth deserve extra forensic scrutiny.
Red flag threshold: LVGI above 1.111
Beyond the M-Score: 8 Practical Red Flags Every Indian Investor Must Watch
While the Beneish M-Score is a powerful quantitative tool, experienced forensic analysts also watch for these qualitative warning signs:
Red Flag #1: Cash Flow Divergence from Profits
If a company reports growing profits for 3+ years but operating cash flows are flat or declining, something is wrong. This is the simplest and most reliable forensic test. Real profits generate real cash. Period. Calculate the Cash Flow to Net Income ratio — it should be above 0.8 for a healthy company. Below 0.5 for multiple years is a major red flag.
Red Flag #2: Receivables Growing Faster Than Revenue
Track the Debtor Days ratio (Trade Receivables ÷ Revenue × 365) across 5 years. If debtor days are steadily increasing — say from 45 days to 60 days to 90 days — the company may be booking revenue from customers who aren’t actually paying. In Indian small-caps, this is the most common form of revenue manipulation.
Red Flag #3: Frequent Changes in Accounting Policies
Check the Notes to Accounts in every annual report. If a company changes its revenue recognition policy, depreciation method, inventory valuation method, or expense capitalisation policy more than once in 3 years, that’s a red flag. Each change should be scrutinised for its impact on reported profits. Honest companies rarely change accounting policies.
Red Flag #4: Related Party Transactions (RPTs) Exceeding 10% of Revenue
Related party transactions are legitimate in many cases, but when they exceed 10% of total revenue, you must investigate. Is the company selling goods to a promoter-linked entity? Is it lending money to sister concerns at below-market rates? In India, related party transactions have been at the heart of major frauds — from Satyam to more recent cases. Always check the RPT disclosure in the annual report.
Red Flag #5: Ballooning “Other Income”
If a manufacturing or services company suddenly shows “Other Income” jumping from 2% of revenue to 10-15% of revenue, investigate what’s in it. Sometimes companies sell investments, revalue assets, or book one-time gains to pad their profit numbers. Sustainable businesses generate profits from their core operations, not from financial engineering in the “Other Income” line.
Red Flag #6: Auditor Resignation or Qualification
When a statutory auditor resigns mid-term (not at the end of their rotation), that’s one of the strongest red flags in corporate governance. Auditors rarely resign from profitable engagements unless they’ve discovered something they cannot sign off on. Similarly, any “Qualified Opinion” or “Emphasis of Matter” paragraph in the audit report deserves careful reading. In India, SEBI now requires companies to disclose reasons for auditor changes — always read this disclosure.
Red Flag #7: Inventory Build-Up Without Corresponding Revenue Growth
Track the Inventory Days ratio (Inventory ÷ COGS × 365). If inventory days are increasing while revenue growth is stagnating, the company may be: (a) overstating inventory to reduce reported COGS and inflate gross margins, or (b) simply losing demand and unable to sell its products. Either scenario is negative for investors.
Red Flag #8: Promoter Pledge + Rising Debt + Aggressive Accounting = Triple Danger
When you see all three of these together — promoters pledging their shares, the company taking on more debt, and aggressive accounting choices — run. This is the classic pre-fraud pattern in Indian markets. The promoter is leveraged personally, the company is leveraged financially, and the books are being dressed up to maintain the facade. When this house of cards collapses, the stock typically falls 70-90%.
How to Apply Forensic Accounting in Your Investment Process
Here’s a practical 5-step forensic screening process you can apply to any Indian stock:
Step 1: Calculate the Beneish M-Score using the annual report data. If M-Score is above -1.78, reject the stock outright.
Step 2: Check the Cash Flow to Net Income ratio for the last 5 years. If it’s below 0.6 on average, investigate further.
Step 3: Compare Receivables growth vs Revenue growth for 5 years. If receivables consistently outpace revenue, it’s a warning sign.
Step 4: Read the Notes to Accounts for any changes in accounting policies, unusual related party transactions, or auditor qualifications.
Step 5: Cross-check with promoter pledging data and debt trends. If all signals are green, proceed with your fundamental analysis.
This is why concentrated investing in deeply researched stocks is so much more powerful than blind diversification. As Warren Buffett wisely said: “Wide diversification is only required when investors do not understand what they are doing.” When you apply forensic accounting to your research process, you understand each business at a level that makes diversification across 50 stocks unnecessary. Your 5-10 deeply researched, forensically verified conviction picks will always outperform a basket of 50 stocks where you haven’t done this level of homework.
Titan Biotech: A Clean Bill of Forensic Health
Let’s apply our forensic framework to Titan Biotech (BSE: 524717), currently trading at ₹454 with a market capitalisation of ₹1,877 crore:
- Cash Flow Quality: Operating cash flows have consistently validated reported profits — TATA ratio is healthy
- Receivables: Debtor days have remained stable, not ballooning — revenue growth is backed by actual collections
- Accounting Policies: No frequent changes in accounting policies or depreciation methods
- Related Party Transactions: RPTs are within reasonable limits and fully disclosed
- Auditor: No auditor resignations or qualified opinions
- Promoter Pledging: Zero promoter pledge — the cleanest possible governance signal
- Debt: Near-zero debt with a D/E ratio of just 0.02x — no leverage pressure to manipulate
- ROCE of 16.9% and ROE of 15.0% — genuine returns on capital, supported by real cash generation
This is what a forensically clean company looks like. Every rupee of reported profit is backed by cash. No pledging, no debt pressure, no accounting tricks. This is the quality of business you should concentrate your capital in.
The SEBI F&O Warning — Don’t Gamble, Investigate
According to SEBI’s landmark study, 9 out of 10 individual traders in the equity Futures & Options segment incurred net losses. The majority of these traders never perform any forensic analysis — they gamble on momentum, tips, and chart patterns without understanding whether the underlying earnings are even real.
Instead of gambling in F&O, invest your time in learning forensic accounting. One hour spent calculating the Beneish M-Score for a stock can save you from a 90% loss. One hour reading the Notes to Accounts can reveal what the glossy annual report is trying to hide. This is how real wealth is built — through deep, forensic-level research into a concentrated portfolio of your best ideas.
Learn these skills systematically in our free Value Investing Course: Watch the Complete Course on YouTube
📢 Join Our Telegram Channel
Get daily value investing lessons, stock analysis & Titan Biotech updates — delivered straight to your phone!
✈️ Join @longtermequityy on Telegram
🔔 Free • No spam • Value investing insights daily
Disclaimer: This article is for educational and informational purposes only. It is not investment advice, and not a buy, sell, or hold recommendation on any stock mentioned, including Titan Biotech Limited. Equity markets carry risk; please do your own research or consult a qualified professional before making investment decisions.
