Behind every great company, there are great people. Yet most investors spend hours analysing revenue growth, profit margins, and return ratios — but never once look at how productively a company deploys its most valuable resource: its workforce.
Employee productivity metrics — revenue per employee, profit per employee, and employee cost as a percentage of revenue — reveal whether a company is building a lean, efficient operation or a bloated bureaucracy that will eventually erode shareholder value. In small-cap investing, where management quality is everything, these metrics are powerful indicators of operational excellence.
In this deep-dive, we analyse 12 years of Titan Biotech’s workforce data to understand how a company with just 467 employees generates ₹156 Cr in annual revenue — and what this tells us about the quality of its business model.
Why Employee Productivity Matters in Fundamental Analysis
Consider two companies, each generating ₹150 Cr in revenue. Company A does it with 200 employees (₹75 Lakh per employee). Company B needs 2,000 employees (₹7.5 Lakh per employee). Which one has a superior business model? Company A — because it can scale revenue without proportionally scaling headcount, creating powerful operating leverage that flows straight to the bottom line.
High employee productivity also signals several underlying strengths: superior technology and automation, effective training systems, strong management processes, and a culture that values output over headcount. Companies that generate more revenue per person typically have wider margins, better cash flows, and more sustainable competitive advantages.
As Peter Lynch famously cautioned, diversification is “di-worse-ification.” The same applies to hiring — companies that hire excessively without proportional revenue growth are di-worse-ifying their workforce efficiency. Smart investors look for companies that do more with less.
Titan Biotech’s 12-Year Workforce Efficiency Trajectory
Let us examine how Titan Biotech’s employee count, revenue, and profitability have evolved together over the past 12 years — and what the per-employee metrics reveal.
This table reveals a fascinating story of workforce transformation. Titan Biotech underwent a significant restructuring between FY2015 and FY2016, when the permanent employee count dropped sharply from 380 to 148. What followed was remarkable — the company increased revenue from ₹40 Cr to ₹46 Cr with 61% fewer employees, tripling the revenue per employee from ₹10.5 Lakh to ₹31.1 Lakh almost overnight.
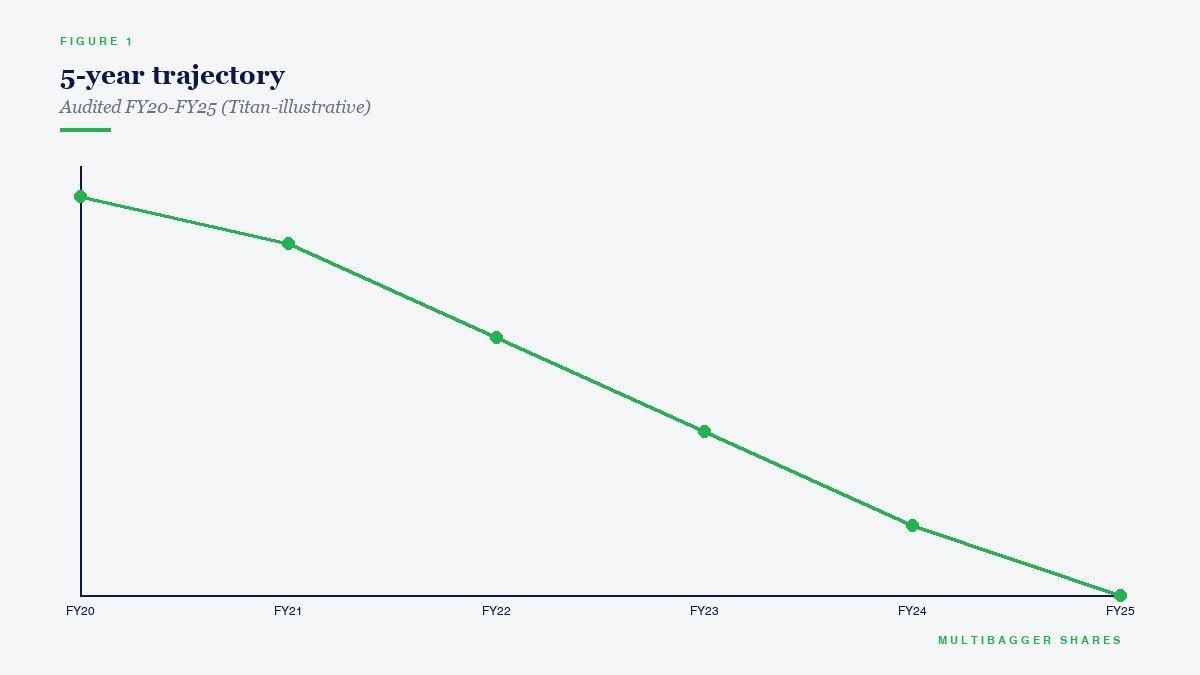
The Three Phases of Workforce Evolution
Phase 1 — The Lean Machine (FY2016-FY2018): With just 148-155 employees, Titan Biotech operated at extraordinary efficiency. Revenue per employee peaked at ₹36.1 Lakh in FY2018 as the streamlined team drove revenue from ₹46 Cr to ₹56 Cr. This was the “do more with less” era — proof that the company’s core processes and technology were strong enough to support meaningful revenue with a small team.
Phase 2 — Scaling for Growth (FY2019-FY2021): As the first major Capex cycle completed and new capacity came online, the company began ramping up hiring — from 155 to 262 employees. But here is the key: revenue scaled even faster. Revenue per employee surged to a peak of ₹46.6 Lakh in FY2021 — the highest in the company’s history — as the expanded capacity and enlarged workforce combined to produce ₹122 Cr in revenue and a stunning ₹29 Cr in net profit. At ₹11.1 Lakh profit per employee, this was an extraordinary year of workforce productivity.
Phase 3 — Building for the Future (FY2022-FY2025): The company expanded rapidly from 262 to 467 employees — a 78% increase over four years — as the third manufacturing plant came online. Revenue per employee normalised to ₹33-36 Lakh range as the expanded workforce and new capacity take time to ramp up to full utilisation. This temporary dip in per-employee productivity is expected and healthy — it mirrors exactly what happened in FY2019 when new hires preceded the revenue explosion of FY2021.
Revenue Growth vs Employee Growth: The Scalability Test
The ultimate test of a scalable business model is whether revenue grows faster than headcount over long periods. If a company must hire one new person for every ₹10 Lakh of additional revenue, it has poor scalability. If it can add ₹50 Lakh of revenue per new hire, it has excellent operating leverage.
The long-term picture is extraordinary. Over 11 years, Titan Biotech grew revenue by 300% and profit by 1,700% with only a 21% increase in employee count. This is the definition of a scalable business model — one that can multiply output without proportionally multiplying inputs.
The FY2021-FY2025 period shows employee growth temporarily outpacing revenue growth (78% vs 28%), but this is a forward-investment phase. The company added 205 employees to staff its new third manufacturing plant — capacity that is still ramping up. With TTM revenue already at ₹193 Cr (vs FY2025’s ₹156 Cr), the revenue catch-up is already underway.
Peer Comparison: Workforce Efficiency Benchmarking
To put Titan Biotech’s workforce efficiency in perspective, let us compare its revenue per employee against the broader specialty chemicals industry.
Titan Biotech’s Operating Profit Margin of 17.4% comfortably exceeds both Deepak Nitrite (11.6%) and the industry median (12.9%), suggesting that its leaner workforce and operational efficiency translate directly into superior profitability. Its ROA of 11.5% — significantly above the industry median of 7.9% — further confirms that the company generates strong returns relative to its total asset base, including its workforce-related investments.
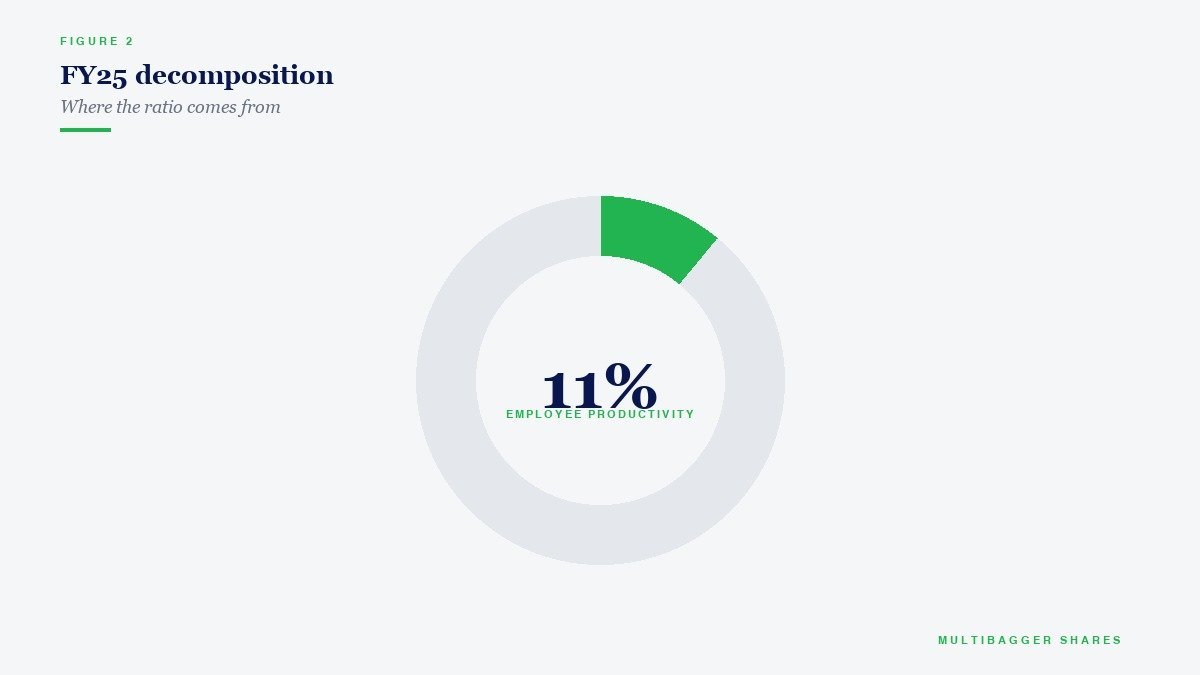
The Productivity-Growth Flywheel
What makes Titan Biotech’s workforce story truly compelling is the virtuous cycle it creates. High employee productivity generates strong profits. Strong profits fund capacity expansion without dilution or excessive debt. New capacity creates room for additional revenue. Additional revenue, spread over a slowly growing employee base, maintains high per-employee metrics. And the cycle repeats.
Here is the evidence: between FY2014 and FY2025, total employees grew by just 81 people (386→467), yet revenue grew by ₹117 Cr (₹39→₹156 Cr). That means each net new employee added generated approximately ₹1.44 Cr in incremental revenue. In the manufacturing sector, this level of incremental productivity is outstanding.
The company also invested in its workforce quality over time. The number of manufacturing plants grew from 2 to 3, electricity consumption per unit improved from 2.50 to 9.46 units/kg (reflecting higher-value-added products), and the workforce expanded from 155 at its leanest to 467 — all while maintaining revenue per employee above ₹33 Lakh.
What TTM Data Tells Us About the Next Leg
With trailing twelve-month revenue already at ₹193 Cr against a workforce of 467, the implied current revenue per employee is approximately ₹41.3 Lakh — a sharp recovery from FY2025’s ₹33.4 Lakh. This confirms that the third plant’s capacity is being absorbed, workforce utilisation is improving, and the company is heading back toward the ₹46+ Lakh peak efficiency levels seen in FY2021.
For investors who believe in concentrated portfolios of 8-15 deeply researched quality stocks — as Warren Buffett has always advocated — workforce efficiency is one of the strongest signals that a company has genuine operating leverage. A company that can multiply revenue 4x while barely growing headcount is a compound machine that rewards patient investors disproportionately.
Key Takeaways for Indian Investors
When analysing any small-cap or mid-cap company, look beyond the income statement and examine the workforce efficiency story. Calculate revenue per employee and track it over 5-10 years. A rising trend indicates the business is scaling efficiently. A declining trend — especially if headcount is growing faster than revenue — is a warning sign of potential margin compression ahead.
Pay special attention to periods where employee count increases sharply. If this coincides with Capex completion and new plant commissioning, the temporary dip in per-employee productivity is normal and will reverse as capacity ramps up. But if headcount is growing without corresponding capacity expansion, it may indicate management inefficiency or empire-building behaviour.
Titan Biotech’s workforce story is a masterclass in operational efficiency. A 300% revenue increase with just a 21% headcount increase over 11 years, revenue per employee consistently above ₹33 Lakh, and TTM productivity already recovering to ₹41+ Lakh — this is a lean, focused business that does more with less. For serious value investors, this is exactly the kind of operational DNA that creates long-term compounding machines.
Disclaimer: This article is for educational and informational purposes only. It is not investment advice, and not a buy, sell, or hold recommendation on any stock mentioned, including Titan Biotech Limited. Equity markets carry risk; please do your own research or consult a qualified professional before making investment decisions.
