There is a metric hiding in the Balance Sheet that most retail investors never bother to study — one that reveals whether a company’s management truly believes in its own future growth story or is merely milking existing assets without reinvesting. That metric is Capital Expenditure (Capex) and the patterns it creates over time.
When a company invests in new machinery, expands its factory, or builds an entirely new manufacturing plant, those expenditures show up in two critical Balance Sheet lines: Fixed Assets (Net Block) and Capital Work in Progress (CWIP). Together, they tell you the full story of management’s capital allocation confidence — where money is being deployed, when capacity is being expanded, and what it signals about future revenue potential.
In this deep-dive, we analyse 12 years of Titan Biotech’s Capex patterns — tracking how the company grew from 2 manufacturing plants to 3, expanded its Gross Block from ₹11 Cr to ₹57 Cr, and what the distinct investment cycles reveal about management’s growth conviction.
Why Capex Patterns Matter More Than You Think
Revenue growth can be manufactured through price hikes, accounting tricks, or one-time orders. But capital expenditure cannot be faked. When a management team decides to invest ₹15-20 Cr in building a new plant — knowing the payback period is 5-7 years — they are making a public statement of confidence in the company’s long-term demand trajectory. No rational management team spends crores on capacity expansion unless they see multi-year demand visibility.
Conversely, companies that stop investing in capacity are sending a bearish signal. They are essentially telling you: “We do not see enough future demand to justify new investment.” For small-cap investors hunting for the next compounder, studying Capex cycles is one of the most underrated analytical tools.
As Warren Buffett wisely stated: “Wide diversification is only required when investors do not understand what they are doing.” The same principle applies to capital allocation — focused, deliberate Capex in core areas of strength is far more valuable than scattered investments across unrelated businesses.
Titan Biotech’s 12-Year Fixed Asset & CWIP Trajectory
Let us examine the complete picture of Titan Biotech’s capital investment from FY2014 to the latest available data (Sep 2025), including Fixed Assets, CWIP, Total Assets, and the number of manufacturing plants.
This data reveals two distinct investment cycles that tell the complete story of Titan Biotech’s capacity expansion journey.
Capex Cycle 1 (FY2015–FY2019): Laying the Foundation
The first major investment cycle began in FY2015 when Capital Work in Progress (CWIP) jumped from ₹0 to ₹1 Cr, then steadily climbed to ₹5 Cr (FY2016), ₹9 Cr (FY2017), and peaked at ₹13 Cr in FY2018. This ₹13 Cr represented a massive commitment for a company with total assets of just ₹55 Cr — nearly 24% of the entire Balance Sheet was under construction.
By FY2019, the CWIP dropped to ₹0 and Fixed Assets jumped from ₹11 Cr to ₹26 Cr — confirming that all the capital work had been commissioned and was now operational. The company had essentially more than doubled its fixed asset base through this single multi-year investment cycle.
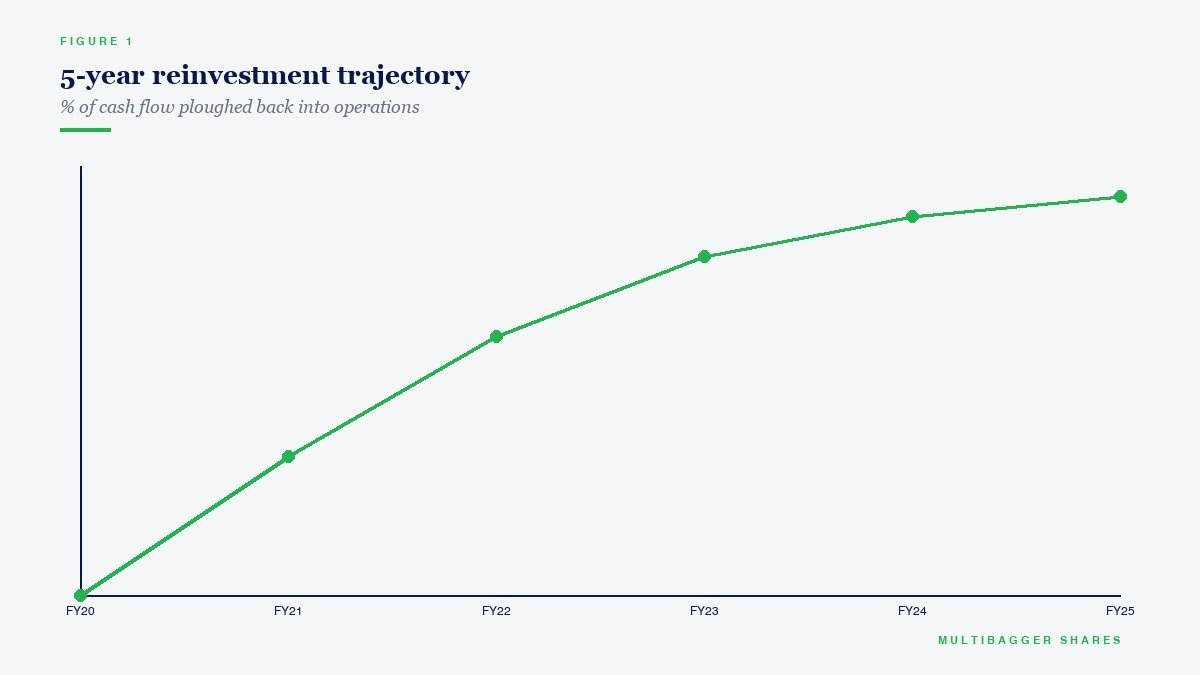
And here is the crucial point: during this entire 4-year investment period (FY2015-2018), revenue was growing slowly — from ₹40 Cr to just ₹56 Cr. The management was investing ahead of demand, building capacity that they believed the future would fill. This is the mark of a forward-thinking management team, not one that reacts to demand after it arrives.
The payoff came spectacularly. With expanded capacity fully operational by FY2019-2020, revenue exploded from ₹58 Cr to ₹122 Cr in FY2021 — a 110% surge in a single year. The first Capex cycle had created the capacity that caught the post-COVID demand wave perfectly.
Capex Cycle 2 (FY2022–FY2025): The Third Plant
Flushed with the success of the first cycle and generating unprecedented cash flows, management launched a second major investment cycle starting FY2022. CWIP reappeared at ₹4 Cr (FY2022) and surged to ₹13 Cr again in FY2023 — an exact mirror of the first cycle’s peak.
This time, the investment was even more ambitious: the company was building its third manufacturing plant. The data confirms this — the number of manufacturing plants increased from 2 (since inception) to 3 in FY2024.
By FY2024, CWIP dropped to ₹3 Cr and Fixed Assets jumped from ₹36 Cr to ₹52 Cr — a ₹16 Cr single-year increase indicating the new plant was largely commissioned. In FY2025, Fixed Assets reached ₹57 Cr with CWIP at ₹2 Cr, suggesting the second cycle is nearly complete.
The most recent data (Sep 2025) shows CWIP rising again to ₹4 Cr — hinting at the early stages of yet another expansion phase. This is a company that never stops investing in its future.
The CWIP-to-Revenue Conversion: Proof of Execution Excellence
One of the biggest risks in Capex analysis is that capital invested may never generate adequate returns — factories that run below capacity, machinery that sits idle, or projects that face indefinite delays. This is why tracking the CWIP-to-Fixed Asset conversion ratio is critical.
Both cycles show the same disciplined pattern: CWIP builds up over 3-4 years as the project progresses, then drops sharply as assets are commissioned, followed by a surge in revenue as new capacity is utilised. Crucially, there are no stranded assets, no abandoned projects, and no write-offs. Every rupee invested in CWIP eventually converted into productive fixed assets that generated revenue. This is execution excellence at its finest.
Fixed Asset Turnover: How Efficiently Is Capital Being Used?
Building new capacity is only half the story. The real question is: how efficiently is the company converting these assets into revenue? This is measured by the Fixed Asset Turnover (FAT) ratio — Sales divided by Net Fixed Assets.
Titan Biotech’s current FAT of 3.40x means that for every ₹1 Cr invested in fixed assets, the company generates ₹3.40 Cr in revenue — matching the industry median and significantly outperforming large-caps like Pidilite (2.46x) and Atul (2.19x). The slight decline from 4.35x three years ago is actually a positive signal — it reflects the new third plant that has been recently commissioned and is still ramping up utilisation. As this plant reaches full capacity, FAT will likely improve again.
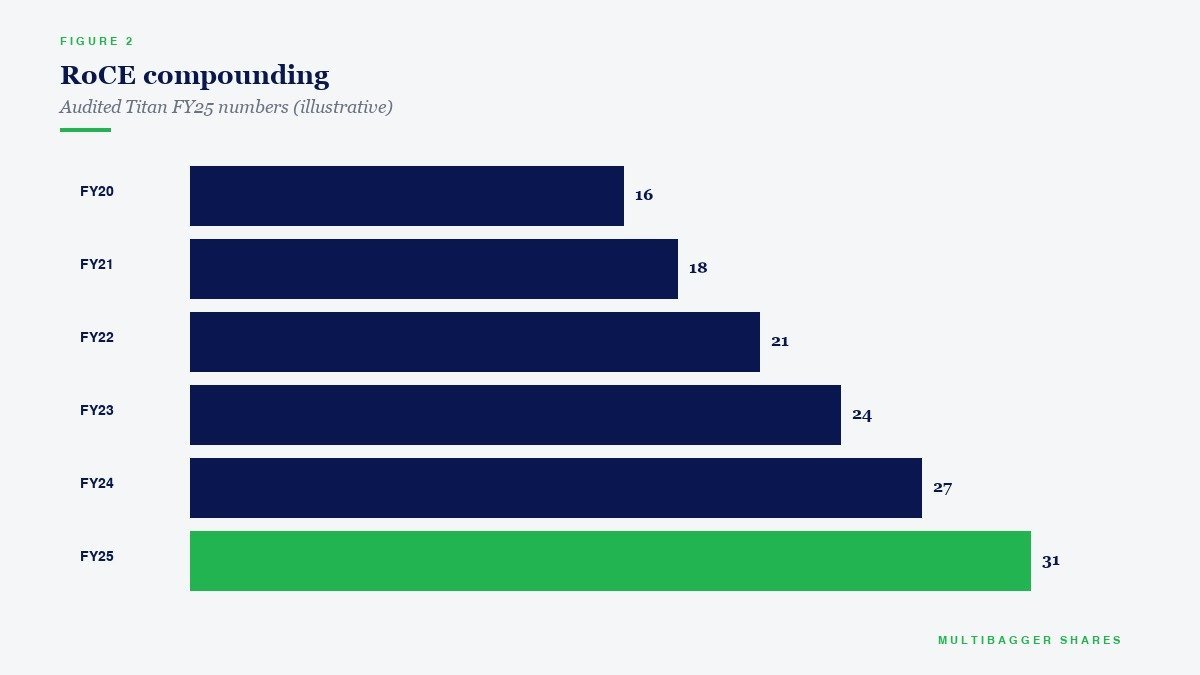
The 61.8% increase in Net Block over the past 3 years confirms aggressive investment in productive capacity — well above the industry median of 52.1%. This is a company that is building for the future, not coasting on existing assets.
Cash Flow Validation: Is Capex Funded Internally?
The quality of Capex depends not just on what is being built, but how it is being funded. Companies that fund expansion through excessive debt or equity dilution are destroying shareholder value. Let us examine how Titan Biotech financed its capacity expansion.
The data is unambiguous. Titan Biotech funded its entire second Capex cycle — including the construction of a brand new third manufacturing plant — entirely from internal cash flows. Operating Cash Flow ranged from ₹18-22 Cr per year during the peak investment period (FY2021-2025), more than sufficient to fund capital expenditures while simultaneously reducing borrowings from ₹18 Cr to ₹3 Cr.
The company generated positive Free Cash Flow every single year (₹6-13 Cr) even while building a new plant. No equity dilution (equity capital has remained constant at ₹8 Cr for over a decade), no debt-funded expansion, no external capital raises. This is self-funded growth at its purest — the kind of internal compounding that creates generational wealth.
The Growth Runway: What New Capacity Means for the Future
With the third manufacturing plant now operational and Fixed Assets at ₹57 Cr (up from ₹27 Cr five years ago), Titan Biotech has effectively doubled its production capacity. Revenue on a trailing twelve-month basis has already reached ₹193 Cr — up from ₹122 Cr when the second Capex cycle began.
The most exciting part: the CWIP of ₹4 Cr as of Sep 2025 suggests that a third investment cycle may already be underway. If the pattern holds — and there is no reason to believe it will not — this fresh capacity expansion will lay the foundation for the next leg of revenue growth, potentially pushing annual sales beyond ₹250 Cr over the next 3-4 years.
For investors who believe in concentrated portfolios of deeply researched quality stocks rather than the “di-worse-ification” that Peter Lynch warned about — the Capex cycle is one of the most powerful leading indicators of future earnings growth. A company that consistently reinvests in capacity, funds it internally, and converts that investment into revenue growth is a textbook compounder.
Key Takeaways for Indian Investors
When analysing any company, go beyond the Profit & Loss statement and study the Capex story in the Balance Sheet. Track CWIP over 5-10 years to identify investment cycles. Watch for the CWIP-to-Fixed Asset conversion — a sharp drop in CWIP accompanied by a jump in Fixed Assets means new capacity has been commissioned. Then monitor whether revenue follows within 1-2 years.
Most importantly, check how the Capex was funded. Self-funded expansion through internal cash flows is the gold standard. Debt-funded expansion is acceptable if returns exceed borrowing costs. Equity-dilution-funded expansion is the weakest and most shareholder-unfriendly form of growth.
Titan Biotech’s Capex story checks every box: two complete investment cycles, each funded internally, each resulting in step-function revenue growth, and a third cycle potentially beginning. With Fixed Assets growing 5x (₹11→₹57 Cr), revenue growing 5x (₹39→₹193 Cr TTM), and borrowings collapsing from ₹25 Cr to ₹3 Cr — this is a masterclass in disciplined capital allocation that value investors should study closely.
Disclaimer: This article is for educational and informational purposes only. It is not investment advice, and not a buy, sell, or hold recommendation on any stock mentioned, including Titan Biotech Limited. Equity markets carry risk; please do your own research or consult a qualified professional before making investment decisions.
