April 7, 2026
(Monday)
The Problem With Traditional DCF — And Why You Need to Flip It Upside Down
Every value investing textbook teaches you the Discounted Cash Flow (DCF) model. You project future cash flows, pick a discount rate, estimate a terminal growth rate, and arrive at an “intrinsic value.” The problem? Every single input is a guess. Change your growth assumption by 2%, and the intrinsic value swings by 40%. Change the discount rate from 12% to 10%, and suddenly a “fairly valued” stock looks like a screaming bargain.
This is why even Warren Buffett has said, “I’ve never seen a DCF model I trusted.” Charlie Munger put it more bluntly: “Projections are usually wishful thinking dressed up in a spreadsheet.”
But here’s the thing — there’s a far more powerful way to use the DCF framework. Instead of building a forward model and guessing growth, you reverse-engineer what the market is already assuming. This technique is called the Reverse DCF, and it is one of the most underutilized yet devastatingly effective tools in a value investor’s arsenal.
Today, with the Nifty 50 closing at 23,123.65 and the Sensex around 74,207 on April 7, 2026, many Indian small-cap and mid-cap stocks are trading at seemingly high multiples after the recent recovery. The Reverse DCF gives you a razor-sharp lens to separate genuinely cheap stocks from expensive ones — without building a single spreadsheet model from scratch.
What Exactly Is a Reverse DCF?
A traditional DCF asks: “Given my growth assumptions, what should the stock be worth?”
A Reverse DCF asks the opposite question: “Given the current stock price, what growth rate is the market implicitly assuming?”
Think of it this way. If a stock is trading at ₹500, the market has already “done a DCF” — it has collectively priced in certain expectations about the company’s future free cash flow growth, margins, reinvestment, and risk. The Reverse DCF simply extracts that implied assumption and puts it on the table for you to judge.
Once you know the implied growth rate, you ask yourself one simple question: “Is that growth rate realistic, conservative, or wildly optimistic?”
If the market is pricing in 30% annual FCF growth for 15 years and you think the company can realistically grow at 20%, the stock is overvalued. If the market is pricing in just 8% growth and you believe the company can compound at 18%, you’ve found a potential multibagger.
The Step-by-Step Reverse DCF Framework for Indian Investors
Here’s how to perform a Reverse DCF in five clear steps. You don’t need Excel wizardry — just basic arithmetic and solid business judgment.
Step 1: Gather the Current Facts
You need three numbers from the latest annual report or Screener.in:
- Current Free Cash Flow (FCF) — Operating Cash Flow minus Capital Expenditure. For companies that don’t report FCF directly, calculate it from the cash flow statement.
- Current Market Capitalization — Current share price × total shares outstanding.
- Net Debt or Net Cash — Total borrowings minus cash and cash equivalents.
From these, you can derive the Enterprise Value (EV) = Market Cap + Net Debt (or minus Net Cash).
Step 2: Set Your Assumptions (Only Two!)
Unlike a traditional DCF where you guess 10+ variables, a Reverse DCF requires you to fix only two:
- Discount Rate (Cost of Capital) — For Indian equities, 12-14% is a reasonable range for quality companies. Use 12% for large-caps with proven track records, 14% for small-caps with higher risk.
- Terminal Growth Rate — The long-run sustainable growth rate after the high-growth phase ends. For Indian companies, 5-6% (roughly nominal GDP growth) is standard.
Step 3: Solve for the Implied Growth Rate
Now, instead of plugging in a growth rate to get a price, you plug in the current price (via Enterprise Value) and solve for the growth rate that makes the DCF equation balance. The math works like this:
Enterprise Value = Σ [FCF × (1+g)^n / (1+r)^n] + Terminal Value / (1+r)^N
Where g is the unknown implied growth rate you’re solving for. You can do this by trial and error (try 10%, see if the calculated EV matches the actual EV; if too low, try 15%, and so on) or use a simple Python script or Goal Seek in Excel.
Step 4: Sanity-Check the Implied Growth
This is where your business analysis skills come in. Ask yourself:
- Has this company ever grown FCF at the implied rate historically? Check the last 5-10 years.
- Is the industry growing fast enough to support this rate?
- Does the company have the competitive advantages (moats) to sustain this growth?
- Are margins likely to expand, stay flat, or compress?
Step 5: Make Your Decision
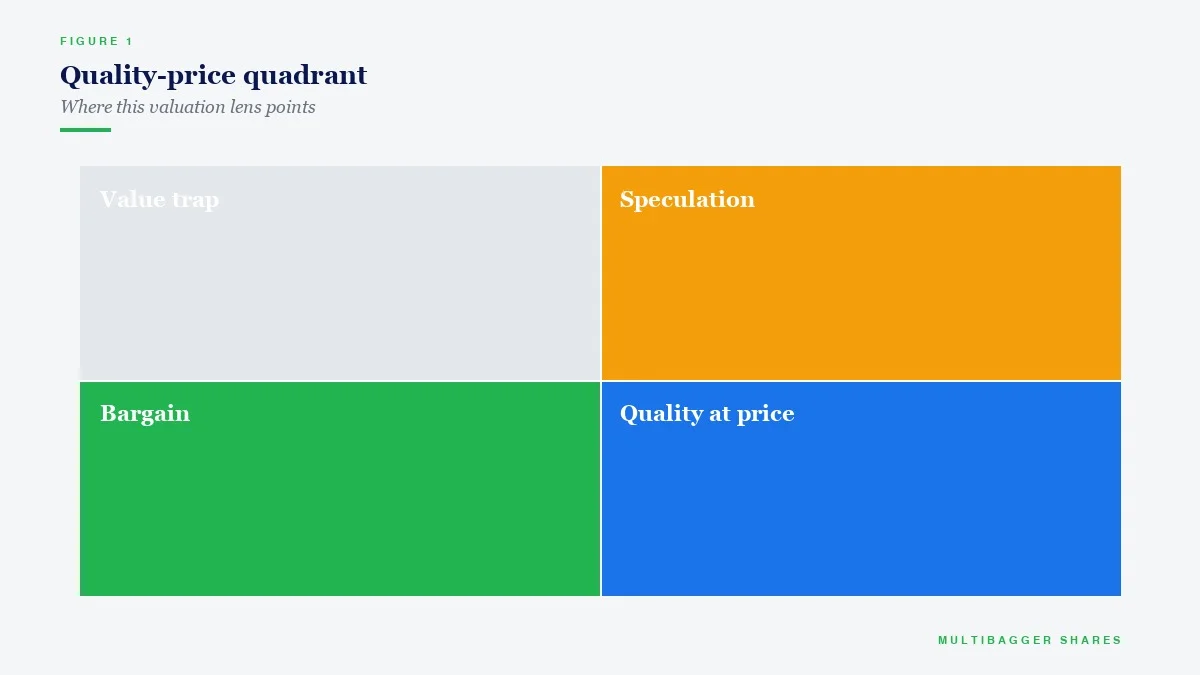
The decision matrix is beautifully simple:
- Implied growth > Your realistic estimate → Stock is OVERVALUED. The market is too optimistic. Avoid or sell.
- Implied growth ≈ Your realistic estimate → Stock is FAIRLY VALUED. No edge. Watch and wait.
- Implied growth < Your realistic estimate → Stock is UNDERVALUED. The market is pessimistic. This is your opportunity.
A Real Example: Applying Reverse DCF to an Indian Stock
Let’s take a hypothetical Indian specialty chemicals company trading at a market cap of ₹5,000 crore. Suppose its latest annual Free Cash Flow is ₹200 crore, it has net cash of ₹100 crore, and thus its Enterprise Value is ₹4,900 crore.
Using a 13% discount rate and 5% terminal growth rate over a 10-year high-growth phase, you run the Reverse DCF and find that the implied FCF growth rate is approximately 22% per annum for 10 years.
Now you check: Has this company grown FCF at 22% historically? If the answer is “Yes, it has compounded FCF at 25% over the last 7 years, and the sector tailwinds are strong,” then the stock might actually be undervalued — the market is pricing in less growth than the company has historically delivered.
But if the company’s historical FCF growth has been a lumpy 12-15% with occasional negative years, then a 22% implied rate is dangerously optimistic. The stock is likely overvalued, and you should stay away no matter how exciting the “story” sounds.
Why Reverse DCF Is Superior to Traditional Valuation for Indian Markets
Indian markets are uniquely suited to the Reverse DCF approach for several reasons:
1. It eliminates anchoring bias. When you build a traditional DCF, you unconsciously anchor to your own growth assumptions. The Reverse DCF forces you to start from what the market thinks, removing your ego from the equation. As we discussed in our earlier post on anchoring bias, this cognitive trap causes Indian investors to buy at wrong prices more often than any other bias.
2. It works brilliantly in small-cap India. Small-cap stocks often have volatile earnings and unpredictable cash flows, making traditional DCF unreliable. But the Reverse DCF sidesteps this — you’re not predicting the future, you’re evaluating the market’s prediction. This is a critical distinction.
3. It gives you conviction for concentrated portfolios. As Warren Buffett said, “Wide diversification is only required when investors do not understand what they are doing.” When you use Reverse DCF and find a stock where the market is pricing in just 10% growth but you’ve done deep research showing 20%+ is achievable, you have genuine conviction to concentrate your capital. This is how the greatest investors — Buffett, Munger, Pabrai, Jhunjhunwala — built their fortunes. Not through 50-stock diversification, but through 5-10 high-conviction bets backed by rigorous analysis like the Reverse DCF.
4. It protects you from narrative traps. Indian markets are full of “story stocks” — companies where the narrative is so compelling that investors pay any price. Defence stocks in 2024, EV stocks in 2023, digital platform stocks in 2021. The Reverse DCF cuts through the story and asks: “What growth rate would justify this price?” Often, the answer is absurd — 35%+ for 15 years — which is a mathematical impossibility for 99% of companies.
The Titan Biotech Connection: What Does the Market Imply?
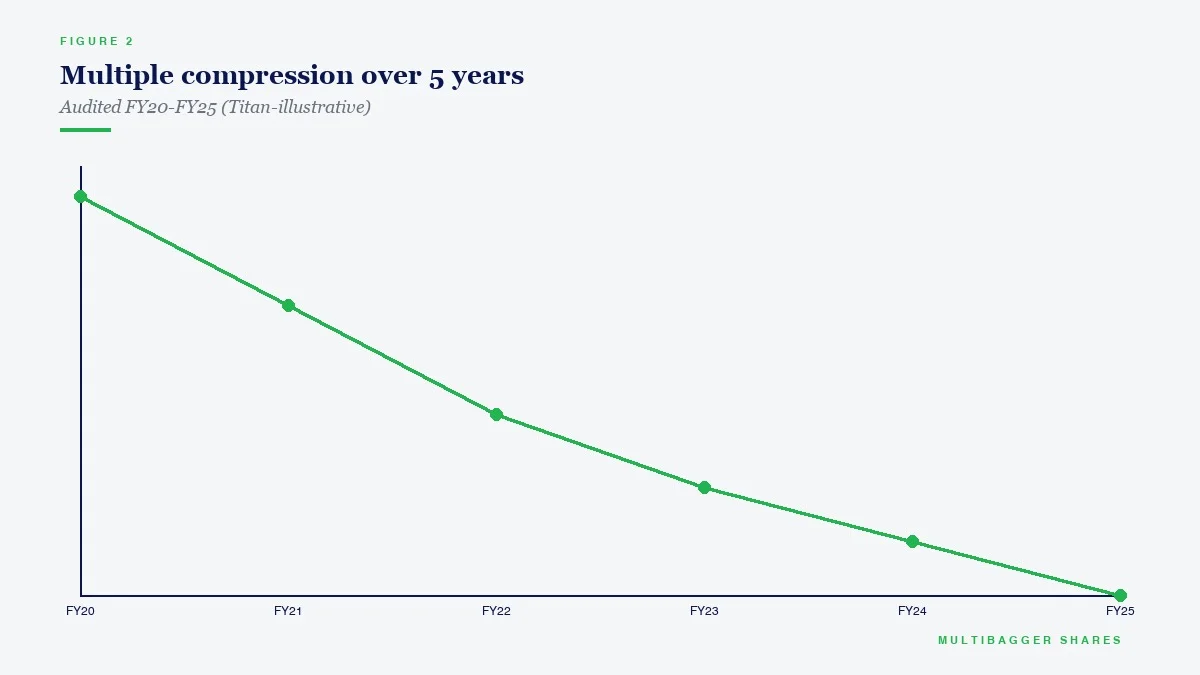
Consider Titan Biotech (BSE: 524717), currently trading at ₹503 with a market capitalization of approximately ₹2,080 crore. The stock has a P/E ratio of 76.4, a Book Value of ₹40.3 per share, ROCE of 16.9%, and ROE of 15.0%.
At first glance, a P/E of 76.4 might make traditional value investors nervous. But this is exactly where the Reverse DCF provides clarity. Instead of panicking at the headline multiple, you ask: “What FCF growth rate is the market pricing in at ₹503?”
When a company has been consistently expanding its margins (as Titan Biotech has — from 10% to 19% operating margins), reinvesting in R&D and capacity, and operating in the high-growth biotechnology inputs space with strong global demand tailwinds, the implied growth rate from a Reverse DCF may well be achievable. The key insight is that the P/E ratio alone tells you nothing — the Reverse DCF tells you everything.
This is the kind of deep, fundamental analysis that separates quality investing from speculation. It’s why we teach these frameworks in our comprehensive Value Investing Course on YouTube — to equip Indian investors with the tools that actually work.
Common Mistakes Indian Investors Make With Reverse DCF
Mistake 1: Using too low a discount rate. Some investors use 10% as a discount rate for Indian equities. This is inappropriate for a market where the risk-free rate itself is 7%+ and equity risk premiums are significant. Using 10% makes almost every stock look cheap. Stick to 12-14% for honest analysis.
Mistake 2: Ignoring the terminal value. In many cases, 60-70% of the calculated enterprise value comes from the terminal value (the value beyond the explicit forecast period). If you’re solving for implied growth and ignoring terminal value, your answer will be meaninglessly inflated.
Mistake 3: Confusing revenue growth with FCF growth. A company growing revenue at 25% might have FCF growth of only 10% if it’s reinvesting heavily in working capital or capex. Always use Free Cash Flow, not revenue or even net profit, for the Reverse DCF.
Mistake 4: Not cross-checking with other metrics. Reverse DCF is powerful, but it should be used alongside other frameworks — ROCE trends, margin analysis, promoter holding patterns, and qualitative moat assessment. No single tool is sufficient.
A Quick Mental Shortcut for Busy Investors
If you don’t want to do the full math, here’s a quick approximation that works surprisingly well for Indian mid-caps and small-caps:
Implied Growth Rate ≈ (EV/FCF – 10) × 1.5%
For example, if a company trades at EV/FCF of 30x, the implied growth is roughly (30-10) × 1.5% = 30%. That’s a sanity check — is 30% FCF growth for 10 years realistic? For most companies, the answer is no. For a select few with massive addressable markets and expanding margins, it might be.
This shortcut isn’t precise enough for investment decisions, but it’s perfect for quickly screening stocks and deciding which ones deserve deeper Reverse DCF analysis.
Why This Matters More Than Ever in Today’s Market
With Indian markets recovering from the recent volatility (Nifty at 23,123, up from the March lows), many stocks have re-rated sharply. Investors who are chasing momentum without understanding what growth expectations are baked into prices are setting themselves up for disappointment.
According to SEBI’s own study, 9 out of 10 individual traders in the equity Futures & Options segment incurred net losses. F&O trading is essentially gambling. But even in the cash segment, buying overvalued stocks because “the chart looks good” or “the story is compelling” is just a slower form of wealth destruction.
The Reverse DCF puts you on the right side of this equation. It forces you to think in terms of business fundamentals — cash flows, growth rates, competitive advantages — rather than price momentum or market narratives. It’s the ultimate tool for quality-focused, concentrated investing.
Your Action Items
1. Pick your top 3 holdings. For each, calculate the current EV/FCF ratio. Use the mental shortcut to estimate implied growth. Ask yourself: “Is this growth rate realistic?”
2. For your highest-conviction holding, run a full Reverse DCF. Use Screener.in for data, a 13% discount rate, and a 5% terminal growth rate. What growth rate is the market pricing in?
3. If the implied growth rate is lower than what you believe the company can achieve — and you’ve done deep research to support that belief — you may have found a genuine opportunity to concentrate capital.
Remember: Quality investing is about buying wonderful businesses at reasonable prices, backed by rigorous analysis. The Reverse DCF is your most powerful tool for determining what “reasonable” actually means.
📢 Join Our Telegram Channel
Get daily value investing lessons, stock analysis & Titan Biotech updates — delivered straight to your phone!
✈️ Join @longtermequityy on Telegram
🔔 Free • No spam • Value investing insights daily
Disclaimer: This article is for educational and informational purposes only. It is not investment advice, and not a buy, sell, or hold recommendation on any stock mentioned, including Titan Biotech Limited. Equity markets carry risk; please do your own research or consult a qualified professional before making investment decisions.
