April 06, 2026
(Monday)
Introduction: The Metric That Separates Cash Machines from Cash Burners
Every investor in the Indian stock market obsesses over revenue growth, profit margins, and return ratios. But there is one operational metric that the vast majority of retail investors completely ignore — the Cash Conversion Cycle (CCC). And yet, it is arguably one of the most powerful indicators of true business quality.
Here’s why it matters so profoundly: a company can show beautiful profits on its Profit & Loss statement, grow revenue at 20% year-over-year, and still go bankrupt. How? Because profit is an accounting concept, but cash is reality. The Cash Conversion Cycle tells you exactly how efficiently a business converts its investments in inventory and operations into actual cash in its bank account. A shorter CCC means the company gets paid faster than it has to pay others — and a negative CCC means the company is essentially running its entire business on other people’s money. That is the ultimate competitive advantage.
Today, with the SENSEX at 73,320 and NIFTY 50 at 22,968 (April 6, 2026), and Indian markets rebounding on Iran-US ceasefire hopes, let me teach you how to use the Cash Conversion Cycle to identify the highest-quality businesses in India — the kind that compound wealth quietly for decades.
What Exactly Is the Cash Conversion Cycle?
The Cash Conversion Cycle measures the total number of days it takes for a company to convert its investment in inventory into cash received from customers. It answers a deceptively simple question: How many days does it take from the moment you spend ₹1 on raw materials to the moment you receive ₹1 (plus profit) from your customer?
The formula is elegantly simple:
CCC = DIO + DSO − DPO
Where:
DIO (Days Inventory Outstanding) — How many days inventory sits in the warehouse before being sold. Lower is better. A company that moves inventory in 30 days is more efficient than one that takes 120 days.
DSO (Days Sales Outstanding) — How many days it takes to collect payment from customers after a sale. Lower is better. A company that collects cash in 15 days is healthier than one waiting 90 days.
DPO (Days Payable Outstanding) — How many days the company takes to pay its own suppliers. Higher is better (within ethical limits). A company with strong bargaining power can take 60-90 days to pay suppliers, effectively using their money interest-free.
When you put it all together: CCC = Time to sell inventory + Time to collect payment − Time you take to pay suppliers. A low or negative number means the business is a cash-generating machine.
Why the Cash Conversion Cycle Matters More Than You Think
Let me explain why this metric is so critical for Indian investors hunting multibaggers.
1. It Exposes “Paper Profit” Companies — Many Indian companies report impressive profits but have terrible cash flows. Their CCC reveals the truth. If a company’s CCC is 150+ days, it means the company is tying up enormous amounts of capital in inventory and receivables. That “profit” is stuck in invoices and godowns, not in the bank. This is especially common in Indian infrastructure, real estate, and capital goods companies. The CCC strips away the accounting illusion and shows you the operational truth.
2. It Reveals Competitive Moat — A company with a consistently low or negative CCC has immense bargaining power — both with customers (who pay quickly) and suppliers (who accept delayed payment). This is the hallmark of a business with a genuine economic moat. Think about it: why would customers pay you quickly? Because your product is essential and in demand. Why would suppliers wait for payment? Because losing you as a customer would hurt them more than the delayed payment.
3. It Predicts Capital Efficiency — A shorter CCC means less working capital is needed to run the business. Less working capital tied up means more free cash flow. More free cash flow means more money available for growth, dividends, buybacks, or debt reduction — everything that creates long-term shareholder value. This is why understanding CCC is essential before you invest even ₹1 in any stock.
Real-World Indian Examples: The Good, The Great, and The Dangerous
D-Mart (Avenue Supermarts) — The Negative CCC Champion: D-Mart operates with a negative Cash Conversion Cycle. It sells products to consumers for cash (or near-instant digital payment), turns over inventory rapidly, but negotiates 30-60 day payment terms with suppliers. This means D-Mart receives money from customers BEFORE it pays suppliers. The business literally funds its own growth using supplier money. This is one reason D-Mart has been such a remarkable wealth creator — its business model is a self-funding cash machine. Radhakishan Damani understood this brilliantly when he designed the D-Mart model.
Hindustan Unilever (HUL) — FMCG Cash Efficiency: HUL and other leading FMCG companies typically operate with very low or negative CCCs (often in the range of -20 to 20 days). Fast-moving consumer goods sell quickly (low DIO), customers pay immediately at retail (low DSO), and HUL’s massive scale gives it leverage to negotiate longer payment terms with suppliers (high DPO). The FMCG sector’s inherently short CCC is one reason these companies command premium valuations in India.
Infrastructure Companies — The CCC Danger Zone: On the opposite end, many Indian infrastructure and construction companies operate with CCCs of 200-400+ days. They buy materials, execute projects over months or years, and then wait additional months for government or corporate clients to pay. The result? Enormous amounts of capital locked up in work-in-progress and receivables. This is why so many infrastructure stocks have destroyed wealth despite India’s building boom — they are cash-hungry monsters that consume capital faster than they generate it.
The Titan Biotech Case Study: Cash Efficiency in Action
Let’s look at our favourite case study — Titan Biotech Ltd (BSE: 524717), currently trading at ₹529 per share with a market cap of ₹2,187 crore (as of April 6, 2026). The company maintains a ROCE of 16.9% and ROE of 15.0%, with a book value of ₹40.3 per share.
Titan Biotech operates in the biotechnology and life sciences ingredients space — manufacturing products like agar, peptones, culture media, and specialty biochemicals. What makes this business interesting from a CCC perspective is the nature of its operations:
Inventory Management: As a manufacturer of specialty biochemicals, Titan Biotech needs to maintain adequate inventory of raw materials and finished goods. However, because its products serve essential industries (pharmaceuticals, diagnostics, food testing), demand is relatively stable and predictable. This allows for efficient inventory management without the massive swings you see in cyclical industries.
Receivables Quality: Titan Biotech’s customers include pharmaceutical companies, research institutions, and diagnostic laboratories — professional buyers with established payment practices. While B2B receivables will always be higher than B2C retail, the quality of these receivables matters enormously. Selling to stable, ongoing institutional customers is vastly different from selling to one-time project clients who might dispute invoices for months.
The Debt-Free Advantage: With a debt-to-equity ratio of just 0.02x, Titan Biotech doesn’t need external capital to fund its working capital cycle. This is a massive advantage. Companies with high CCC AND high debt face a double squeeze — they need to borrow money to fund slow-moving operations, and the interest on that debt further erodes their returns. Titan Biotech’s near-zero debt means whatever working capital it needs is funded by its own retained earnings and supplier credit, not by expensive bank loans.
For investors evaluating Titan Biotech, the CCC framework helps you understand WHY the company has been able to grow consistently while maintaining strong profitability and zero debt. Efficient operations → shorter cash cycle → less capital needed → more value creation for shareholders.
How to Calculate and Analyze CCC: A Step-by-Step Guide
Step 1: Get the Data. Go to Screener.in or the company’s annual report. You need three numbers from the balance sheet: Inventory, Trade Receivables, and Trade Payables. You also need Revenue and Cost of Goods Sold (COGS) from the P&L statement.
Step 2: Calculate DIO. DIO = (Average Inventory ÷ COGS) × 365. This tells you how many days inventory sits before being sold. Compare this across years — if DIO is rising, the company may be facing demand slowdown or overstocking.
Step 3: Calculate DSO. DSO = (Average Trade Receivables ÷ Revenue) × 365. This tells you how quickly customers pay. A rising DSO is a RED FLAG — it means the company is extending more credit to maintain sales, which is often a sign of competitive pressure or channel stuffing.
Step 4: Calculate DPO. DPO = (Average Trade Payables ÷ COGS) × 365. This tells you how long the company takes to pay suppliers. A stable or rising DPO indicates strong bargaining power. But a suddenly spiking DPO might mean the company is delaying payments because it’s running out of cash — context matters.
Step 5: CCC = DIO + DSO − DPO. Now analyze the trend over 5-10 years. Is CCC improving (getting lower)? That’s a sign of increasing operational efficiency and growing competitive advantage. Is CCC deteriorating (getting higher)? That’s an early warning that the business is consuming more capital to operate.
Red Flags in the Cash Conversion Cycle
When analyzing any Indian company’s CCC, watch for these danger signals:
Rising DIO + Rising DSO: This deadly combination means the company is building up unsold inventory AND customers are taking longer to pay. This is often seen before earnings downgrades. The company will eventually have to write down inventory or book bad debts, both of which destroy shareholder value.
Sudden DPO Spike: If a company’s DPO jumps dramatically, it might seem positive (taking longer to pay suppliers = using their cash). But in reality, a sudden spike often means the company is UNABLE to pay suppliers on time because of cash flow problems. Check whether the DPO increase is accompanied by rising debt or falling cash balances.
CCC > 180 Days: Any company with a CCC exceeding six months is tying up enormous amounts of capital. Unless it’s a business with very long natural cycles (like shipbuilding or large-scale construction), a CCC this high is a warning sign of poor operational management or a fundamentally capital-intensive business model.
CCC Diverging from Peers: Always compare CCC within the same sector. If one pharmaceutical company has a CCC of 60 days while its peers average 120 days, the first company has a genuine operational advantage. Conversely, if one company’s CCC is deteriorating while peers are improving, something is wrong with that specific business.
The Negative CCC: The Holy Grail of Business Models
The most powerful businesses in the world operate with negative Cash Conversion Cycles. When CCC is negative, the company collects cash from customers BEFORE it needs to pay suppliers. This means the business generates cash from its very operations — it doesn’t need external capital to grow. The more it sells, the more cash it generates. It’s a beautiful virtuous cycle.
In India, businesses with negative CCCs include select FMCG companies, some retail chains like D-Mart, and certain subscription-based or advance-payment businesses. When you find a company with a negative CCC combined with strong ROCE (like the 16.9% ROCE Titan Biotech delivers), high promoter holding, and zero debt — you’ve likely found a business that can compound wealth for decades.
As Warren Buffett famously said: “Wide diversification is only required when investors do not understand what they are doing.” When you deeply understand a company’s Cash Conversion Cycle and see that it operates with genuine cash efficiency, you don’t need 50 stocks in your portfolio. You need 5-10 such high-conviction ideas where you understand the business deeply enough to hold through any market cycle. That is how the greatest investors — Buffett, Munger, Pabrai, Jhunjhunwala — built their fortunes. Through conviction in deeply researched businesses, not through diversification across mediocre picks.
Practical Framework: Using CCC in Your Stock Analysis
Here’s how I recommend incorporating CCC into your investment process using our value investing framework:
Filter First: Before diving deep into any stock, quickly check its CCC. If it’s above 180 days and trending upward, consider whether the business model justifies such capital intensity. For most investors, businesses with CCC below 90 days are more likely to deliver consistent compounding.
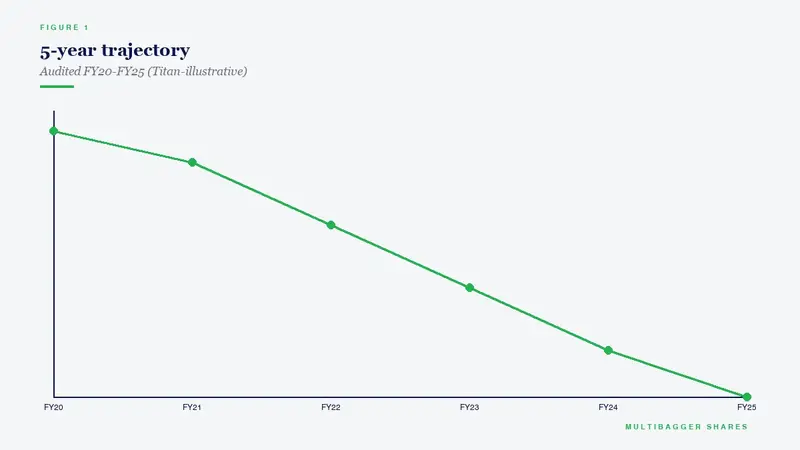
Track the Trend: A single year’s CCC can be misleading. Track the 5-year or 10-year trend. A business that has consistently reduced its CCC from 100 days to 40 days is becoming more efficient — this is the kind of operational improvement that quietly drives massive shareholder value.
Cross-Reference with FCF: CCC and Free Cash Flow should tell the same story. A declining CCC should correspond with improving free cash flow. If CCC is declining but FCF isn’t improving, something else is consuming cash (perhaps heavy capex or rising debt payments).
Sector Context: Don’t compare an IT company’s CCC with a steel manufacturer’s CCC. Always benchmark within the same sector. The goal is to find companies with better CCCs than their direct peers.
Why This Matters for Your Multibagger Journey
The Cash Conversion Cycle is not just an academic metric — it is a window into the operational soul of a business. Companies that manage their CCC well are companies that respect capital, operate with discipline, and generate genuine cash returns for shareholders. These are the businesses that compound at 20-30% annually for decades — the true multibaggers.
As we always emphasize here at Multibagger Shares: focus on quality stock picking and deep fundamental analysis. Don’t gamble in Futures & Options. According to SEBI’s own study, 9 out of 10 individual traders in the equity F&O segment incur net losses. Instead, learn to read financial statements, understand metrics like the Cash Conversion Cycle, and build a concentrated portfolio of 5-10 deeply researched, high-conviction multibagger stocks.
To deepen your value investing education, check out our comprehensive course playlist: Multibagger Shares Value Investing Course
📢 Join Our Telegram Channel
Get daily value investing lessons, stock analysis & Titan Biotech updates — delivered straight to your phone!
✈️ Join @longtermequityy on Telegram
🔔 Free • No spam • Value investing insights daily
Disclaimer: This article is for educational and informational purposes only. It is not investment advice, and not a buy, sell, or hold recommendation on any stock mentioned, including Titan Biotech Limited. Equity markets carry risk; please do your own research or consult a qualified professional before making investment decisions.
