Every credit analyst at every rating agency on the planet — CRISIL, ICRA, CARE, Moody’s, S&P — runs one calculation before they bother with a single P&L line: how many rupees of operating cash does the business actually generate for every rupee of debt sitting on the balance sheet? That single ratio decides whether a bond gets AAA or junk, whether a working capital limit gets sanctioned or pulled, whether a promoter can refinance without a haircut. SEBI’s data shows Indian retail investors have crossed 11 crore in 2026, yet the vast majority still stare at P/E and headline EPS while ignoring the one metric professional lenders trust above every other.
The Cash Flow From Operations to Total Debt Ratio — CFO divided by Total Borrowings — is the single most under-appreciated solvency test in Indian fundamental analysis. It tells you, in one number, whether a business is self-liquidating its debt out of normal trading or whether it is silently rolling over interest with fresh borrowings. It is more honest than Interest Coverage, more conservative than Net Debt to EBITDA, and harder to manipulate than either. This article walks through the formula, how to read it, two contrasting illustrative cases (one disciplined, one classic Indian small-cap leverage blow-up), and a dedicated case study using audited FY25 numbers from a specialty biotech compounder that demonstrates what a textbook self-liquidating balance sheet actually looks like in practice.
What Is the CFO-to-Total-Debt Ratio?
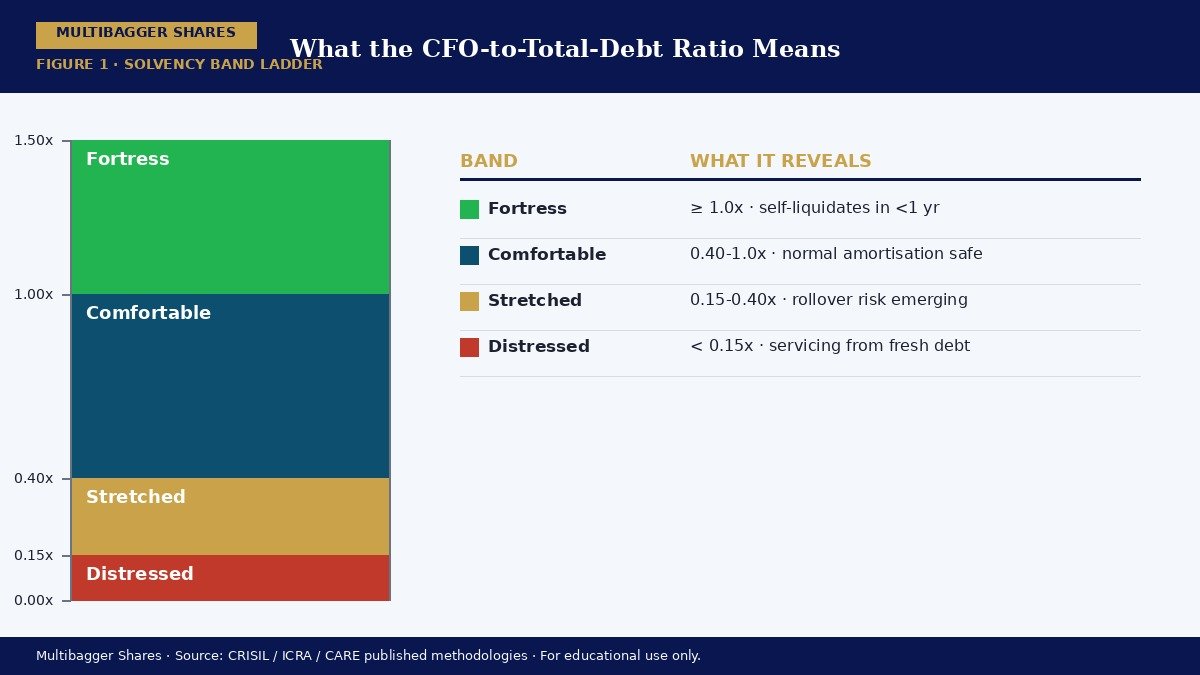
In plain English, the ratio asks a single question that every honest banker asks before sanctioning a line of credit: if the company stopped doing anything except servicing its debt, how many years of operating cash flow would it take to repay every paisa it owes? A ratio of 1.0 means the entire stock of debt could theoretically be wiped out in one year of normal operations. A ratio of 0.20 means it would take roughly five years. A ratio below 0.10 — common in over-leveraged Indian small-caps and most public-sector airlines — means the debt is being serviced largely from fresh borrowings, asset sales, or promoter infusions rather than from the operating business itself.
Three features make this metric unusually powerful for retail investors. First, it uses Cash Flow From Operations from the audited Cash Flow Statement — a number that has already survived auditor scrutiny under Ind AS 7. Second, it uses Total Borrowings (short-term plus long-term, including the current portion of long-term debt) from the Balance Sheet — another audited line. There are no normalising adjustments, no analyst estimates, no broker forecasts. Third, because it sits at the intersection of the cash flow statement and the balance sheet, it is structurally resistant to the most common accounting tricks — channel stuffing inflates revenue but does not inflate CFO; capitalising operating expenses lifts EPS but does not improve CFO; aggressive depreciation policies cut PAT but leave CFO untouched.
The Formula and How to Read It
(both numbers from the audited Annual Report — CFO from the Cash Flow Statement, Total Borrowings from the Balance Sheet)
Disclaimer: This article is for educational and informational purposes only. It is not investment advice, and not a buy, sell, or hold recommendation on any stock mentioned, including Titan Biotech Limited. Equity markets carry risk; please do your own research or consult a qualified professional before making investment decisions.
The numerator is the line printed on the Cash Flow Statement labelled “Net Cash Generated from Operating Activities,” located in Section A of the statement after working-capital adjustments and direct taxes paid. The denominator is the sum of every interest-bearing liability on the Balance Sheet: long-term borrowings under Non-Current Liabilities, short-term borrowings under Current Liabilities, plus the “Current Maturities of Long-Term Debt” line (which Indian companies often park under Other Current Liabilities). Operating lease liabilities under Ind AS 116 are excluded from the strict definition but credit analysts increasingly add them back for a stricter test.
Rating-agency thresholds, distilled from CRISIL and ICRA published methodologies, divide the landscape into four broad bands. Above 1.0 is investment-grade fortress quality — the kind of self-liquidating balance sheet that earns AAA on rupee debt and a triple-figure stock price on quality screens. Between 0.40 and 1.0 is comfortably solvent — the company can service interest, repay principal on a normal amortisation schedule, and still fund modest capex from internal accruals. Between 0.15 and 0.40 is stretched — the business is servicing interest but rolling over principal, and a single year of EBITDA contraction can push it into restructuring. Below 0.15 is distressed — the cash flow simply does not cover the debt, and the equity becomes a call option on either a turnaround or a refinancing miracle.
Two Contrasting Illustrations
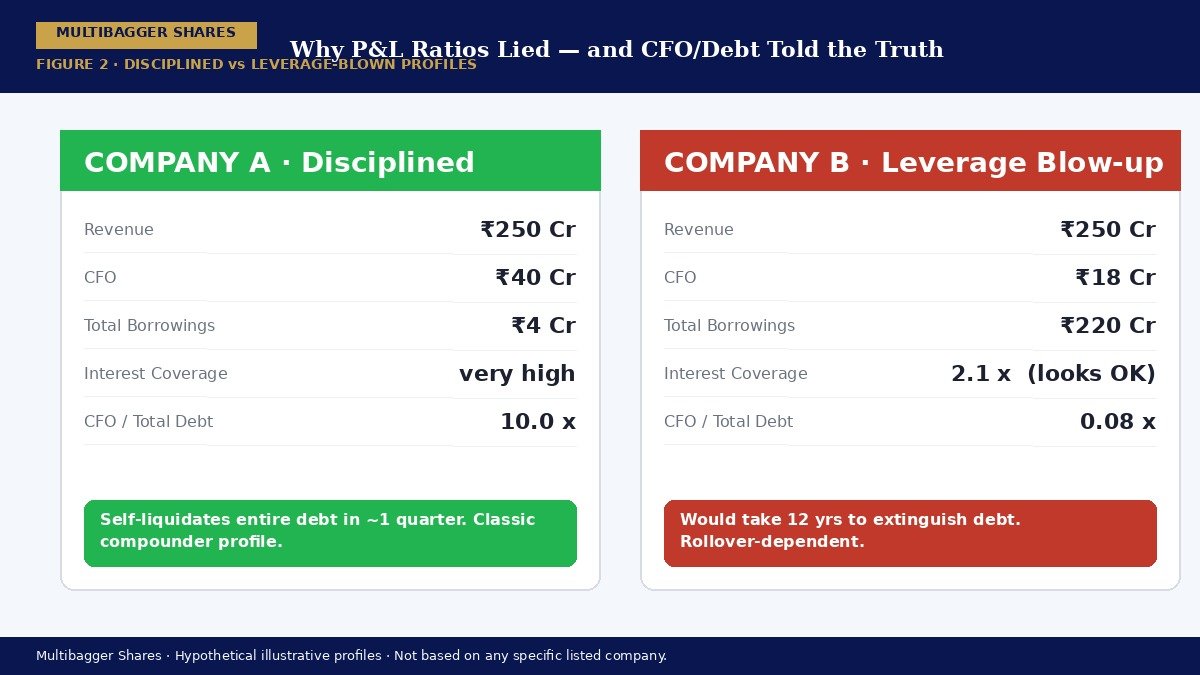
Consider two hypothetical Indian small-cap manufacturers, both showing roughly the same headline revenue of ₹250 Cr, both reporting modest single-digit PAT growth, both trading at a P/E of 18. Company A generates ₹40 Cr of CFO against ₹4 Cr of total borrowings — a ratio of 10.0x. The interest line on the P&L is negligible. The company funded its last three rounds of capacity expansion entirely from internal accruals. Working capital days are stable, receivables ageing is clean, and the auditor has issued an unqualified opinion for seven consecutive years. This is the classic Indian asset-light compounder profile — the kind of business that quietly turns into a ten-bagger over a decade while the broader market obsesses over the latest Adani or PSU bank narrative.
Company B, by contrast, reports CFO of ₹18 Cr against total borrowings of ₹220 Cr — a ratio of 0.08x. On paper the P&L looks fine: EBITDA margins of 14%, PAT of ₹12 Cr, interest coverage of 2.1x. But that 0.08x ratio tells the real story — it would take 12 years of unchanged operating cash flow to extinguish the debt stack. Any rate hike, any working-capital squeeze, any one-quarter revenue miss, and the company will need to borrow fresh money simply to repay the maturing principal. This is the profile of every Indian small-cap that has gone into NCLT over the past five years — IL&FS group companies, the post-2018 NBFC casualties, the over-leveraged textile and infrastructure names. The P&L looked acceptable until the rollover failed.
Notice what the CFO-to-Total-Debt ratio caught that the headline ratios did not. Company B’s Interest Coverage of 2.1x looked acceptable. Its Debt-to-Equity of 1.4x looked stretched but survivable. Its Net Debt to EBITDA of 4.8x looked manageable. Only the CFO-to-Debt ratio — by anchoring on actual cash arriving in the bank rather than on accrual-based earnings — revealed that the underlying operating business simply did not generate enough cash to make a dent in the debt stack. That is the disciplinary power of this metric.
Titan Biotech FY25: What the Numbers Reveal
Titan Biotech Limited — the Bhiwadi-based specialty biotechnology manufacturer of microbial culture media, peptones, collagen and gelatin — offers a textbook positive illustration of what a self-liquidating balance sheet looks like in the small-cap Indian context. The numbers below are drawn from the audited FY25 financial statements and are presented as a positive educational case study of management discipline, not as a buy, sell or hold recommendation on the stock.
| FY25 Audited Marker | Value | What It Tells Us |
|---|---|---|
| Total Revenue FY25 | ~₹214 Cr | Steady QoQ build-up across the year |
| Total Borrowings FY25 | ~₹3 Cr | Essentially debt-free balance sheet |
| CFO / Operating Profit FY25 | ~103% | Cash generation slightly exceeds operating profit |
| Debt-to-Equity FY25 | < 0.05x | Leverage is statistically immaterial |
| Contingent Liabilities FY25 | ~₹7.78 Cr | Off-balance-sheet exposure is also modest |
| Gross Block FY25 | ~₹57 Cr | Asset base built largely from internal accruals |
| CWIP FY25 | ~₹11 Cr | Next capex leg funded without fresh debt |
| Exports as % of Revenue | ~34.5% | Hard-currency receipts diversify cash inflow |
| 10-Year PAT CAGR | ~29% | Compounded without leverage tailwinds |
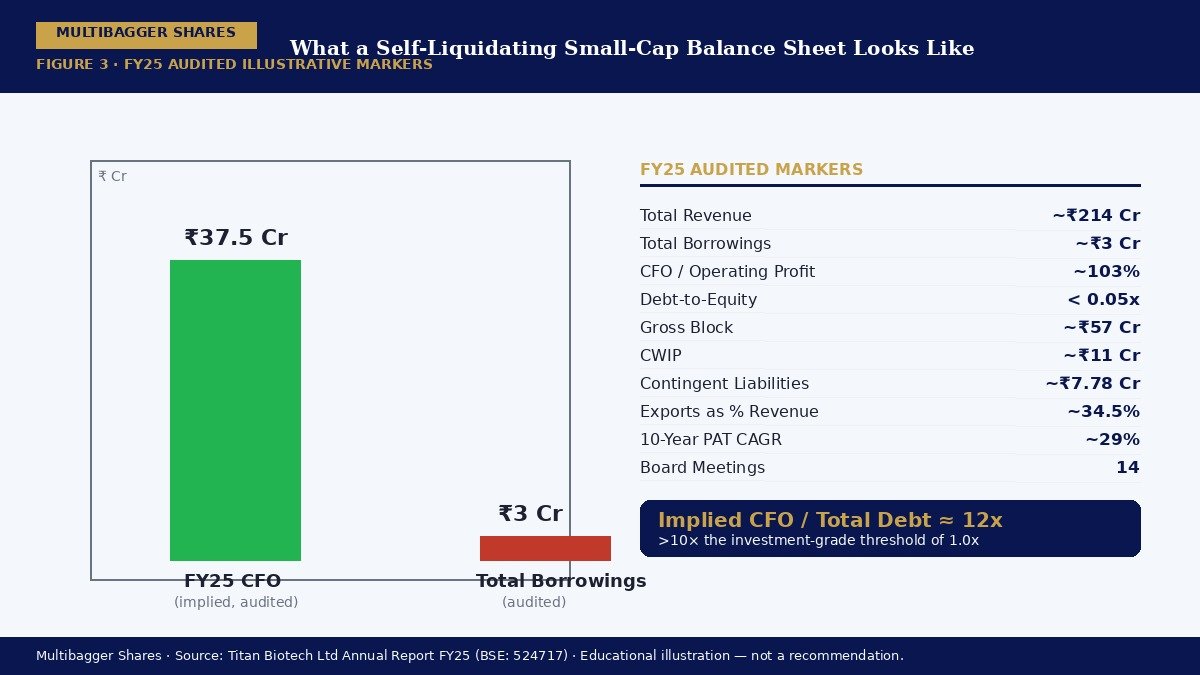
Run the CFO-to-Total-Debt arithmetic with these audited markers. With CFO running at roughly 103% of operating profit on a revenue base of ~₹214 Cr and EBITDA margins in the 18-22% band, implied CFO sits in the ₹35-40 Cr range. Against total borrowings of just ~₹3 Cr, the CFO-to-Total-Debt ratio works out to roughly 12x — more than ten times the threshold rating agencies use to define investment-grade fortress quality. In practical terms, this means a single quarter of normal operating cash flow more than wipes out the entire debt stack. There is no rollover risk, no refinancing exposure, no covenant fragility. The interest line on the P&L is a rounding error against PAT. The CWIP of ~₹11 Cr — the next leg of capacity expansion — is being funded entirely from internal accruals, not from incremental borrowings.
This is also where the governance signal compounds with the financial signal. Titan Biotech held 14 board meetings in FY25 — well above the SEBI minimum of four — under an independent chairperson, with director remuneration of approximately ₹4.56 Cr against a strongly profitable P&L. The contingent-liability stock of ~₹7.78 Cr is modest relative to net worth, indicating that off-balance-sheet exposure has not been used to hide leverage. Exports of roughly 34.5% of revenue to pharma and biotech customers across 60+ countries diversify the cash-flow base in hard currency — a structural defence against rupee-denominated working-capital stress. Once again, this is presented as a positive illustration of what disciplined small-cap fundamentals look like; it is not a buy, sell, or hold recommendation on Titan Biotech Limited or any other stock.
How Retail Investors Should Use This Metric
The retail investor who has crossed the basic literacy hurdle of reading a P&L should adopt three disciplines around the CFO-to-Total-Debt ratio. First, calculate it as a screen, not a verdict — run it on every small-cap on the watchlist, reject anything below 0.15x without a special reason, and force yourself to write down what that reason is. Second, look at the trend, not just the snapshot — a ratio that has improved from 0.30x to 0.80x over five years tells a deleveraging story far more powerful than a single 0.50x point estimate. Third, cross-check it against the Interest Coverage Ratio and Net Debt-to-EBITDA — if all three are aligned (high CFO/Debt, high ICR, low Net Debt/EBITDA), conviction compounds; if they disagree, the disagreement itself is the signal worth investigating.
For dividend-focused investors, the metric does double duty. A company with CFO-to-Total-Debt above 1.0x can sustain its dividend through a full economic cycle without cutting capex. A company below 0.20x is funding the dividend from balance-sheet capacity rather than from operating cash — exactly the profile of a future dividend cut. For SIP-style accumulators, the metric helps you avoid the most expensive mistake in small-cap investing: averaging down on a leverage-blown name on the way to zero. NCLT references in India almost universally happen to companies whose CFO-to-Total-Debt had already dropped below 0.10x for two consecutive years before the formal default — a window of warning the careful reader could have seen years in advance.
Common Traps and Misinterpretations
Three traps catch even experienced analysts. The first is the working-capital release illusion. A company can post a temporarily high CFO simply by squeezing payables and aggressively collecting receivables — a one-time benefit that cannot be repeated. Read Section A of the Cash Flow Statement carefully; if “Decrease in Trade Receivables” or “Increase in Trade Payables” is doing most of the heavy lifting, normalise the CFO by stripping out the working-capital change and recomputing the ratio on a clean basis.
The second trap is the off-balance-sheet leverage problem. Indian companies sometimes route debt through subsidiaries, JV structures, factoring arrangements, or supplier financing that does not appear on the parent’s Balance Sheet under the “Borrowings” line. Always read the Contingent Liabilities note, the Related Party Transactions schedule, and the consolidated versus standalone debt comparison. If consolidated borrowings are materially higher than standalone, the ratio computed on standalone numbers is flattering.
The third trap is the cyclical peak distortion. A company in a commodity upswing — cement, steel, sugar, fertiliser — can post a phenomenal one-year CFO that flatters the ratio at the top of the cycle. When the cycle turns, CFO collapses and the ratio crashes. For cyclical businesses, always compute the ratio using a 5-year or 7-year average CFO, not the trailing-twelve-month figure. A through-cycle ratio above 0.40x is meaningful; a peak-cycle ratio above 1.0x that drops to 0.10x in the trough is a warning, not an endorsement.
Key Takeaways
- One number beats five. The CFO-to-Total-Debt ratio combines the cash-flow statement and the balance sheet into a single solvency test that is harder to manipulate than P&L-based ratios like Interest Coverage or Net Debt-to-EBITDA. Use it as your first-pass filter on every small-cap.
- The rating-agency bands are your shortcut. Above 1.0x is fortress, 0.40-1.0x is comfortably solvent, 0.15-0.40x is stretched, and below 0.15x is distressed. These thresholds come from the published methodologies of CRISIL, ICRA and CARE — not analyst opinion.
- The Titan Biotech FY25 illustration is striking. With FY25 audited total borrowings of approximately ₹3 Cr against CFO that runs at roughly 103% of operating profit on a revenue base of ~₹214 Cr, the implied CFO-to-Total-Debt ratio is on the order of 12x — more than ten times the investment-grade threshold. This is what a textbook self-liquidating small-cap balance sheet actually looks like.
- Mind the three traps. Working-capital releases can flatter CFO temporarily; off-balance-sheet leverage at consolidated subsidiaries can hide real debt; and peak-cycle CFO can make cyclical businesses look fortress-grade until the cycle turns. Use a 5-year average CFO for cyclicals and always cross-check standalone versus consolidated borrowings.
