Last week, India crossed a quiet milestone. The number of unique investors registered with NSE moved past 11 crore — up from just 3 crore in 2019, according to NSE’s Market Pulse data. In parallel, the SEBI study released in 2024 (and revalidated in 2025) reminded retail India of an uncomfortable truth: 9 out of 10 individual traders in equity Futures & Options lose money, with aggregate net losses crossing ₹1.8 lakh crore in three years. F&O is not investing — it is, in SEBI’s own framing, gambling. The disciplined alternative is value investing built on careful analysis of fundamentals.
And yet, 11 crore investors and rising — most of them new to equities — are walking into Dalal Street with the bluntest, most over-used number in their kit: the Price-to-Earnings (P/E) ratio. They look at “P/E 18 — looks cheap, BUY!” or “P/E 60 — too expensive, SKIP!” and decide a long-term position on a 30-second glance.
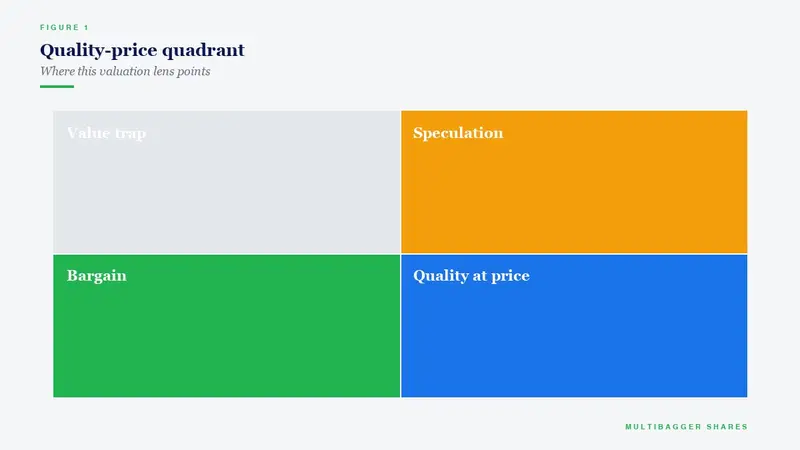
The problem is that P/E does not stand alone. A 60x P/E may be richly priced for a 5%-growth utility and brutally cheap for a 35%-growth specialty business. A 12x P/E may be a steal — or a value trap signalling stagnation. Peter Lynch, the legendary manager of Fidelity Magellan Fund (1977–1990, 29.2% CAGR), built his career on a single insight: price must be read against growth. The metric he popularised in his 1989 classic One Up on Wall Street — the PEG Ratio — is the single most under-used tool in the Indian retail investor’s valuation kit.
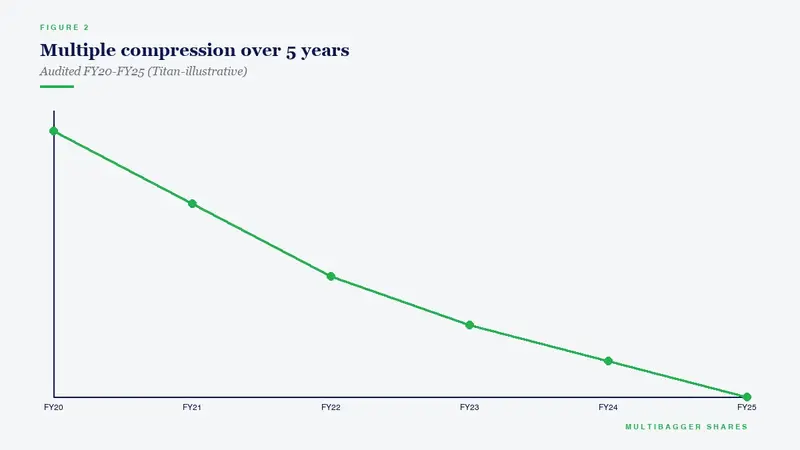
Today’s lesson teaches the PEG Ratio end-to-end: definition, formula, how to read it, where it fails, and how disciplined Indian long-term investors can apply it. We will use Titan Biotech Limited (BSE: 524717) FY25 audited numbers — including its remarkable ~29% PAT CAGR over the last decade — purely as an educational illustration of what the underlying inputs to a PEG calculation look like in a clean, organically-grown small-cap biotech. This is not a buy/sell recommendation on Titan Biotech or any other security.
What Is the PEG Ratio?
The PEG Ratio — Price-to-Earnings-to-Growth — is the P/E multiple divided by the company’s expected (or historical) annual earnings growth rate, expressed as a percentage. The intuition is simple: a stock trading at 20x earnings while growing 20% is fundamentally cheaper than a stock trading at 14x earnings while growing 4%. The first stock has a PEG of 1.0; the second, 3.5.
Peter Lynch wrote in One Up on Wall Street:
“The P/E ratio of any company that’s fairly priced will equal its growth rate… If the P/E ratio is less than the growth rate, you may have found yourself a bargain.”
That single sentence reframes valuation away from the dangerous false binary of “high P/E = expensive, low P/E = cheap.” It says: read the price tag relative to the engine generating future cash flows. PEG is not a verdict; it is a screening filter that flags stocks worth a deeper, fundamental study.
The PEG Formula — and How to Read It
The textbook PEG formula is:
PEG = (P/E Ratio) ÷ (Annual Earnings Growth Rate, %)
For example, a stock priced at ₹600 with EPS of ₹30 has a P/E of 20. If the same business has compounded earnings at 25% per year over the last decade and analysts (or your own conservative model) expect mid-teens growth ahead, the PEG using historical growth is 20 ÷ 25 = 0.80.
Lynch’s interpretive scale, widely adopted in institutional research, is:
| PEG Range | Interpretation (Lynch) | What a Disciplined Indian Investor Should Do |
|---|---|---|
| Less than 0.5 | Potential deep bargain — or hidden risk | Investigate first: is the growth real and durable, or a one-off recovery? |
| 0.5 – 1.0 | Attractive zone — growth is well above price | Worth detailed fundamental study |
| ~ 1.0 | Fair value — growth and price match | Neither signal; depends on quality and durability |
| 1.0 – 2.0 | Premium — paying for visibility/quality | Demand high earnings quality and franchise economics |
| Above 2.0 | Expensive — growth must be sustained or multiple compresses | Margin of safety is thin; small disappointments hurt |
Two crucial caveats Lynch repeatedly stressed:
- Use realistic growth, not hope. If a small-cap grew earnings at 60% in the last cyclical upturn, do not extrapolate that as the base rate for the next decade. Use 5- or 10-year compounded growth (a CAGR), not a one-quarter spike.
- Adjust for dividends. The dividend-adjusted PEG = P/E ÷ (Earnings Growth % + Dividend Yield %). A 12% grower paying a 3% yield is, on a total-return basis, a 15% compounder — and that is what the denominator should reflect.
Two Worked Examples — Discipline vs. Red Flag
Example 1: The disciplined compounder (illustrative, generic). Consider a hypothetical Indian specialty-chemicals company trading at ₹1,200 with EPS of ₹40, P/E of 30. Over the last 10 years, its EPS has compounded at 24% per annum, with revenue at 18%. Margins have expanded steadily because of operating leverage on a fixed cost base, capex has been measured (capex/depreciation around 1.5x), and CFO has tracked PAT at 95–105% with no swings. The 10-year EPS CAGR of 24% is a defensible base for the denominator. Conservatively haircut to 18% to reflect base-rate fade as the company scales — PEG = 30 ÷ 18 = 1.67. Premium, but the franchise economics may justify it. The disciplined investor pays the premium only if every supporting metric (RoCE, RoIC, cash conversion, governance, debt) is a green flag.
Example 2: The classic red flag (historical, generic). In the late 1990s and early 2000s, Indian textile and commodity-cycle stocks routinely showed apparently low PEGs — say P/E 8 against a trailing 3-year EPS growth of 40%. The PEG of 0.20 looked like a generational bargain. But the EPS growth was almost entirely cyclical: cotton prices, oil prices, or one-time inventory revaluation. When the cycle inverted, EPS collapsed 60–80%, and the trailing 3-year growth that drove the bargain PEG was revealed to be backward-looking noise. The lesson: PEG is only as good as the durability of the growth in the denominator. Always anchor PEG on a 7- to 10-year compounded number, not 2- or 3-year spikes.
Titan Biotech FY25: What the Numbers Reveal
Below is a snapshot of the FY25 audited numbers most relevant when an investor is computing the inputs to a PEG-style framework on Titan Biotech Limited (BSE: 524717). These are illustrative of what the building blocks look like in a small-cap specialty biotech with an organic growth trajectory and a clean balance sheet — not a recommendation to buy, sell, or hold the stock.
| FY25 Audited Marker (Titan Biotech) | Value | Why it matters for a PEG framework |
|---|---|---|
| Total Revenue FY25 (4-quarter sum) | ~₹214 Cr | The base from which the next leg of growth must be earned |
| 10-year Revenue CAGR | ~15% | The single most reliable proxy for sustainable revenue growth — base of any forward EPS estimate |
| 10-year PAT CAGR | ~29% | Earnings have compounded faster than revenue — a sign of operating-leverage economics |
| FY25 QoQ Revenue Arc | ₹46.5 Cr → ₹54 Cr → ₹56 Cr → ~₹58 Cr | Smooth quarterly progression suggests durable, non-cyclical demand |
| CFO / Operating Profit FY25 | ~103% | Earnings are fully cash-backed; the “E” in P/E is real, not accounting fiction |
| Total Borrowings FY25 | ~₹3 Cr | Near-debt-free — interest does not distort EPS, so historical EPS growth is “clean” |
| Contingent Liabilities FY25 | ~₹7.78 Cr | Forensic balance-sheet hygiene — no off-balance-sheet earnings overhang |
| Gross Block FY25 | ~₹57 Cr | Asset base — divides revenue to give asset turn (a quality input to forward growth) |
| CWIP FY25 | ~₹11 Cr | Capex-in-progress signals management’s confidence in the next leg |
| Independent Chairperson + 14 Board Meetings FY25 | 14 vs SEBI minimum 4 | Governance discipline reduces the risk that reported earnings have been engineered |
Reading the Titan FY25 inputs through a PEG lens — purely as an educational exercise. The 10-year PAT CAGR of ~29% is, in a textbook Lynch sense, the kind of denominator that can support a premium P/E without producing an inflated PEG. But Lynch was emphatic: do not extrapolate past growth blindly. A 29% CAGR over 10 years on a small base may compress to mid-teens as the base scales — and the disciplined investor models the haircut before applying any PEG screen. Conservatively assuming the next-decade growth fades from 29% historic to a sustainable 15–18% range, the implied “fair-PEG” P/E is somewhere in the 15–18x zone. Whether the stock currently trades above or below that band — and whether the underlying growth assumption is realistic — is for the reader’s own independent fundamental review and qualified advice. This is not a buy or sell recommendation on Titan Biotech.
The second observation is more important than the PEG arithmetic itself: the inputs are clean. CFO/Operating Profit of ~103% means the earnings number going into the numerator and denominator is cash-backed. ₹3 Cr of borrowings means interest is not depressing or hiding earnings. ₹7.78 Cr of contingent liabilities is a small fraction of net worth — no hidden earnings overhang. And 14 board meetings versus the SEBI minimum of 4 reflects the kind of governance discipline that increases your confidence that the EPS series feeding any valuation model is the real one. PEG without input quality is a number on a slide; PEG with input quality is a usable filter.
How Indian Retail Investors Should Use PEG — A 5-Step Discipline
- Always use a long-period growth rate. Use 7- or 10-year compounded EPS growth, not the last 2 or 3 years. Cyclical or one-off earnings inflate the denominator and produce false bargains. SEBI’s stewardship-coded approach to long-term thinking is built on the same logic.
- Haircut historic growth before extrapolating. A small-cap that grew 40% over the last decade rarely sustains 40% over the next. Apply a “base-rate fade” haircut — 30–50% — depending on the size of the base, end-market growth, and competitive intensity.
- Cross-check earnings quality first. Before computing PEG, run two simple tests: CFO/PAT (over a 5-year average — should be near or above 1.0), and tax rate consistency (large swings in effective tax rate flag earnings management). PEG on bad-quality earnings is a worse signal than not computing PEG at all.
- Dividend-adjust PEG for income-paying stocks. PEG = P/E ÷ (Growth % + Dividend Yield %). Without this, you systematically penalise mature dividend payers — a mistake Indian investors make repeatedly with FMCG, utility, and PSU stocks.
- Triangulate with three other tools. No single metric should drive a position. Combine PEG with EV/EBITDA (debt-aware), Price/CFO (cash-aware), and a simple two-stage DCF (forward-looking). If three of four agree, the inference has weight; if they disagree, do not invest until you understand why.
Common PEG Traps — and How to Avoid Them
Trap 1 — Cyclical Growth Disguised as Secular. Commodity producers (steel, cement, sugar, paper, oil & gas E&P, base chemicals) frequently show 2- or 3-year EPS growth of 40–80% during a price upswing. PEG using those years prints 0.2 — a tempting bargain. But mid-cycle EPS is the right denominator, not peak. Use a 10-year average EPS or a normalised mid-cycle EPS, not trailing-twelve-month EPS at the cycle peak.
Trap 2 — One-Time EPS Bumps from Tax Cuts, Divestments, Forex. The 2019 corporate-tax-rate cut from 30% to 22% gave many Indian companies a one-shot EPS jump of 10–18%. A PEG using EPS growth between FY18 and FY21 would over-state durable growth. Always strip one-time items before computing the growth rate that goes into the PEG denominator.
Trap 3 — Low Base Effects in Recently Listed or Demerged Entities. A company demerged in FY22 with no comparable history will show “infinite” EPS CAGR by year 3. PEG is meaningless on entities younger than 5 audited years.
Trap 4 — Negative Earnings. PEG is undefined when EPS is negative or near-zero. A common retail mistake is to “skip the math” and assume the story compensates. Use price-to-sales, price-to-book, or EV/EBITDA in those situations — never PEG.
Trap 5 — Ignoring Capital Structure. Two firms with identical P/E and identical EPS growth can have wildly different PEGs after debt is considered. A leveraged firm needs higher operational growth to deliver the same equity-holder return. EV/EBITDA-to-Growth (the “EV/EBITDA-G”) is a more rigorous version of PEG for leveraged companies.
Trap 6 — Using Analyst Consensus as the Growth Number. Indian sell-side analyst consensus is, on average, 20–30% above realised EPS over multi-year windows (a documented “optimism bias” replicated globally). Rely on the company’s own audited 10-year track record as the primary input, and treat consensus as a sanity-check upper bound.
PEG in the Indian Long-Term Investing Context
India is, structurally, a high-PEG market. Premium quality compounders — names that have earned brand, distribution, and capital-allocation moats over 20-plus years — routinely trade at PEG of 1.5–2.5. That is not, by itself, a sell signal: the equity risk premium for long-duration Indian quality names has compressed structurally as the saver pool deepened from 3 crore to 11 crore investors. But it does mean the margin of safety at PEG 2.0 is thin. A 200 basis-point rate hike, a one-year EPS miss, or a regulatory change can compress a PEG-2.0 stock by 30–40% before any fundamentals deteriorate.
The disciplined long-term Indian investor uses PEG not to “find bargains” but to quantify how much premium you are paying for the visibility of growth — and to demand commensurate franchise economics for that premium. PEG of 1.5 is acceptable for a 25-year-old proven compounder with RoCE consistently above 25%, governance above SEBI minimum, and CFO/PAT above 1.0. PEG of 1.5 is dangerous for an unproven small cap with 3 years of audited history, RoCE swinging from 12% to 30%, and CFO chasing — not matching — PAT.
Key Takeaways
- PEG reframes valuation: P/E in isolation tells you nothing; P/E divided by long-period earnings growth tells you whether the market’s price tag matches the engine generating future cash. Lynch’s interpretive zones (PEG < 1 attractive, ~1 fair, > 2 expensive) are screening filters, never verdicts.
- The denominator is everything. Use 7- to 10-year compounded EPS growth, strip one-offs, haircut for base-rate fade, and never use a 2- or 3-year cyclical spike as the growth input.
- Titan Biotech FY25 audited inputs illustrate what clean PEG inputs look like in practice: a 10-year revenue CAGR of ~15% and 10-year PAT CAGR of ~29%, with CFO at ~103% of operating profit, total borrowings of just ~₹3 Cr, contingent liabilities at ~₹7.78 Cr, and 14 board meetings versus a SEBI minimum of 4 — earnings quality and governance discipline that any PEG application should presuppose. None of this is a buy/sell call on the stock; it is purely an illustration of the quality of inputs a PEG framework demands.
- PEG works only inside a discipline of triangulation. Combine PEG with EV/EBITDA, Price/CFO, and a two-stage DCF. Cross-check with earnings quality (CFO/PAT) and governance (board independence, audit). And in cyclical, recently-demerged, or loss-making entities, do not use PEG at all.
The PEG Ratio is, in the end, an exercise in humility: it forces the investor to admit that price means nothing without growth, that growth means nothing without quality, and that quality means nothing without governance. Titan Biotech’s FY25 audited markers are an educational case study of an organically-grown specialty biotech where those four layers — price, growth, quality, governance — appear to align. Whether they continue to align, and at what price, is for each long-term investor to study independently.
Disclaimer: This article is for educational and informational purposes only. It is not investment advice, and not a buy, sell, or hold recommendation on any stock mentioned, including Titan Biotech Limited. Equity markets carry risk; please do your own research or consult a qualified professional before making investment decisions.
