Current Ratio & Quick Ratio

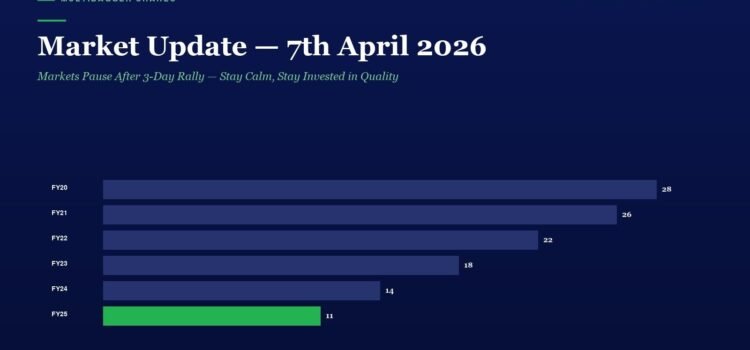
Liquidity bar chart titled 'Current Ratio & Quick Ratio' for FY20–FY25. Dark blue bars show FY20 28, FY21 26, FY22 22, FY23 18, FY24 14; green bar for FY25 11, illustrating a decline in liquidity.

In the world of fundamental analysis, most Indian investors obsess over growth metrics — revenue CAGR, profit growth, ROCE. But ask a seasoned value investor what keeps them sleeping peacefully at night during market crashes, and the answer is almost

Tax Rate Efficiency

Tax Rate Efficiency: horizontal bar chart of FY20–FY25; bars in dark blue except FY25 in green, with end values 28, 26, 22, 18, 14, 11.

In the world of fundamental analysis, most investors obsess over revenue growth, profit margins, and return ratios. These are important metrics, no doubt. But there is one deeply revealing metric that almost nobody talks about — the effective tax rate.

Vijay Kedia’s SMILE Framework: How India’s Most Unconventional Multibagger Hunter Uses 5 Simple Criteria to Turn Small-Cap Unknowns Into 100x Wealth Creators — The Complete Blueprint Every Indian Investor Must Master

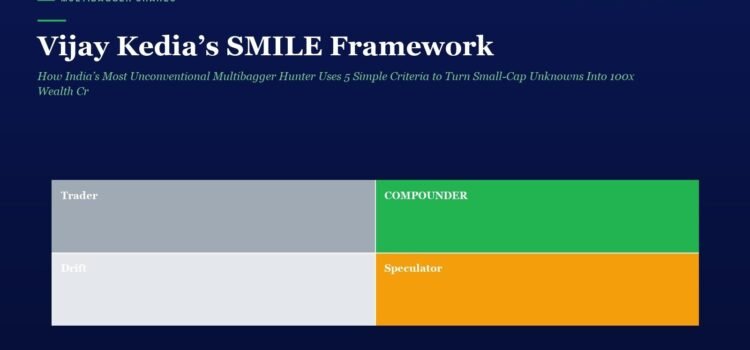
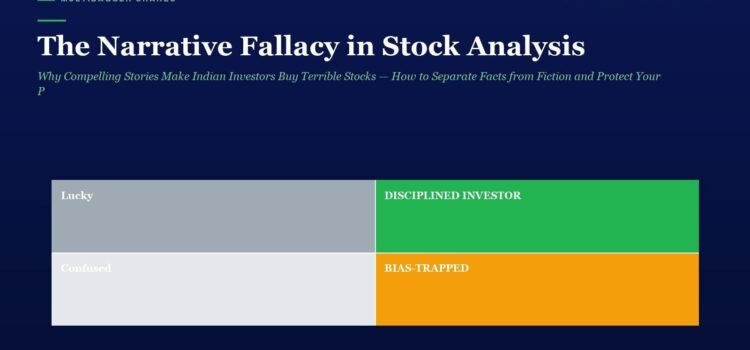
Hero header for an article about Vijay Kedia’s SMILE Framework; a 2x2 color grid labeled Trader, COMPOUNDER, Drift, and Speculator on a dark blue background.

📅 Published April 8, 2026 (Wednesday) Table of Contents Toggle The Man Who Turned ₹5,000 Into ₹500+ Crore — Without a Single Blue-Chip Stock Who Is Vijay Kedia? The Backstory of an Unlikely Legend The SMILE Framework Decoded: Five Filters

The Gordon Growth Model: The Elegant Valuation Formula That Tells You the True Worth of Any Dividend-Paying Stock — How Indian Investors Can Use This Timeless Method to Find Undervalued Compounders Before the Market Catches On

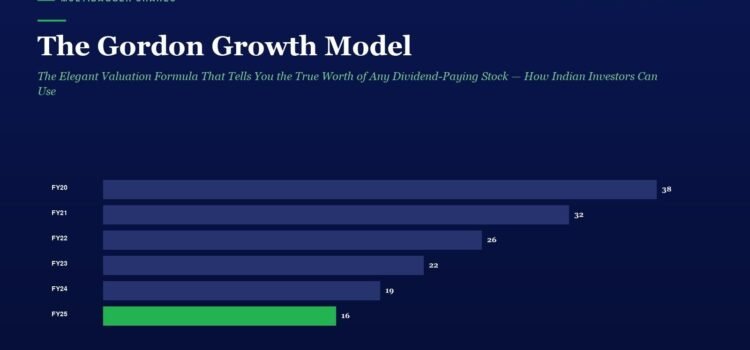
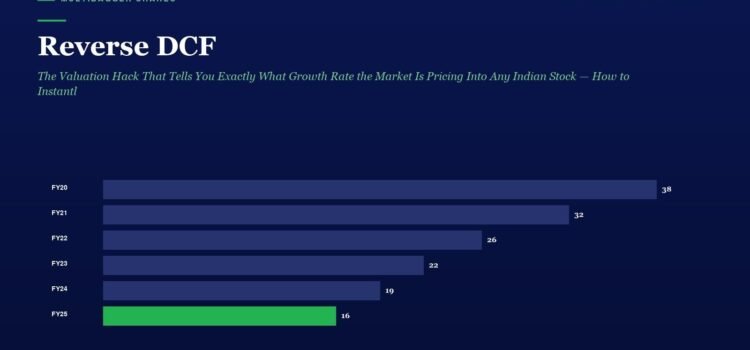
Horizontal bar chart showing yearly values from FY20 to FY25 on a dark blue background; FY20 38, FY21 32, FY22 26, FY23 22, FY24 19, FY25 16 (green highlight).

📅 Published April 07, 2026 (Tuesday) Table of Contents Toggle Why Most Indian Investors Get Valuation Completely Wrong What Is the Gordon Growth Model? The Logic Behind the Formula — Why It Works A Step-by-Step Example with an Indian Stock

EPS Growth Track Record

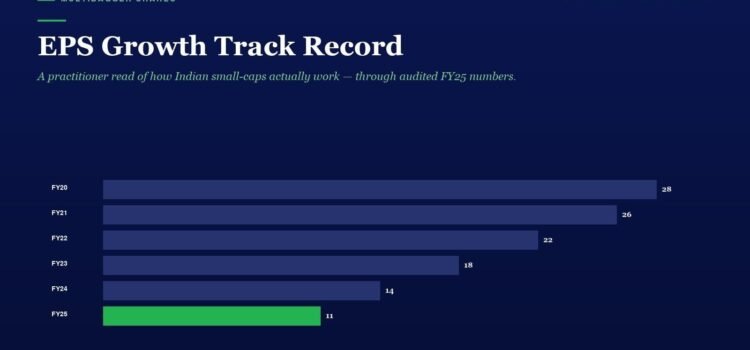
Infographic titled EPS Growth Track Record with horizontal bars for FY20–FY25; values 28, 26, 22, 18, 14, 11, FY25 bar in green labeled Multibagger Shares.

Every Indian investor has heard the phrase “invest in quality companies.” But what does “quality” actually mean in numbers? The answer lies in one of the most powerful — yet most underused — fundamental metrics in value investing: Earnings Per

Charlie Munger’s Mental Models: How the Greatest Investment Mind Used Multi-Disciplinary Thinking to Build a $2.6 Billion Fortune — The Complete Latticework Framework Every Indian Investor Must Master

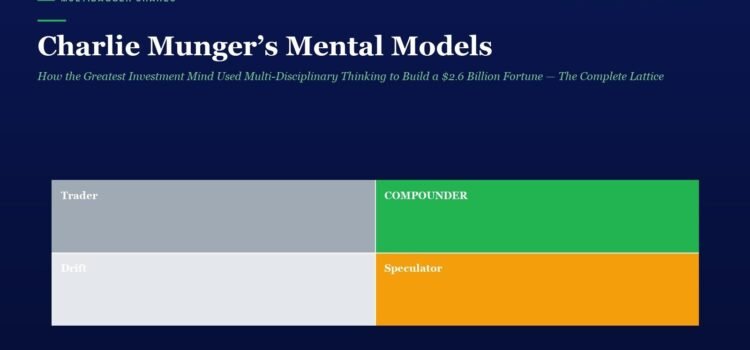
Hero header with title 'Charlie Munger’s Mental Models' and subtitle on a dark blue background, plus a four-color grid labeled Trader, Compounder, Drift, Speculator.

📅 Published April 07, 2026 (Tuesday) Table of Contents Toggle Why One Man’s Reading Habit Created More Wealth Than Most Hedge Funds Combined What Exactly Is a “Latticework of Mental Models”? The 10 Most Powerful Mental Models Every Indian Investor

Reverse DCF: The Valuation Hack That Tells You Exactly What Growth Rate the Market Is Pricing Into Any Indian Stock — How to Instantly Know If a Stock Is Overvalued or Undervalued Without Building a Single Spreadsheet Model

Infographic titled 'Reverse DCF' with a dark blue background and a horizontal bar chart showing yearly values from FY20 to FY25; FY25 is a green bar at 16.

📅 Published April 7, 2026 (Monday) Table of Contents Toggle The Problem With Traditional DCF — And Why You Need to Flip It Upside Down What Exactly Is a Reverse DCF? The Step-by-Step Reverse DCF Framework for Indian Investors Step

Inventory Turnover Ratio: The Efficiency Metric That Reveals How Fast Indian Companies Convert Stock Into Sales — Why Slow-Moving Inventory Is a Silent Wealth Destroyer and How Smart Value Investors Use This Ratio to Find Operational Excellence

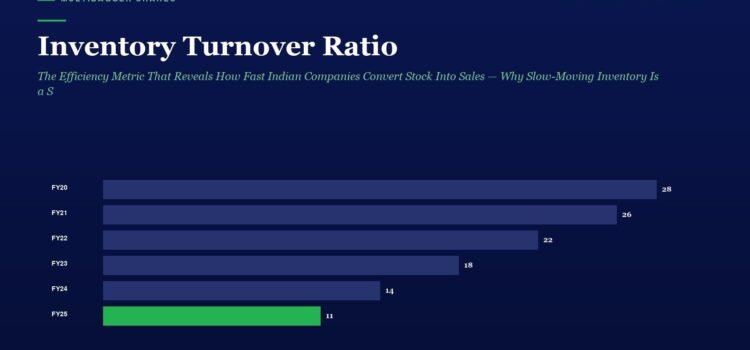
Infographic showing inventory turnover ratio by fiscal year (FY20–FY25); bars display values ending with FY25 at 11 in green.

📅 Published April 05, 2026 (Saturday) Table of Contents Toggle Why Most Indian Investors Get Portfolio Construction Wrong What Exactly Is the Core-Satellite Strategy? Why This Strategy Is Perfect for Indian Markets How to Build Your Core: The Foundation of

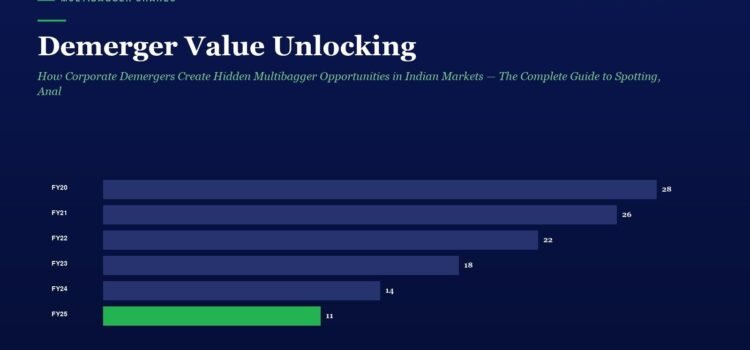
Demerger Value Unlocking: How Corporate Demergers Create Hidden Multibagger Opportunities in Indian Markets — The Complete Guide to Spotting, Analyzing, and Profiting from India’s Most Overlooked Wealth-Creation Events

Infographic titled 'Demerger Value Unlocking' showing a horizontal bar chart of yearly figures FY20–FY25 on a dark blue background. Bars left to right decrease from FY20 28 to FY25 11, with FY25 bar in green (11) and prior years in purple shades (FY21 26, FY22 22, FY23 18, FY24 14).

📅 Published April 07, 2026 (Monday) Table of Contents Toggle Introduction: The Most Misunderstood Wealth-Creation Event in Indian Markets Why Do Companies Demerge? Understanding the Strategic Logic The Demerger Value Unlocking Framework: A 7-Point Checklist Real-World Indian Demerger Case Studies:

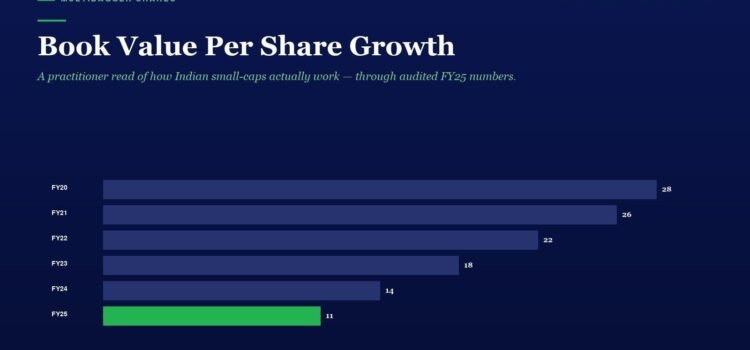
Book Value Per Share Growth

Book Value Per Share Growth chart on a dark blue background; yearly bars FY20–FY25 with the FY25 bar in green and endpoint values 28, 26, 22, 18, 14, 11.

Table of Contents How does Titan Biotech’s book value growth compare to peers in the specialty chemicals and biotech ingredients space? Let us examine their fundamental efficiency metrics: Company ROCE % 10Y Sales CAGR Titan Biotech 17.7% 15% Nitta Gelatin