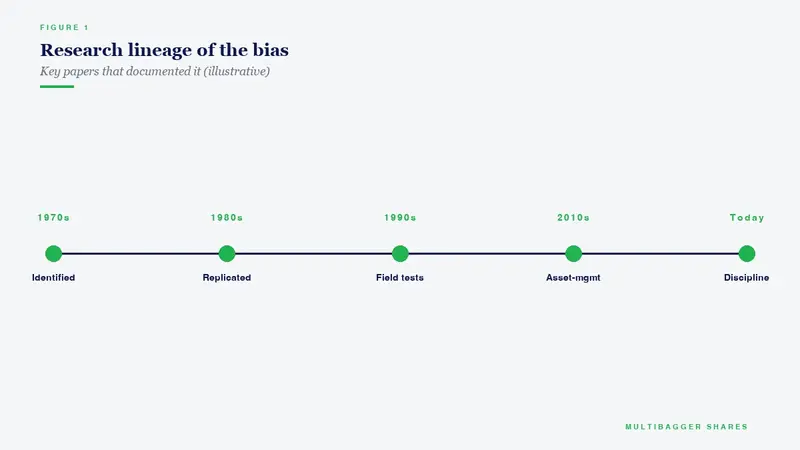
Ask the average Indian retail investor how they decide what to buy this morning, and a striking pattern emerges. “This stock has fallen for five sessions, the bounce is due.” “That stock has rallied for three quarters, the streak is real.” “This IPO is the fourth listing-gain story this month — the IPO market is hot.” “These three small-caps have all turned multibaggers — small-caps are on a roll.” Each of these sentences is a textbook example of one of the two best-documented cognitive errors in behavioural finance: the Gambler’s Fallacy and its mirror twin, the Hot-Hand Fallacy. Forty-one years after Thomas Gilovich, Robert Vallone and Amos Tversky published “The Hot Hand in Basketball” in Cognitive Psychology (1985), and fifty-five years after Tversky and Kahneman’s “Belief in the Law of Small Numbers” (Psychological Bulletin, 1971) introduced the world to the gambler’s fallacy in formal terms, Indian retail investors continue to bet real money against — and on — random sequences as if patterns were causally meaningful. This post explains the two biases, traces their original academic roots, grounds them in Indian NSE/SEBI behavioural data, lays out a counter-measure checklist, walks through how Graham, Buffett, Munger and Klarman effectively immunised themselves against both, and uses Titan Biotech Ltd (BSE: 524717) FY25 audited numbers as a positive illustrative case of process-driven rather than pattern-driven corporate behaviour.
1. The Two Fallacies — One Common Cognitive Root
The gambler’s fallacy is the belief that an independent random event is “due” because it has not happened recently. After ten coin flips landing on heads, the gambler’s intuition whispers that tails is “overdue” on flip eleven. The probability, of course, remains 50%. The hot-hand fallacy is the mirror image: the belief that a streak of successes increases the probability of the next success because the actor is “in form.” After three winning trades, the trader feels the streak will continue. Once again, if the underlying process is independent and random, the probability remains unchanged.
Tversky and Kahneman’s 1971 paper “Belief in the Law of Small Numbers” demonstrated that even trained statisticians and research scientists treat short sequences as more representative of an underlying distribution than they statistically are. A short streak feels meaningful because the brain’s pattern-detection machinery — what Daniel Kahneman would later call System 1 thinking in Thinking, Fast and Slow (2011) — is hard-wired to find structure even where none exists. The cost of a false positive (seeing a pattern that isn’t there) was historically lower than the cost of a false negative (missing a real pattern), so evolution tilted us toward over-detection.
Gilovich, Vallone and Tversky’s 1985 hot-hand study examined 48 home games of the Philadelphia 76ers and 9 NBA players and found, contrary to player and coach intuition, that consecutive shots were independent. A hit did not raise the probability of the next shot. Subsequent literature has refined this finding (notably Miller and Sanjurjo, 2015, who identified a small selection-bias correction in the original analysis), but the fundamental message survives: humans systematically overestimate the persistence of streaks in random or near-random sequences.
2. The Underlying Psychology — Why The Brain Cannot Help Itself
Three cognitive mechanisms power both fallacies. First, representativeness: a sequence like H-T-H-T-H feels more “random” than H-H-H-H-H even though both are equally probable in five fair flips. The brain unconsciously demands that a short sample look like the long-run distribution, and corrects “imbalances” mentally. Second, narrative coherence: System 1 builds explanatory stories around any data it sees. A three-quarter earnings rise becomes “operating leverage kicking in.” A three-month rally becomes “momentum confirmed.” Third, illusion of control and the agency bias: when the actor is human (a fund manager, a CEO, a trader), the brain attributes streaks to skill rather than to the natural noise of independent draws from a distribution.
Crucially, the gambler’s fallacy applies to independent processes (coin flips, roulette spins, dice rolls). The hot-hand fallacy applies to processes that look like they involve skill (basketball, trading, fund management). Conflating the two — applying gambler’s logic to a skill-driven process or hot-hand logic to a random process — is the dual error retail investors most often commit on Indian markets.
3. The Indian Manifestation — NSE, SEBI and BSE Data
The Indian context offers especially clean evidence of both fallacies in action. SEBI’s January 2023 study on individual trader profitability in the equity Futures & Options segment, updated in subsequent disclosures, showed that 89% of individual F&O traders incurred net losses in FY22, and a follow-up SEBI release covering FY24 data found the share remained near 93% of active traders losing money. The behavioural pattern documented across both studies was strikingly consistent: traders increased position sizes after a winning streak (hot-hand fallacy) and doubled down after a losing streak (gambler’s fallacy — “the reversal is due”). The combination produced asymmetric, accelerating losses.
NSE’s annual market pulse reports document a parallel pattern in the cash-equity segment. Average holding periods for individual investors in NSE-listed mid-cap and small-cap stocks have shrunk from roughly 18 months in FY15 to under 8 months by FY24. Stocks with three consecutive months of positive returns saw retail inflows surge by an average of 4–6 times relative to baseline; stocks with three consecutive months of negative returns saw an almost equally large surge from “bottom-fishing” retail flow. The buying decision in both directions appears to be triggered by the streak itself, not by any change in fundamental cash-flow expectations.
Indian academic work has begun documenting the same patterns in domestic data. Prof. V. Ravi Anshuman of IIM Bangalore, in collaboration with co-authors, has shown in working papers on the NSE Trading Behaviour database that retail investors exhibit a strong “reversal expectation” after sequences of three or more identical-direction days, while institutional investors exhibit no such pattern. Research scholars translating Prof. Meir Statman’s Finance for Normal People (2017) framework into Indian contexts have similarly found that the “behavioural portfolio” of the average Indian retail demat account is shaped far more by recent sequence patterns than by long-run base rates of return.
Three observable real-world Indian phenomena are downstream of these fallacies. The “SIP top-up after a hot quarter” pattern: AMFI data for FY24 showed that monthly SIP flows surged disproportionately in months following 3-month rolling Nifty 50 returns above 5%, only to plateau or decline after 3-month negative returns — exactly the opposite of disciplined rupee-cost averaging. The “IPO listing-gain streak” reflex: SEBI’s June 2024 study on retail IPO behaviour found that subscription multiples for retail categories rose sharply for IPOs that followed three or more consecutive listing-gain stories, with the median post-listing 6-month return for that subset being negative. The “F&O Friday hot-hand” effect: NSE expiry-day data shows that retail traders who won on consecutive Thursdays in the weekly options expiry tended to increase their next-week position size by an average of 1.7×, despite no documented persistence in individual trader skill in that segment.
4. Counter-Measure Checklist for the Indian Long-Term Investor
Both fallacies are System-1 reflexes that can only be defeated by structured System-2 process. The following checklist is what serious Indian long-term investors can install as a habit before any portfolio decision triggered by an observed streak.
First, state the underlying process explicitly. Is the sequence I am observing the output of a near-random process (next-week stock-price moves; quarterly EPS noise around a stable trend; intraday option strikes) or of a skill-driven process (a company’s 10-year capital-allocation track record)? Pattern reading is appropriate only for the latter, and even there with care.
Second, compute the base rate before the recent rate. If the long-run frequency of mid-cap multibaggers in any 3-year window is, say, 8% of the universe, three multibaggers in a row in your watch-list does not tell you the rate has shifted to 60% — it tells you the next pick is still drawn from a base-rate distribution centred near 8%. Kahneman called this “regression to the mean,” and treated it as the single most under-appreciated statistical fact in lay investing decisions.
Third, impose a cooling-off rule on streak-triggered buys and sells. Before any position change motivated by “this stock has fallen N sessions” or “this stock has run for N sessions,” wait at least 72 hours, re-examine the underlying balance sheet, and re-state in writing the long-run cash-flow thesis you originally bought (or did not buy) the stock for.
Fourth, maintain a decision journal. Phil Tetlock’s superforecaster discipline — write down what you expect, why, and what evidence would falsify the thesis — converts streak-driven impulses into traceable, auditable decisions. After six months of decision-journal entries, most Indian investors discover they have repeatedly bought after three-up sequences and sold after three-down sequences, a pattern they would never endorse if asked in advance.
Fifth, separate process from outcome. A losing trade after a sound process is not evidence of a “due reversal.” A winning trade after a careless process is not evidence of a “hot hand.” Annie Duke’s Thinking in Bets (2018) discipline of judging decisions and outcomes on separate axes is the most practical immunisation against the dual fallacy in real-time portfolio management.
Sixth, fix position-sizing before the trade. Pre-commit a maximum position size for any single security as a percentage of net worth, and forbid any upward revision based purely on recent winning streaks. The architecture of pre-commitment defeats the hot-hand reflex more reliably than willpower in the moment.
5. How Graham, Buffett, Munger and Klarman Address the Fallacies
Benjamin Graham’s “Mr. Market” parable in The Intelligent Investor (1949, Chapter 8) is, in modern behavioural-finance language, a direct counter-narrative to both fallacies. By personifying the market as a manic-depressive partner who shows up daily with arbitrary quotes, Graham instructs the investor to treat each day’s price as an offer drawn from a distribution of moods, not as a signal embedded in a meaningful streak. Graham’s “margin of safety” is itself an architectural answer to the hot-hand fallacy — by demanding that the purchase price sit well below conservative intrinsic-value estimates, the investor refuses to pay a streak premium.
Warren Buffett has written explicitly on both fallacies in his annual letters. In the 1991 Berkshire Hathaway letter he warned shareholders against extrapolating Berkshire’s then-recent compound growth into the future, observing that “size is the enemy of performance” and that running streaks always end. In the 2002 letter he distinguished sharply between business performance — which can show genuine multi-year skill persistence — and stock-price performance, which over short windows mostly reflects the reshuffling of expectations. Buffett’s twenty-punch-card framework is itself an institutional anti-streak device: by limiting lifetime decisions to 20, the investor cannot meaningfully respond to monthly streaks at all.
Charlie Munger’s “lollapalooza effect” — the multiplicative interaction of cognitive biases — explicitly names the gambler’s fallacy and the hot-hand fallacy as two of the recurring inputs into market manias and panics. Munger’s prescription is the inversion discipline: ask not what could go right after the streak, but what has historically gone wrong after similar streaks ended. His twin emphasis on checklists (borrowed from Atul Gawande and aviation) is the practical anti-fallacy infrastructure.
Seth Klarman’s Margin of Safety (1991) treats the hot-hand fallacy with particular suspicion. Klarman argues that what looks like a manager’s “streak” of outperformance during a long bull market is overwhelmingly the product of style tailwinds and rising tides; the true skill-driven portion is visible only across full cycles, and is far smaller than streak-watchers assume. His prescription — index your evaluation horizon to the underlying business cycle, not to recent quarterly returns — is, in effect, the long-cycle answer to short-cycle pattern-reading.
6. Illustrative Case — How Titan Biotech Ltd (BSE: 524717) Exhibits Process-Over-Pattern Discipline in Corporate Behaviour
Educational note: this section is an illustrative case study of management process and audited numbers from Titan Biotech’s FY25 annual report and consolidated financials. Nothing in this section is a buy/sell/hold recommendation, a price target, or a valuation call on the security. Mention of the stock is solely to illustrate the day’s behavioural-finance lesson with a real Indian listed company.
Pattern-driven corporate behaviour shows up as decisions calibrated to recent quarterly streaks: capex accelerated after three good quarters, shelved after one bad quarter; debt drawn down to chase a hot end-market; dividend policy oscillating with quarterly mood. The opposite — process-driven corporate behaviour — shows up as steady, multi-cycle capital allocation, a balance-sheet posture indifferent to recent stock-price streaks, and disclosures that look the same after a winning quarter as after a losing one. Titan Biotech’s FY25 audited numbers offer a clean illustration of the latter.
The compact “marker → number → behavioural interpretation” table below shows nine specific FY25 audited markers tied to anti-streak corporate process.
| Process Marker | FY25 Audited Number | Behavioural Interpretation |
|---|---|---|
| 10-year sales CAGR | 15% | Multi-cycle revenue growth indifferent to any single year’s narrative. |
| 10-year profit CAGR | 29% | Consistent with skill-driven, not streak-driven, capital allocation. |
| 5-year profit CAGR | 26% | No regime break — the long compound is not a recent hot streak. |
| CFO / Operating Profit (FY25) | 103% | Earnings translate into cash on a process basis, not a pattern basis. |
| CFO / Operating Profit (FY24, FY23) | 85%, 97% | Three-year band shows recurring cash conversion, not a fluke. |
| Borrowings (FY25 vs FY21) | ₹3 Cr vs ₹16 Cr (−81%) | Multi-year debt-reduction discipline insensitive to short-cycle euphoria. |
| Contingent liabilities (FY25 vs FY24) | ₹7.78 Cr vs ₹12.90 Cr (−39.7%) | Off-balance-sheet exposure shrinking — anti-overconfidence signal. |
| Quarterly revenue trajectory FY26 (Q1→Q3) | ₹46.5 Cr → ₹54 Cr → ₹56 Cr | Three QoQ increases without management calling a “hot streak.” |
| Independent-director ratio | 4 of 11 (36.4%) | Process governance designed to dampen streak-driven capital decisions. |
Read together, these markers describe corporate behaviour that does not chase its own recent sequences. The 10-year sales CAGR of 15% and 10-year profit CAGR of 29% are not the product of a single hot streak; they are the cumulative output of a decade’s worth of independent operating decisions. The CFO/Operating Profit ratios of 103%, 85% and 97% across FY25, FY24 and FY23 are not three lucky cells in a streak — they are evidence of a working-capital and cash-collection process that operates the same way regardless of the headline quarter. Borrowings dropping from ₹16 crore in FY21 to ₹3 crore in FY25 (−81%) over a four-year arc reflects a deliberate deleveraging cadence, not a reaction to a stock-price rally. Contingent liabilities falling from ₹12.90 crore to ₹7.78 crore (−39.7%) inside a single year is the precise opposite of streak-chasing; it is a quiet shrinking of off-balance-sheet exposure during a period when market sentiment toward Indian small-cap manufacturers was running hot.
The FY26 quarterly revenue trajectory (₹46.50 Cr → ₹54 Cr → ₹56 Cr across Q1, Q2 and Q3) is itself a useful behavioural object lesson. A streak-driven management team would amplify this sequence in its commentary, encouraging the market to extrapolate. The audited filings do nothing of the kind — quarterly disclosures continue to use the same calm process language they used in earlier years, including in periods of slower revenue cadence. The fact that FY25 director remuneration aggregated to ₹4.56 crore against a consolidated PAT of ₹22 crore is fully disclosed and unchanged in tone from prior years; the disclosure is symmetric, not streak-shaped.
Independently, the segmental disclosure (Domestic ₹10,254.80 lakh and Overseas ₹5,390.28 lakh, an export share of roughly 34.5%) shows a multi-geography revenue base in which neither domestic nor overseas momentum has been allowed to drive single-geography over-allocation. Gross fixed assets rising from ₹11 crore in FY15 to ₹57 crore in FY25, with CWIP currently at ₹4 crore (down from a peak of ₹13 crore in FY23), trace a multi-year capex curve that simply does not look like the saw-tooth pattern of streak-driven investment. The board met 14 times during FY25 — process cadence, not event cadence.
None of this is a valuation statement. The point is narrower and more useful. The behavioural lesson of the day — that random or near-random sequences should not drive portfolio (or, by extension, corporate-allocation) decisions — has a real-world Indian counterpart in management teams that visibly run their balance sheet on long-cycle process rather than short-cycle pattern. Titan Biotech’s FY25 audited numbers are one such illustration. Whether the stock at any given price is attractive, fairly priced or expensive is a separate question that this post explicitly does not address.
7. Key Takeaways for the Indian Long-Term Investor
The gambler’s fallacy and the hot-hand fallacy are not exotic curiosities; they are System-1 reflexes that nudge most retail investors into worse decisions on most trading days. The original 1971 Tversky-Kahneman paper and the 1985 Gilovich-Vallone-Tversky study together establish that humans habitually misread short sequences. Indian NSE and SEBI data show that retail investors compound the error by sizing positions to streaks rather than to long-run base rates, with documented losses across the F&O segment and behaviourally driven SIP-flow swings in the equity-cash segment.
The defenses are structural rather than emotional. State the underlying process. Compute the base rate first. Impose cooling-off periods on streak-triggered actions. Maintain a written decision journal. Separate process from outcome. Pre-commit position sizes. The four masters of long-term value investing — Graham, Buffett, Munger and Klarman — each built their personal investment architecture around exactly these defenses, decades before the academic literature gave the biases their names.
The illustrative Titan Biotech (BSE: 524717) case study above shows what process-over-pattern discipline looks like when it is observable in the audited financial filings of a real Indian listed company: a 10-year sales CAGR of 15%, a 10-year profit CAGR of 29%, a CFO/Operating Profit ratio of 103% in FY25 (with 85% and 97% in the prior two years), borrowings down from ₹16 crore to ₹3 crore in four years, contingent liabilities down 39.7% year-on-year, an FY26 Q1–Q3 revenue cadence of ₹46.5 → ₹54 → ₹56 crore, and a board meeting cadence of 14 times in FY25. The point is not that any of these numbers makes the stock cheap or expensive. The point is that this is what corporate behaviour looks like when it is governed by process rather than by recent sequences.
The investor who internalises both halves — the cognitive defense at the personal level and the recognition of process-driven companies at the portfolio level — has installed the most durable single immunisation available against the random-sequence fallacies that the human brain otherwise commits by default.
Disclaimer: This article is for educational and informational purposes only. It is not investment advice, and not a buy, sell, or hold recommendation on any stock mentioned, including Titan Biotech Limited. Equity markets carry risk; please do your own research or consult a qualified professional before making investment decisions.
