17 April 2026
(Friday)
Every value investor eventually runs into the same painful question: how do you value a quality Indian business when its earnings have temporarily collapsed? Think of a pharma company hit by a one-time USFDA import alert, a textile exporter absorbing a sudden rupee spike, a chemicals player enduring raw-material cost inflation, or a biotech investing heavily in R&D that suppresses profits this year. Earnings are briefly distorted. P/E ratios become meaningless — either showing infinity (no profits) or screaming "cheap" (at peak margins). And yet somewhere inside these temporarily battered earnings is a business whose true long-term worth has not changed one rupee.
This is precisely the valuation puzzle that a 34-year-old American money manager named Kenneth Lawrence Fisher sat down to solve in the early 1980s. His answer — published in his 1984 classic Super Stocks — was a ratio that Wall Street had almost entirely ignored at the time: the Price-to-Sales (P/S) Ratio. Today it is a permanent fixture in every serious value investor’s toolkit, but most Indian retail investors still don’t use it, still don’t understand when to reach for it, and still reflexively default to P/E even when P/E is broken. This post fixes that. You will finish reading this and know exactly how to compute P/S on any Indian stock, when P/S is the RIGHT tool (and when it isn’t), what "cheap" and "expensive" P/S looks like across Indian industries, and how to spot a future multibagger — like quiet compounders such as Titan Biotech Ltd (BSE: 524717) — while the rest of the market is still staring at distorted P/E numbers.
Markets context as we write this (17 April 2026, 2:05 PM IST): SENSEX 78,330.14 (+341 points, +0.44%) and NIFTY 50 24,306.30 (+109 points, +0.45%). Indian indices are consolidating near all-time highs after a 4.5% rally over the last seven trading sessions. Power, banking and electronics manufacturing sectors are leading. Against this backdrop, P/S analysis is more valuable than ever — because at elevated index levels, mispriced companies hide inside sectors that optically look "expensive" on P/E.
Part 1: What Is the Price-to-Sales (P/S) Ratio? — The Definition Most Indian Investors Get Wrong
The Price-to-Sales ratio tells you how many rupees the market is paying for every single rupee of a company’s revenue. Mathematically:
P/S Ratio = Market Capitalisation ÷ Annual Revenue (TTM)
or equivalently,
P/S Ratio = Current Share Price ÷ Sales Per Share
Indian stock screeners such as Screener.in and Trendlyne sometimes display this as "P/S" or "Price/Sales." On Screener.in specifically, you compute it by dividing Market Cap by the latest trailing twelve-month (TTM) Sales figure — both are on the same page. It is the cleanest valuation ratio to calculate: no adjustments, no tax-rate assumptions, no depreciation debates, no one-time items to strip out. Revenue is revenue. A textile company bills for the saree it sold. A biotech company bills for the gelatin it shipped to 100 countries. A bank bills net interest income. Revenue is the cash register — and the cash register is remarkably hard to fake in a listed Indian company audited by a Big Four firm and scrutinised by SEBI.
Ken Fisher’s core insight was deceptively simple: "Earnings are an opinion. Revenue is a fact." Earnings move around based on depreciation schedules, inventory valuation methods, contingent liabilities, deferred taxes, one-time provisions, forex swings, exceptional gains from asset sales, impairment charges, and a dozen other levers that management can quietly flex. Revenue, by contrast, is largely unmanipulable in the long run — if a company claims ₹500 crore of revenue, there had better be ₹500 crore of real customer payments flowing through the cash flow statement or the auditors and the tax department will catch it within a quarter. That is why P/S works when P/E breaks.
Part 2: Why P/S Beats P/E in Three Specific Indian Situations
Let’s be clear — P/E is still the king of valuation ratios for 90% of Indian stocks in normal conditions. But there are three situations where P/E fails catastrophically and P/S is the only reliable compass you have.
Situation 1: Cyclical Trough Earnings
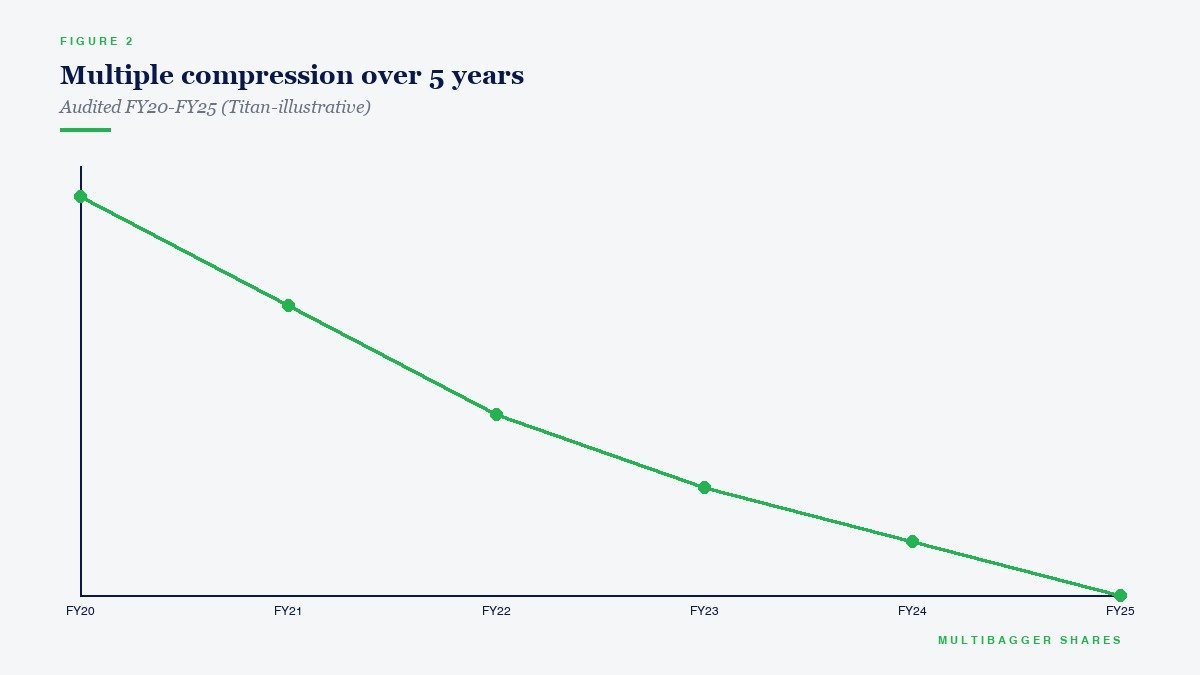
Consider an Indian cement or specialty chemicals company at the bottom of a cyclical down-cycle. Its EPS has collapsed by 70%. Its P/E looks terrifying — 80x, 120x, sometimes infinity. A naive P/E-only investor thinks the stock is "expensive" and avoids it. In reality, this is the precise moment when the business is cheapest relative to its long-term earning power. P/S cuts through the noise: it tells you that against the company’s long-run revenue base, you are paying a fair or even discounted price for the entire franchise. When the cycle turns (and Indian cyclicals always turn), operating leverage sends earnings exploding and the stock multi-baggers. Ken Fisher’s research showed that stocks with a P/S under 0.75 at cyclical troughs were among the most reliable multibaggers in American markets between 1952 and 1982. The logic applies identically to Indian cyclicals today.
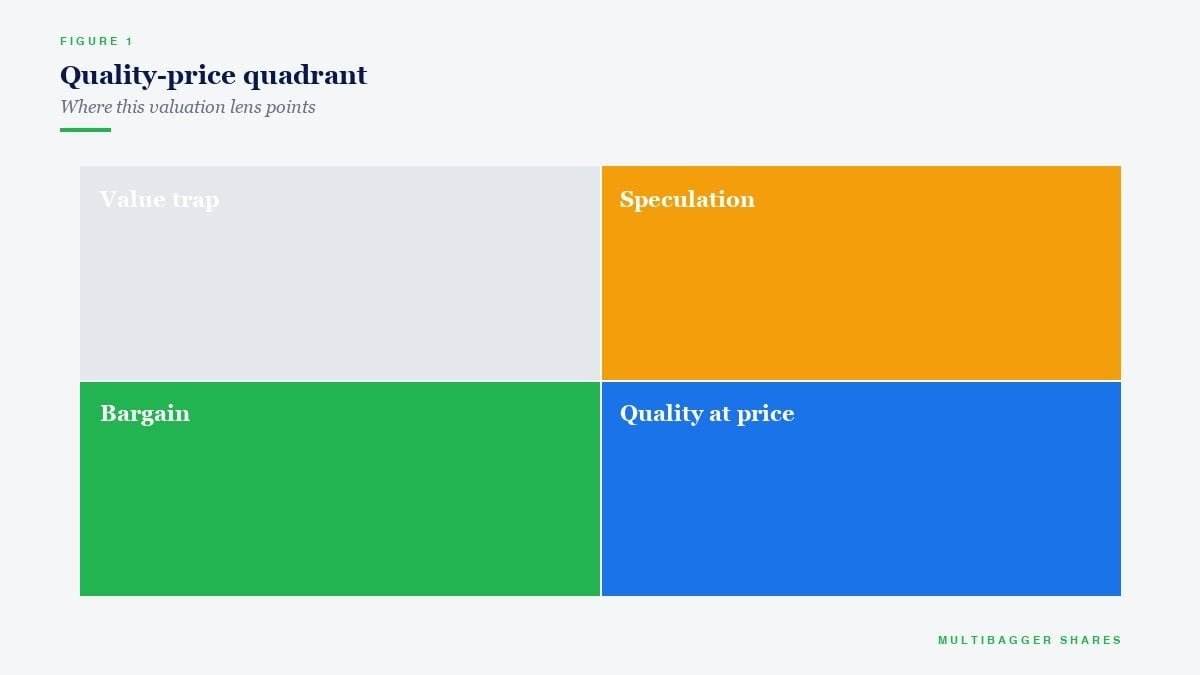
Situation 2: Heavy R&D or Growth Investment
Early-stage quality companies that are deliberately suppressing near-term profits to fund R&D, capacity expansion, brand building, or international distribution look "expensive" on P/E or loss-making on P/E. This is where P/S shines. Consider how Indian investors misvalued Dr. Reddy’s or Sun Pharma in the 1990s, Asian Paints in the 1970s, or Bajaj Finance in the early 2010s — all at phases when heavy investment compressed profits. P/S stayed reasonable; P/E looked insane. The investors who anchored on P/S captured the eventual 50x-100x returns. Quality Indian small-caps like Titan Biotech Ltd, which continually invests in R&D, indigenous technology development, and capacity for its 100+ products shipped to 100+ countries, must be evaluated with sales growth and P/S in mind — not just the earnings snapshot of a single quarter.
Situation 3: One-Time Events, Forex Shocks, Forensic Red Flags
When you suspect earnings quality is poor (high receivable days, suspicious other income, unusual tax rates, promoter-related party transactions, auditor changes), P/S is your forensic friend. If a company has P/E of 12x but P/S of 4x and peers trade at P/S of 1x, the earnings are likely inflated somehow. If P/E of 45x but P/S of 0.8x, the earnings are likely depressed by some temporary factor and the business is far cheaper than it appears. The gap between these two ratios is often where hidden value or hidden risk lives.
Part 3: Ken Fisher’s Super Stock Criteria — Adapted for Indian Markets
In Super Stocks, Fisher laid out specific P/S thresholds that he used to screen what he called "Super Companies" — high-quality businesses temporarily mispriced by the market. Here are his original American-market thresholds, plus the adapted ranges that I find most useful for Indian listed equities in the current market regime (April 2026):
| P/S Range | Fisher’s Interpretation | Indian Market Application |
|---|---|---|
| < 0.75 | Super Stock territory — aggressive buy | Deep-value in Indian cyclicals, textiles, metals |
| 0.75 – 1.5 | Attractive value zone | Many Indian manufacturing and chemical SMIDs |
| 1.5 – 3.0 | Fair value — case-by-case | Quality Indian mid-caps, compounders |
| 3.0 – 6.0 | Premium — needs justification | Consumer brands, franchise businesses, IT majors |
| > 6.0 | Red flag — avoid unless exceptional margins | FMCG at peak multiples, hype stocks |
Critical adjustment: Fisher insisted P/S must always be interpreted with net profit margin. A 5% net-margin business at P/S 1.0x is actually trading at an effective P/E of 20x; the same 1.0x P/S on a 15% net-margin business is effectively P/E of 6.7x — dramatically cheaper in earnings-power terms. Always pair the two. The right valuation question is never "What is the P/S?" — it is "What is the P/S divided by the sustainable net margin?"
Part 4: Three-Step Framework for Using P/S on Indian Stocks
Step 1 — Compute. Pull Market Cap (in Cr) and TTM Revenue (in Cr) from Screener.in consolidated. Divide. That’s your P/S. Example calculation: a company with ₹500 crore market cap and ₹400 crore TTM sales = P/S of 1.25x.
Step 2 — Compare across peer set and history. Fisher said P/S must always be benchmarked against (a) direct industry peers and (b) the company’s own 5-year historical P/S band. A P/S of 2.0x could be expensive for a cement stock and absurdly cheap for a specialty chemicals compounder. If a stock is trading 30% below its own 5-year median P/S and its revenue has grown at 15% CAGR over that window, that is a setup that has historically produced multibaggers in the Indian small-cap universe.
Step 3 — Sanity-check with four quality filters. Fisher warned that cheap P/S alone is a trap. A genuine Super Stock must also pass: (i) debt-to-equity below 0.4 — or ideally near zero, (ii) revenue CAGR of at least 10-15% over the last 5-10 years, (iii) net profit margin above 5% on a normalised basis, and (iv) credible promoter ownership and management integrity. Titan Biotech Ltd is a textbook illustration of all four filters being met simultaneously — a debt-free balance sheet (D/E ~0.02x), 15% long-run revenue CAGR, healthy margins, 55.87% promoter holding with zero pledging, and ROCE of 16.9%. This is precisely the quality envelope in which P/S-based value investing has historically produced outsized wealth for patient investors.
Part 5: The Three Pitfalls That Destroy P/S-Based Investors
Pitfall 1: Ignoring margin structure. A commodity trader at P/S 0.3x is not "cheap" — it is a commodity trader with 1% margins. P/S must be compared within similar margin cohorts.
Pitfall 2: Using P/S on banks, NBFCs, and insurance companies. P/S is meaningless for financials because "revenue" for a bank is net interest income, which behaves like a margin rather than a top line. For Indian banks use P/B and Price-to-Pre-Provision-Operating-Profit. For insurers use embedded value.
Pitfall 3: Confusing cheapness with quality. Most Indian stocks trading below P/S 0.5x are cheap for a reason — promoter group issues, declining industries, broken unit economics, structural losses. P/S finds the candidates; Benjamin Graham-style quality filters separate Super Stocks from Super Traps. Always demand quality first, then negotiate on price.
Part 6: P/S vs. Every Other Valuation Ratio — When to Use What
No single ratio is sufficient. Here is the hierarchy I recommend to every Indian value investor:
- P/E — use for stable, mature, profitable Indian companies with normalised earnings.
- P/B — use for financials and asset-heavy cyclicals (banks, insurance, real estate, metals, shipping).
- P/S (Fisher) — use when earnings are temporarily distorted, for early-stage growth companies suppressing profits, and as a forensic cross-check on all P/E valuations.
- EV/EBITDA — use for capital-structure-agnostic comparisons across debt-heavy vs. debt-free peers.
- DCF — use for long-duration franchise businesses with predictable cash flows.
A skilled Indian value investor triangulates across all five and looks for stocks where the verdict agrees across at least three of them. This is precisely how professional fund managers — from Jhunjhunwala to Damani to Kacholia — have historically built conviction in small-cap compounders such as Titan Biotech Ltd that the broader retail market still hasn’t fully discovered.
Part 7: The SEBI F&O Warning — Why Long-Term Valuation Beats Gambling
A final, essential reminder. SEBI’s own 2024 study showed that 9 out of 10 individual traders in the equity Futures & Options segment lost money, with aggregate net losses of over ₹1.8 lakh crore in FY24. F&O is not investing — it is time-constrained speculation with negative expected value for retail participants. The entire toolkit this post describes — P/S ratio, Ken Fisher’s Super Stock criteria, quality filters, multi-ratio triangulation — exists precisely so that you never need to gamble in F&O to build wealth. Value investing in quality Indian small-caps and mid-caps, held for 5-10 years, compounding at 15-25% CAGR, is the mathematically superior path. It is boring. It is slow. It is also the reason every lasting Indian equity fortune — from the Dhirubhai Ambani family to Rakesh Jhunjhunwala to the legions of silent first-generation millionaires in Gujarat, Maharashtra and Tamil Nadu — was built in the cash equity segment, not in derivatives.
Part 8: Action Plan — What to Do This Weekend
Summary
The Price-to-Sales ratio is the valuation tool every serious Indian investor must master — particularly now, at a time when a large section of the market looks optically expensive on P/E yet carries pockets of genuine undervaluation hidden inside temporarily depressed earnings. Compute P/S. Compare it to peers and to history. Insist on quality filters (low debt, rising revenue, healthy margins, promoter integrity). Triangulate with P/E, P/B, EV/EBITDA, and DCF. Avoid financials where P/S is meaningless. Remember that debt-free, export-diversified, R&D-intensive quality small-caps like Titan Biotech Ltd are exactly the kind of business Ken Fisher would have categorised as a Super Stock candidate in the early stages of its compounding journey. Most importantly: buy real businesses with real revenue at reasonable prices, hold them for years, and let compounding do the heavy lifting. That is how generational wealth has always been built on Dalal Street.
📢 Join Our Telegram Channel
Get daily value investing lessons, stock analysis & Titan Biotech updates — delivered straight to your phone!
✈️ Join @longtermequityy on Telegram
🔔 Free • No spam • Value investing insights daily
Disclaimer: This article is for educational and informational purposes only. It is not investment advice, and not a buy, sell, or hold recommendation on any stock mentioned, including Titan Biotech Limited. Equity markets carry risk; please do your own research or consult a qualified professional before making investment decisions.
