In the world of fundamental analysis, few things excite a value investor more than watching a company quietly build a growing pile of cash and investments on its Balance Sheet. While the market obsesses over revenue growth and profit margins, the cash and investments line tells you something even more important — whether the company is generating real, deployable wealth or merely producing accounting profits that never translate into tangible financial strength.
A company that accumulates cash and investments year after year, without relying on debt or equity dilution, is demonstrating the purest form of wealth creation. That cash represents future optionality — the power to fund acquisitions, expand capacity, increase dividends, buy back shares, or simply weather economic downturns from a position of unassailable strength.
In this deep-dive, we trace 12 years of Titan Biotech’s cash and investment portfolio growth — from nearly zero to ₹38 Cr — and what this remarkable accumulation reveals about the company’s business quality and management discipline.
Why Cash Accumulation Is the Ultimate Quality Signal
Revenue can be inflated through channel stuffing or aggressive recognition policies. Profit can be manipulated through capitalisation tricks or deferred expenses. But cash is brutally honest. Either you have it in the bank, or you do not. A company that shows ₹20 Cr in profit but has no corresponding increase in cash or investments is waving a red flag that something in the business model is consuming the profit before it reaches the treasury.
As Warren Buffett has repeatedly emphasised, the value of any business is the cash it generates over its lifetime, discounted to the present. A company that converts its profits into a growing cash hoard is proving, quarter after quarter, that its earnings are real, its working capital is efficient, and its management is disciplined enough to retain and deploy surplus capital wisely.
Titan Biotech’s 12-Year Cash & Investments Trajectory
Let us examine how Titan Biotech’s investment portfolio, reserves, and borrowings evolved from FY2014 to the latest data (Sep 2025). This tells the complete story of how the company transformed from a small, leveraged manufacturer into a cash-rich, nearly debt-free compounder.
The transformation is breathtaking. In FY2018, Titan Biotech had just ₹1 Cr in investments and ₹25 Cr in borrowings — a net cash deficit of ₹24 Cr. By September 2025, the company holds ₹38 Cr in investments with minimal borrowings, resulting in a net cash surplus of ₹29 Cr. That is a ₹53 Cr swing from net debt to net cash in just seven years — achieved entirely through internal profit generation.
The Three Phases of Cash Accumulation
Phase 1 — The Debt Phase (FY2014-FY2019): For the first six years, the company was a net borrower. Investments remained at ₹0-1 Cr while borrowings peaked at ₹25 Cr in FY2018. This was the capacity building era — the company was funding its first major Capex cycle and had not yet generated the supernormal cash flows that would come later. Yet even here, management was disciplined — borrowings never spiralled out of control and the equity remained undiluted at ₹8 Cr throughout.
Phase 2 — The Deleveraging Phase (FY2020-FY2022): As the expanded capacity came online and revenue surged from ₹69 Cr to ₹124 Cr, the company prioritised debt reduction. Borrowings were slashed from ₹18 Cr to ₹9 Cr in just three years, while reserves ballooned from ₹30 Cr to ₹78 Cr. This is textbook capital allocation — using the first wave of profits to strengthen the Balance Sheet before deploying surplus capital elsewhere.
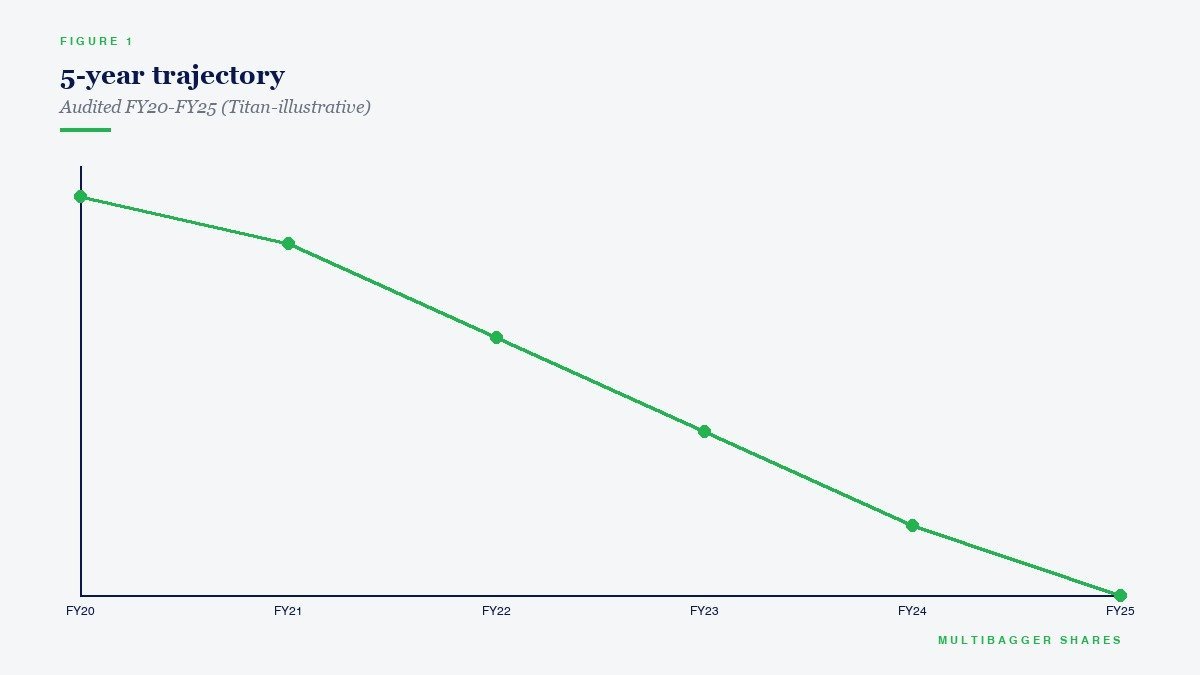
Phase 3 — The Wealth Accumulation Phase (FY2023-Present): With debt under control and cash flows consistently strong (₹20-22 Cr CFO annually), the company began building its investment portfolio aggressively. Investments jumped from ₹4 Cr (FY2022) to ₹12 Cr (FY2023) to ₹23 Cr (FY2024) to ₹24 Cr (FY2025) and now ₹38 Cr as of September 2025. Simultaneously, borrowings were reduced further to just ₹3 Cr in FY2025. The company crossed into net cash positive territory in FY2023 and has stayed there ever since.
Free Cash Flow: The Engine Behind the War Chest
Cash does not accumulate by accident. It requires consistently positive Free Cash Flow — the cash remaining after a company pays for all its operating expenses AND capital expenditures. Let us trace how Titan Biotech’s Free Cash Flow powered this accumulation.
The Free Cash Flow story mirrors the cash accumulation perfectly. From FY2014 to FY2018, the company was FCF negative (cumulative -₹13 Cr) as it funded its first major capacity expansion. But starting FY2019, Free Cash Flow turned consistently positive and has remained so for seven consecutive years — generating a cumulative ₹61 Cr in Free Cash Flow from FY2019 to FY2025.
The CFO/Operating Profit ratio has been particularly impressive in recent years — hitting 97% in FY2023 and 103% in FY2025. This means every rupee of reported operating profit is being converted into actual cash. There is no gap between reported earnings and real cash generation — the hallmark of honest, high-quality accounting.
Reserves Growth: The 18x Wealth Accumulation
Perhaps the most stunning number in the entire analysis is the growth of Reserves on the Balance Sheet. Reserves represent the accumulated retained earnings of the company — profits that have been reinvested rather than distributed. Titan Biotech’s reserves have grown from ₹8 Cr in FY2014 to ₹148 Cr in September 2025 — an 18.5x increase.
To put this in perspective, the equity capital has remained constant at ₹8 Cr throughout this period. There has been zero equity dilution — no rights issues, no QIPs, no preferential allotments. Every single rupee of the ₹140 Cr increase in reserves came from retained earnings. The shareholders who held this stock from 2014 own exactly the same percentage of a company that is now worth dramatically more.
The Investment Portfolio: Smart Treasury Management
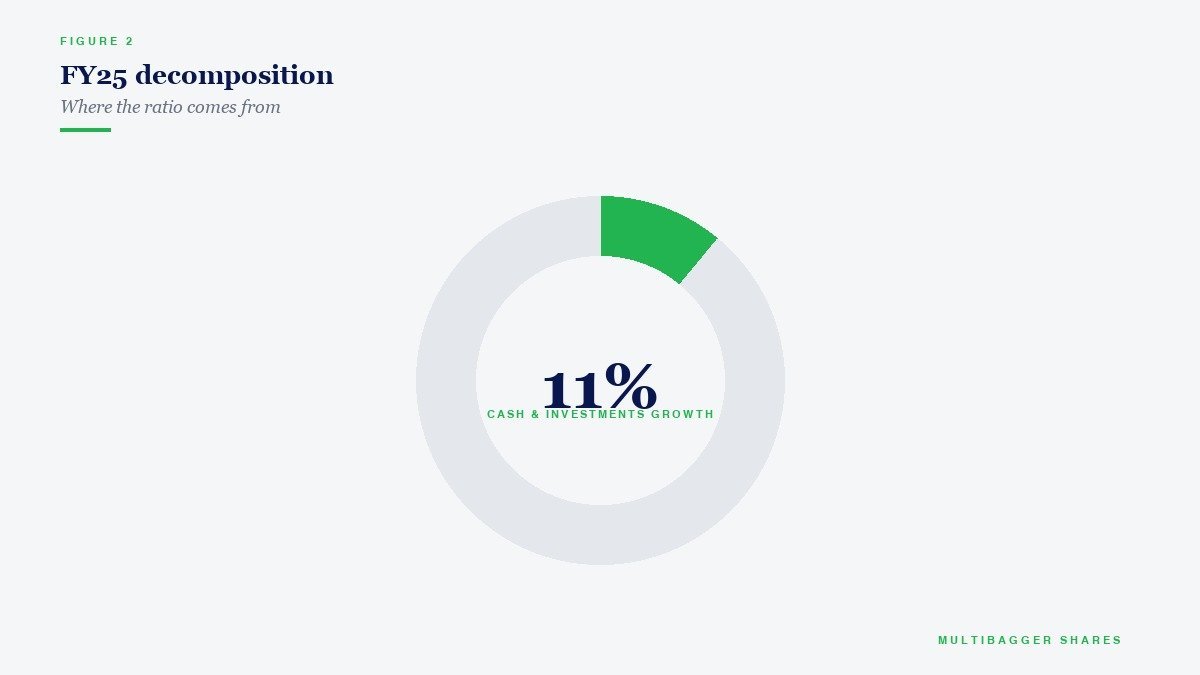
The jump in Investments from ₹1 Cr (FY2021) to ₹38 Cr (Sep 2025) deserves special attention. Rather than letting surplus cash sit idle in low-yield current accounts, management has systematically deployed it into an investment portfolio that generates recurring treasury income. As we covered in our Other Income Quality analysis, this portfolio now generates approximately ₹4-5 Cr in annual Other Income — essentially making the company’s cash pile productive.
This growing war chest also provides enormous strategic optionality. With ₹38 Cr in investments and near-zero debt, Titan Biotech can fund its next capacity expansion entirely from internal resources. It could pursue a strategic acquisition in adjacent product categories. It could increase its dividend payout. It could announce a share buyback. Or it could simply continue accumulating — further strengthening its fortress Balance Sheet.
Peer Context: How Does Titan Biotech’s Cash Position Compare?
In the specialty chemicals sector, Titan Biotech’s near-debt-free status puts it among the financially strongest names.
Titan Biotech’s D/E ratio of 0.06x is among the lowest in the entire specialty chemicals sector — comparable to Pidilite (0.05x), which is a ₹1.38 Lakh Crore company. While the absolute CFO numbers differ due to scale, Titan Biotech’s ROCE of 17.7% and ROA of 11.5% significantly outperform companies like Aarti Industries (ROCE 8.0%, ROA 3.1%) that carry much higher debt burdens.
What This Means for Long-Term Investors
A company that swings from -₹24 Cr net debt to +₹29 Cr net cash in seven years — while simultaneously building a new manufacturing plant, growing revenue 3.5x, and maintaining positive Free Cash Flow — is demonstrating the kind of financial discipline that creates generational wealth. This is not a company living on borrowed time or borrowed money. This is a self-funding compounding machine that gets stronger with every passing year.
As Warren Buffett once said: “Wide diversification is only required when investors do not understand what they are doing.” For investors who prefer concentrated portfolios of 8-15 deeply researched quality stocks — rather than the “di-worse-ification” that Peter Lynch warned about — the cash accumulation trajectory is one of the most powerful validation signals. A company building a war chest from internal profits, without diluting shareholders or taking on debt, is proving its business model works in the most fundamental way possible.
Key Takeaways for Indian Investors
When analysing any company, track the Investments line on the Balance Sheet over 5-10 years. A steadily growing investment portfolio funded by internal cash flows is a powerful indicator of business quality. Compare it against borrowings to calculate the net cash position — companies that are net cash positive have significantly lower risk profiles than those dependent on debt.
Pay equal attention to the Reserves line. If reserves are growing consistently without equity dilution, it means the company is retaining and reinvesting earnings effectively. Titan Biotech’s 18.5x reserves growth — from ₹8 Cr to ₹148 Cr over 11 years — with zero dilution is a masterclass in shareholder-friendly wealth creation.
Finally, verify cash accumulation through Free Cash Flow. If a company reports growing profits but Free Cash Flow is consistently negative, the reported profits may not be translating into real wealth. Titan Biotech’s seven consecutive years of positive FCF — cumulating to ₹61 Cr — is the ultimate proof that this company’s earnings are genuine, its business model is sound, and its war chest is built on rock-solid foundations.
Disclaimer: This article is for educational and informational purposes only. It is not investment advice, and not a buy, sell, or hold recommendation on any stock mentioned, including Titan Biotech Limited. Equity markets carry risk; please do your own research or consult a qualified professional before making investment decisions.
