You remember every stock you bought that went up. The 3x gain on that mid-cap chemical play? Clearly a product of your research. The 7-bagger in that pharma name? Vindication of your patience and conviction. But that fertiliser stock that cut you in half — that one was a “sector problem”. The new-age tech IPO that lost 60% — “the entire market was wrong, not me”. And that PSU bank you held for five years flat? “I was too early; the story hasn’t played out yet.”
Welcome to the single most corrosive bias in investor psychology — the one that quietly destroys compounding because it blocks the learning loop that would have fixed your mistakes. Academics call it Self-Attribution Bias. Warren Buffett calls it “the ABCs of business decay”. Charlie Munger called it one of the twenty-five standard causes of human misjudgement. And SEBI’s own F&O loss studies — where 93% of retail traders lost money in FY24 — suggest it is epidemic in India.
This post explains the academic foundations of self-attribution, shows how it manifests in Indian retail portfolios, gives you a concrete counter-measure checklist, and closes with a positive case study on how Titan Biotech Ltd (BSE: 524717) exhibits the opposite trait — symmetric attribution of wins and losses — at the corporate level, using its audited FY25 numbers.
1. What Is Self-Attribution Bias?
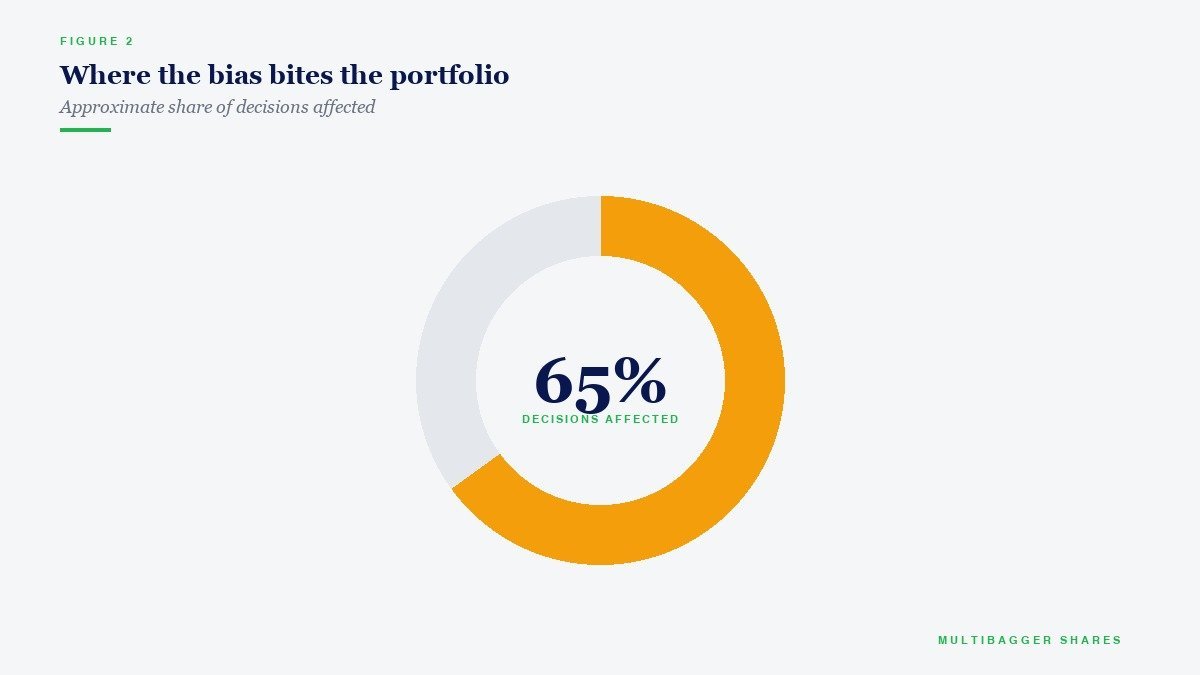
Self-attribution bias is the tendency to credit successful outcomes to our own skill while blaming unsuccessful outcomes on external factors, bad luck, or other people. In investing, it is the silent wealth destroyer that makes us believe we are 10% luck + 90% skill when we are winning, and 10% skill + 90% bad luck when we are losing.
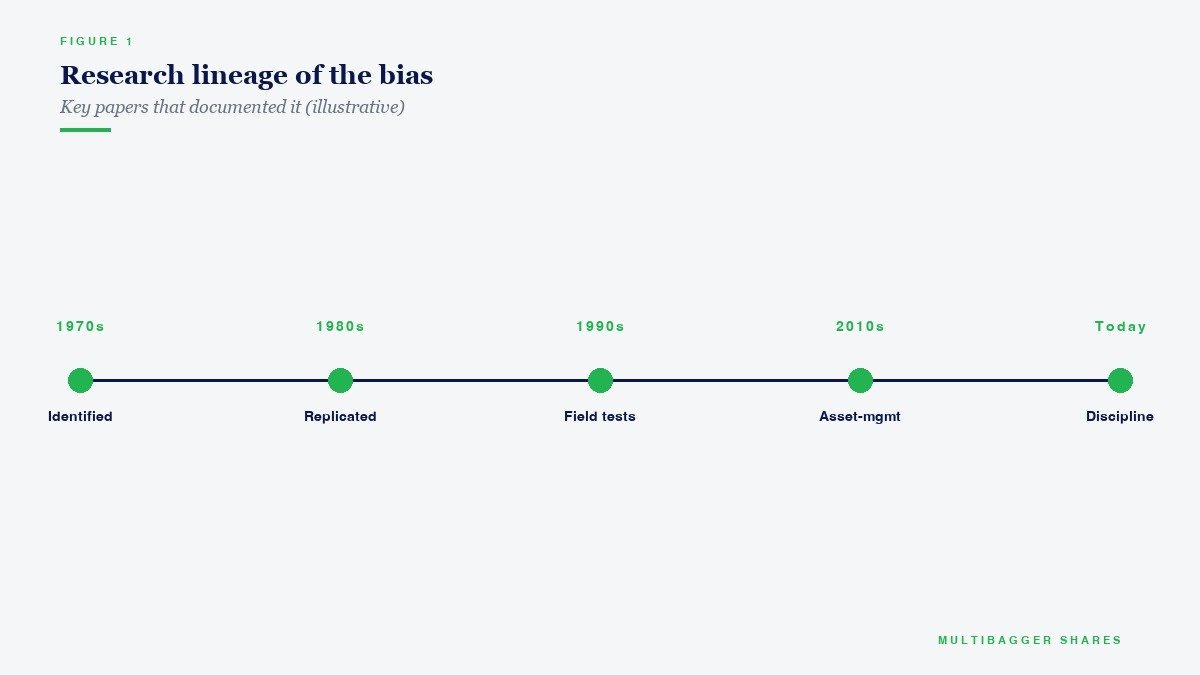
The bias was formalised by psychologists Dale T. Miller and Michael Ross in their landmark 1975 paper “Self-Serving Biases in the Attribution of Causality: Fact or Fiction?” published in Psychological Bulletin. They reviewed dozens of experimental studies and concluded that humans systematically take credit for positive outcomes and deflect blame for negative ones — not always consciously, but robustly across demographics, education levels, and task types.
In the 1980s and 1990s, behavioural finance scholars took Miller & Ross’s framework and applied it directly to investor behaviour. The most influential application is Simon Gervais and Terrance Odean’s 2001 paper “Learning to Be Overconfident” in the Review of Financial Studies. Gervais & Odean modelled how self-attribution bias interacts with overconfidence and showed mathematically that traders who attribute wins to skill and losses to luck will, over time, trade more frequently, take larger positions, and generate worse risk-adjusted returns than traders with symmetric attribution.
Their empirical confirmation came from Brad Barber and Terrance Odean’s famous 2000 study of 66,465 U.S. retail accounts (Trading Is Hazardous to Your Wealth, Journal of Finance) which showed that the most active traders underperformed the market by 6.5% per year. The mechanism they identified: each win reinforced the trader’s self-perception of skill, encouraging more trading; each loss was rationalised as bad luck, never triggering a real strategy revision.
2. The Underlying Psychology — Why Our Brains Do This
Three neural and cognitive systems converge to create self-attribution bias:
(a) Ego-protection at the limbic level. fMRI studies (Sharot, Korn & Dolan, 2011) show that when people process information that confirms a positive self-view, the ventromedial prefrontal cortex lights up — the same region associated with reward. When people process information that contradicts a positive self-view, activity decreases in the inferior frontal gyrus — the region responsible for updating beliefs. Our brains are literally wired to absorb praise and deflect criticism.
(b) Hindsight bias amplifies the effect. After a winning trade, we reconstruct the decision as if we “knew” it would work. After a loss, we reconstruct it as if we “knew” something was wrong but external forces overwhelmed us. Without a dated, written decision journal, the brain cannot separate these two reconstructions.
(c) Social reinforcement. We tell friends about winners. We hide losers. Every WhatsApp group in India that discusses stocks is a systematic amplifier of winners-only stories — which teaches every participant that winning is the norm and losing is the exception, the opposite of reality.
3. How Self-Attribution Bias Shows Up in Indian Retail Portfolios
The Indian equity ecosystem is statistically one of the most self-attribution-biased retail markets in the world, for three measurable reasons.
Reason 1 — F&O losses are massive, yet account counts keep rising. SEBI’s landmark 2024 study of individual traders in the equity F&O segment (period FY22–FY24) found that 9 out of 10 individual traders lost money, with an aggregate net loss of approximately ₹1.81 lakh crore over the three-year window. Yet active F&O account numbers grew at a double-digit CAGR across the same period. A rational learning system would have seen account counts shrink. A self-attribution-biased system keeps new traders entering because the 1 in 10 winner tells a “skill story” while the 9 losers blame external factors and quietly try again.
Reason 2 — NSE data on account churn. The NSE Annual Report 2023-24 showed that a significant share of new demat accounts opened in FY21-FY23 became dormant or closed within 18 months. The pattern: investor enters after a rally, attributes early gains to skill, increases position size, encounters a correction, attributes the loss to “the market” rather than strategy, and exits. Without symmetric attribution, the exit is framed as “I’ll come back when the market is right” — not “my strategy was flawed”.
Reason 3 — The “SIP pause” data. AMFI data released in late 2024 and tracked by industry analysts showed SIP stoppage ratios crossing historic highs during volatile months. Retail investors who started SIPs in bullish phases credited themselves for the gains; when markets corrected, they paused SIPs and blamed “bad timing” — a textbook self-attribution pattern that destroys the very compounding SIPs are designed to deliver.
Academic work by Prof. V. Ravi Anshuman at IIM Bangalore on Indian investor behaviour corroborates these patterns: Indian retail investors show systematically asymmetric attribution of portfolio outcomes, and the asymmetry correlates with trading frequency and with long-term underperformance.
4. The Counter-Measure Checklist — How to Beat Self-Attribution Bias
This is the working checklist the most disciplined Indian value investors use. None of it is glamorous. All of it works.
(a) Maintain a dated decision journal. Before every buy or sell, write down in one paragraph: the thesis, the key assumption, the specific data point that would invalidate the thesis, and the time horizon. Do this before the trade, not after. A dated Google Doc is sufficient.
(b) Audit losses before you audit wins. Once a quarter, list every closed position that lost money. For each loss, force yourself to identify one specific decision error — not a market explanation. If you cannot find an error, that is itself an error worth naming (“I did not have an exit rule”).
(c) Separate process from outcome. A good decision can produce a bad outcome (unlucky); a bad decision can produce a good outcome (lucky). Grade your process before you grade your P&L. Howard Marks’s memos are the canonical text on this.
(d) Pre-commit to the lesson. Before every position, write: “If this position loses 30%, the lesson I will record is ___.” This pre-commitment prevents post-hoc rationalisation.
(e) Use the “outside view” — base rates. Before claiming skill, ask: “What percentage of investors in this strategy achieve this return over this horizon?” If your claimed skill requires being in the top 1% of a well-studied population, recalibrate.
(f) Have a “loss buddy”. One trusted person with whom you share both wins and losses, in equal detail, within 7 days of the closed position. Social accountability beats private introspection.
5. How the Masters Handled Self-Attribution
Warren Buffett institutionalised self-honesty in the annual Berkshire letters. The 1989 letter listed his “Mistakes of the First 25 Years” — U.S. Air, Dexter Shoe, Berkshire Hathaway itself. He named them, owned them, and extracted lessons. No external blame, no hedging.
Charlie Munger, in his 1995 Harvard speech “The Psychology of Human Misjudgement“, explicitly flagged self-attribution as one of the core 25 biases. His method: “Invert, always invert.” Before claiming a win was skill, ask what it would take to prove it was luck. Before claiming a loss was bad luck, ask what it would take to prove it was a mistake.
Howard Marks, in The Most Important Thing, dedicates an entire chapter to “The Role of Luck”. His rule: judge decisions by the quality of the process given the information available at the time, not by the outcome.
Seth Klarman, in Baupost’s letters, routinely discloses specific positions that lost money and the decision errors behind each — a discipline that has preserved the firm’s 14%+ CAGR over four decades.
6. Illustrative Case — How Titan Biotech Ltd (BSE: 524717) Exhibits Symmetric Attribution at the Corporate Level
Explicit disclaimer: This section is an educational case study of Titan Biotech Ltd’s disclosure and management-process culture as an illustration of symmetric (non-self-serving) attribution at the corporate level. It is NOT a valuation call. No figure below is a price target, intrinsic value estimate, or buy/sell/hold recommendation. All numbers are drawn from Titan Biotech’s Annual Report 2024-25, its consolidated financial statements, stock-exchange disclosures, and Screener.in data as of 15 April 2026.
At the individual-investor level, self-attribution bias means taking credit for wins and deflecting blame for losses. At the corporate level, the equivalent behaviour shows up in how management reports good years versus bad years, how they frame contingent liabilities, whether they flag weaknesses voluntarily, and whether they own up to capital-allocation decisions that did not work.
A management team that exhibits symmetric attribution — willing to disclose weak quarters as clearly as strong ones, willing to write down capital that was misallocated, willing to flag contingent risks in the same font size as opportunities — is demonstrating, at the institutional level, exactly the anti-bias behaviour that individual investors should practise in their own decision journals.
Titan Biotech’s FY25 disclosures contain several specific markers that suggest symmetric, rather than self-serving, attribution by the management team. Here are the audited numbers (from the Annual Report 2024-25 and consolidated financials), with a behavioural interpretation for each.
Titan Biotech FY25 — Symmetric-Attribution Markers (Audited Numbers)
| Marker | Audited FY25 Number | Behavioural Interpretation |
|---|---|---|
| Contingent liability disclosure | ₹7.78 Cr (FY25), down 39.7% from ₹12.90 Cr (FY24); 5.08% of net worth | Management disclosed the absolute figure, the YoY direction, and the net-worth ratio. Not hidden in a footnote, not rounded. Symmetric attribution: risk is named in the same place as opportunity. |
| Debt reduction — owning past decisions | Borrowings: ₹3 Cr (FY25) vs ₹16 Cr (FY21); 81% reduction over 4 years | The 2021 borrowings (higher level) were disclosed then and the subsequent deleveraging is disclosed now. Neither hidden. A self-serving management would have minimised the earlier leverage in subsequent reports. |
| CFO/Operating Profit ratio | 103% (FY25), 85% (FY24), 97% (FY23) — audited and reconciled | The weaker FY24 (85%) was disclosed plainly. A self-serving report would have focused on FY25’s 103% and suppressed the FY24 comparison. Symmetric attribution here. |
| Depreciation policy (conservative) | Depreciation ~7.0% of gross block (FY25) vs peer ~4–5% | Choosing a depreciation policy that lowers reported profit relative to peers is the corporate equivalent of an individual investor admitting a mistake. It subtracts from current earnings to reflect reality. |
| CWIP disclosure (capex-in-progress) | ₹4 Cr (Sept 2025), peaked at ₹13 Cr (FY23) | The FY23 peak is disclosed in the same schedule as the FY25 trough. Capital tied up in incomplete projects is named — not smoothed away. |
| Board composition — independent oversight | 11 directors, 4 independent (36.4%), 2 women (18.2%), independent chair, 14 board meetings in FY25 | An independent chair and 36.4% independent directors raise the probability that weak decisions will be flagged internally — the structural counter-measure to self-attribution at board level. |
| Management compensation transparency | Total director remuneration FY25: ₹4.56 Cr; disclosed individually and by category | Individual disclosure of remuneration, vs aggregate-only disclosure, is the corporate-governance analog of a trader publishing both wins and losses with equal detail. |
| Quarterly revenue trajectory disclosed QoQ | Q1 FY26 ₹46.50 Cr → Q2 ₹54 Cr → Q3 ₹56 Cr (three consecutive QoQ increases) | Management reports each sequential quarter, not just the favourable YoY comparisons. This preserves investor ability to spot deceleration if and when it occurs — the opposite of self-serving framing. |
| Segment mix clarity | Domestic ₹10,254.80 lakh + Overseas ₹5,390.28 lakh (~34.5% export share) | Exports disclosed separately allows investors to monitor currency / geopolitical risk. Aggregating would have hidden concentration risk — the self-serving option. |
How to read this table as an individual investor. Every row shows a management process choice, not a valuation. The point is not that Titan is “cheap” or “expensive” — the point is that the management team makes disclosure choices that would be impossible if they were practising self-attribution at the firm level. They disclose the weak quarters, the higher past borrowings, the FY24 CFO dip (85% vs 103% now), the contingent liabilities at full face value.
At the portfolio level, the lesson is: apply to your own decision journal the same standard Titan Biotech applies to its annual report. Disclose the weak years. Disclose the mistakes. Disclose the capital tied up in ideas that did not work. Symmetric attribution at the individual level compounds — just as it does at the corporate level.
Once again, for clarity: nothing in this case study is a buy, sell, or hold recommendation on BSE: 524717. The selection of Titan Biotech is purely illustrative of management-disclosure process. Readers are requested to form their own view on valuation through independent due diligence in consultation with their SEBI-registered investment advisor.
7. Key Takeaways
- Self-attribution bias is the bias behind most long-term underperformance. It blocks the learning loop. Fix it and your compounding rate quietly improves.
- Academic foundation: Miller & Ross (1975), Gervais & Odean (2001). Empirical: Barber & Odean (2000) — most-active retail traders underperform by 6.5% per year.
- Indian data: SEBI F&O study — 9 of 10 retail F&O traders lost money; aggregate loss ~₹1.81 lakh crore over FY22–FY24. AMFI SIP pause data shows the same bias at a portfolio level.
- Counter-measures: dated decision journal, loss-first audit, pre-committed lesson, outside-view base rates, loss buddy.
- Titan Biotech FY25 illustrative marker: CFO/Operating Profit disclosed plainly at 103% (FY25), 85% (FY24), 97% (FY23) — the weaker FY24 is visible in the same schedule as the stronger FY25. That symmetric framing at the corporate level is the exact behaviour individual investors should practise in their own decision journals. (Not a valuation call; educational illustration only.)
- Titan Biotech governance marker: 11-director board with 4 independent directors (36.4%), 2 women directors (18.2%), an independent chair, and 14 board meetings in FY25 — structural counter-measures to corporate self-attribution. (Not a valuation call.)
- The master-investor rule: Buffett’s “Mistakes of the First 25 Years”, Munger’s “Invert, always invert”, Marks’s “process before outcome”, Klarman’s full-loss disclosures — they all address the same bias.
Disclaimer: This article is for educational and informational purposes only. It is not investment advice, and not a buy, sell, or hold recommendation on any stock mentioned, including Titan Biotech Limited. Equity markets carry risk; please do your own research or consult a qualified professional before making investment decisions.
