Skip to content

Manish Goel Stocks

Redefining Investing …

Menu

  • Home Page
  • Blogs
  • Past Performance
  • About
  • Multibagger® Trademark
  • Awards & Certificates
  • Contact/Subscribe Now
  • Latest News

Author: Manish Goel

The Halo Effect: Thorndike’s 1920 Discovery and Phil Rosenzweig’s 2007 Warning
Hero banner with title 'The Halo Effect' and subtitle, featuring a 2x2 color grid labeled Lucky (gray), Disciplined Investor (green), Confused (light gray), and Bias-Trapped (orange) illustrating four investor types.

Every quarter, a particular kind of stock idea sweeps through Indian WhatsApp investor groups. The CEO gave a magnetic CNBC-TV18 interview. The promoter is a Padma Shri recipient. The company launched a sleek new product. One trait shines — and

Manish GoelMay 11, 2026 Blog Read more

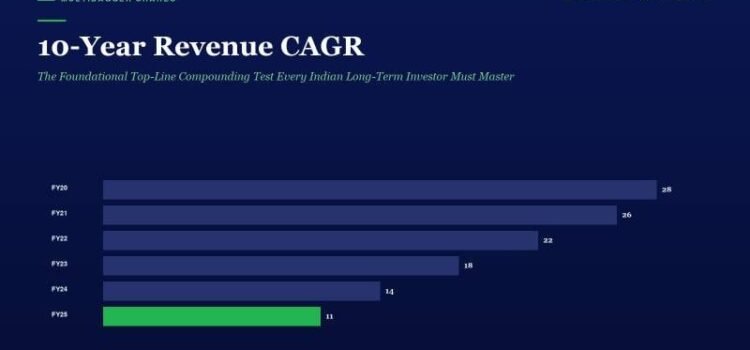
10-Year Revenue CAGR: The Foundational Top-Line Compounding Test Every Indian Long-Term Investor Must Master

Chart showing 10-Year Revenue CAGR with FY20 28, FY21 26, FY22 22, FY23 18, FY24 14, FY25 11 (green) on a dark blue background, indicating a declining trend across years.

SEBI’s landmark 2024 study revealed that 9 out of 10 retail traders in equity Futures & Options lose money — a cumulative ₹1.81 lakh crore destroyed across just three financial years. Yet in the very same window, NSE-registered investors climbed

Manish GoelMay 11, 2026 Blog Read more

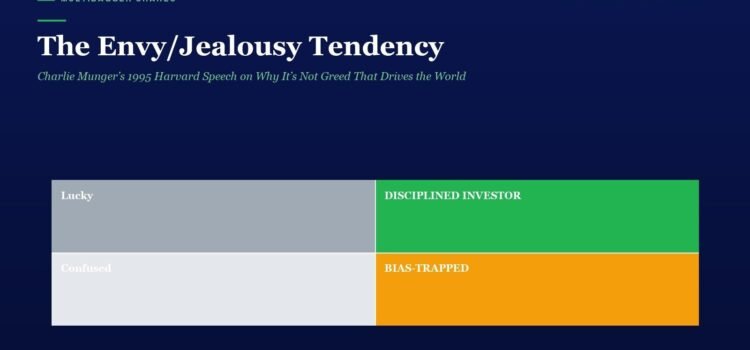
The Envy/Jealousy Tendency: Charlie Munger’s 1995 Harvard Speech on Why It’s Not Greed That Drives the World

Infographic with a dark blue background showing a 2x2 grid of colored panels: top left 'Lucky' (grayish-blue), top right 'DISCIPLED INVESTOR' (green), bottom left 'Confused' (light gray), bottom right 'BIAS-TRAPPED' (orange); title reads 'The Envy/Jealousy Tendency' with a subtitle about Charlie Munger's Harvard speech.

If you have spent any time on Indian investing Twitter in the past three years, you have already met the most expensive emotion in money — and it is not greed. It is envy. Greed is a man wanting more.

Manish GoelMay 11, 2026 Blog Read more

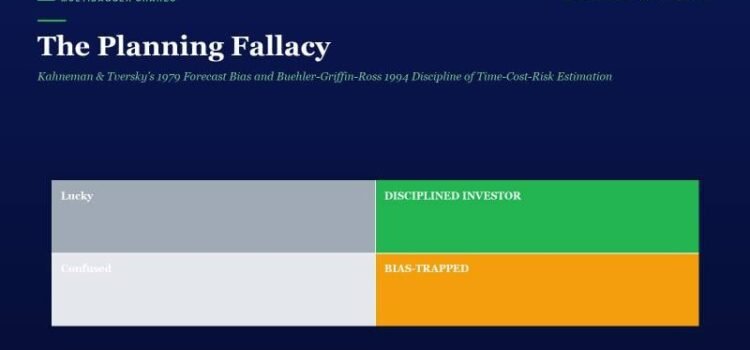
The Planning Fallacy: Kahneman & Tversky’s 1979 Forecast Bias and Buehler-Griffin-Ross 1994 Discipline of Time-Cost-Risk Estimation

Slide titled 'The Planning Fallacy' on a dark blue background, with a 2x2 grid: top left 'Lucky' gray, top right green 'Disciplined Investor', bottom left 'Confused' light gray, bottom right orange 'Bias-Trapped'.

Investor education series — Behavioral Finance lane. This article studies one specific cognitive bias that affects long-term equity investors in India, grounds it in the original academic literature, translates it into the Indian context using SEBI and NSE data, and

Manish GoelMay 10, 2026 Blog Read more

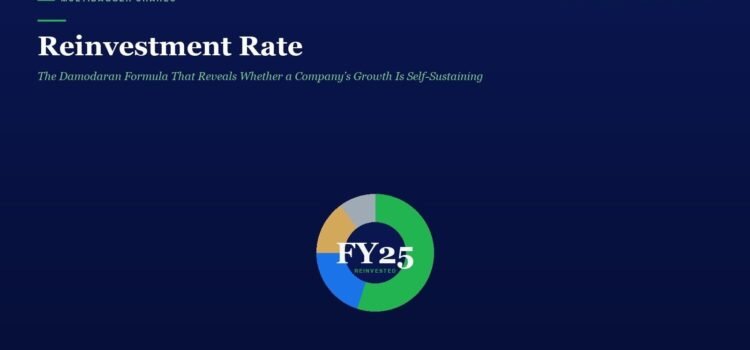
Reinvestment Rate: The Damodaran Formula That Reveals Whether a Company’s Growth Is Self-Sustaining

Hero banner for 'Reinvestment Rate' with a navy background, green-accented subtitle, and a colorful donut chart labeled FY25 centered on the page.

Most Indian retail investors track quarterly EPS growth and stop there. They never ask the deeper question every long-term compounder must eventually answer: where is that growth coming from, and how much does the company have to spend to keep

Manish GoelMay 10, 2026 Blog Read more

The Affect Heuristic: Slovic et al.’s 2002 Cognitive Shortcut Behind India’s ₹1.81 Lakh Crore F&O Loss Numbers

Hero title: The Affect Heuristic with a subtitle on a dark blue background. Below, a two-by-two color grid labeled Lucky, Disciplined Investor, Confused, and Bias-Trapped.

Pick a stock you “feel good” about. Pick a stock you “feel bad” about. Now ask yourself: did the feeling come before or after you looked at the numbers? If you are honest, the feeling came first; the numbers were

Manish GoelMay 9, 2026 Blog Read more

The Affect Heuristic: Slovic et al.’s 2002 Cognitive Shortcut Behind India’s ₹1.81 Lakh Crore F&O Loss Numbers

Hero title: The Affect Heuristic with a subtitle on a dark blue background. Below, a two-by-two color grid labeled Lucky, Disciplined Investor, Confused, and Bias-Trapped.

Pick a stock you “feel good” about. Pick a stock you “feel bad” about. Now ask yourself: did the feeling come before or after you looked at the numbers? If you are honest, the feeling came first; the numbers were

Manish GoelMay 9, 2026 Blog Read more

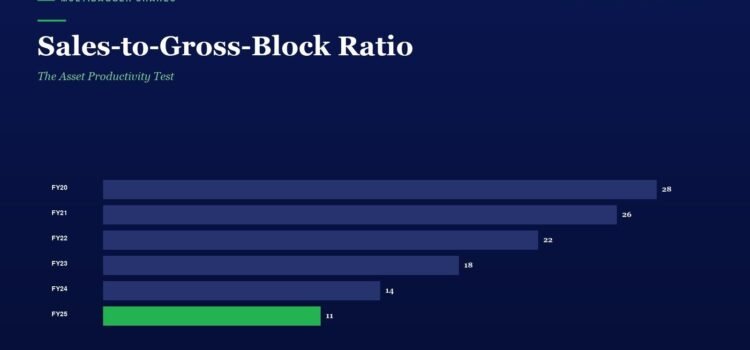
Sales-to-Gross-Block Ratio: The Asset Productivity Test

Infographic titled Sales-to-Gross-Block Ratio showing yearly bars FY20–FY25 with values: FY20 28, FY21 26, FY22 22, FY23 18, FY24 14, FY25 11 (green bar).

The Securities and Exchange Board of India’s most recent investor demographics report tells a sobering story: India’s listed-equity universe has expanded from 3 crore unique investors in 2014 to over 11 crore in 2025, and yet the same regulator’s three-year

Manish GoelMay 9, 2026 Blog Read more

The Framing Effect: Tversky & Kahneman’s 1981 ‘Asian Disease Problem’

Two-by-two color blocks labeled Lucky, Disciplined Investor, Confused, and Bias-Trapped on a dark blue background; title 'The Framing Effect'

If a fund is described as “90% of investors retain capital” you commit. If the same fund is described as “1 in 10 investors lose capital” you hesitate. The math is identical. Your decision is not. That gap is the

Manish GoelMay 8, 2026 Blog Read more

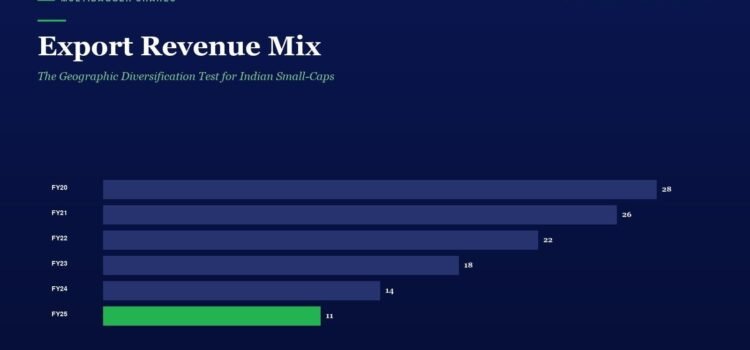
Export Revenue Mix: The Geographic Diversification Test for Indian Small-Caps

Infographic: Export Revenue Mix bar chart by fiscal year (FY20–FY25); values 28, 26, 22, 18, 14, 11, with FY25 bar highlighted in green.

The number of registered investors on the National Stock Exchange has crossed eleven crore in 2026, up from roughly three crore in 2020 — a 3.7x expansion in a single market cycle. Yet a 2024 SEBI study found that nine

Manish GoelMay 8, 2026 Blog Read more

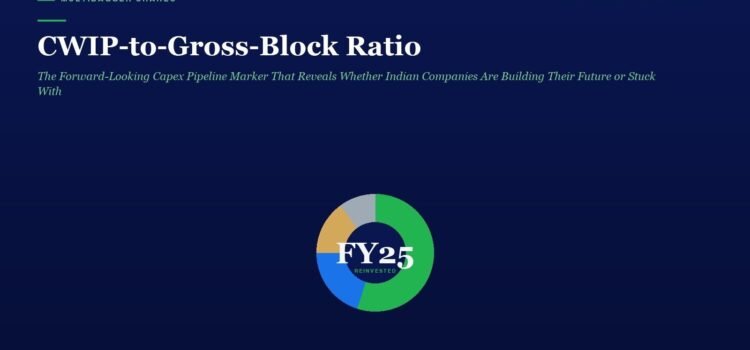
CWIP-to-Gross-Block Ratio: The Forward-Looking Capex Pipeline Marker That Reveals Whether Indian Companies Are Building Their Future or Stuck With Stranded Assets

Dark blue hero banner with the article title 'CWIP-to-Gross-Block Ratio' and a centered multi‑colored donut chart labeled FY25 reinvested.

Indian retail participation has crossed 11 crore registered investors on NSE — up from 3 crore just five years ago. Yet a SEBI study covering FY22-FY24 found that 9 out of 10 individual traders in the equity Futures & Options

Manish GoelMay 7, 2026 Blog Read more

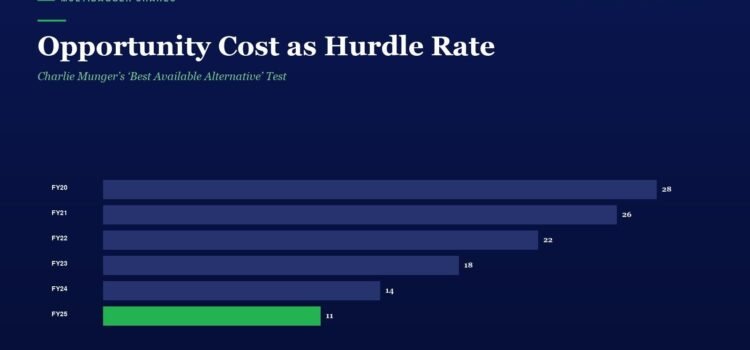
Opportunity Cost as Hurdle Rate: Charlie Munger’s ‘Best Available Alternative’ Test

Infographic: 'Opportunity Cost as Hurdle Rate' with six horizontal bars showing yearly values FY20–FY25; FY25 is green at 11, others in dark blue with values 28, 26, 22, 18, 14.

One of the most repeated lines in Charlie Munger’s lifetime of public talks goes like this: “The first principle is that you have to ask yourself, what’s my best alternative use for this dollar? And that’s the standard against which

Manish GoelMay 7, 2026 Blog Read more

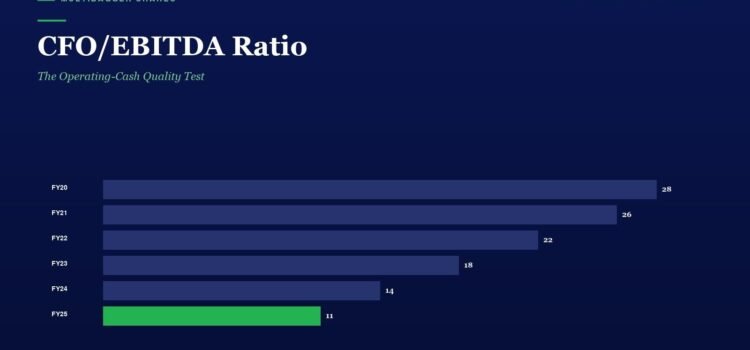
CFO/EBITDA Ratio: The Operating-Cash Quality Test

Horizontal bar chart titled CFO/EBITDA Ratio with subtitle The Operating-Cash Quality Test, showing annual values: FY20 28, FY21 26, FY22 22, FY23 18, FY24 14, FY25 11 (FY25 bar in green).

The Securities and Exchange Board of India’s longitudinal study on the Futures & Options segment confirmed what disciplined long-term investors have suspected for years: roughly 9 out of every 10 individual traders in Indian F&O lose money, with aggregate retail

Manish GoelMay 6, 2026 Blog Read more

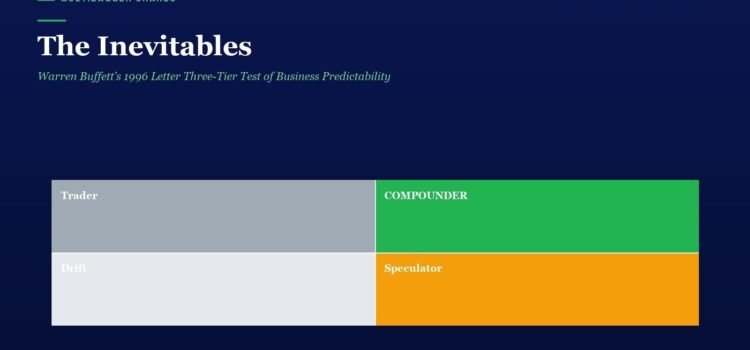
The Inevitables: Warren Buffett’s 1996 Letter Three-Tier Test of Business Predictability

Hero header with large title 'The Inevitals' and green subtitle on a dark blue background; a 2x2 color grid labeled Trader (gray), Compounder (green), Drift (light gray), Speculator (orange) across the middle of the page; small 'Multibagger Shares' label in the bottom left.

Estimated reading time: 9–11 minutes. This is an educational value-investing essay written for serious Indian long-term investors. The Titan Biotech section is a corporate-process illustration of a categorisation principle. Table of Contents Toggle 1. The Sentence Almost Nobody Quotes From

Manish GoelMay 6, 2026 Blog Read more

The Illusion of Control: Ellen Langer’s 1975 Cognitive Bias That Powers ₹1.81 Lakh Crore of Indian F&O Losses

Header title: The Illusion of Control with subtitle about Ellen Langer's 1975 cognitive bias and a four-quadrant diagram beneath in muted colors and bold titles.

Estimated reading time: 11–13 minutes. This is an educational behavioural-finance article written for serious Indian long-term investors. It is neither a research report nor a stock recommendation. The Titan Biotech section is a corporate-process case study — not a buy/sell/hold

Manish GoelMay 5, 2026 Blog Read more
  • « Previous
  • Next »

Translate:

My Portfolio CAGR is 112% as on 31.10.2024
My Contract Note of 28.06.2024 showing A.K. Spintex buying at 185 average

Telegram Link - https://telegram.me/longtermequityy

Manish Goel in ABP Live
Manish Goel in LiveMint
Bhopal Samachar

My Other Posts

  • Why I Hold Greenlam Industries — India’s Laminate Leader
  • Why I Bought HG Industries — and How It Became Greenlam (~3×)
  • Why I Bought Netlink Solutions — and Why It Multiplied ~3×
  • Why I Bought Hazoor Multiprojects — and Why It Multiplied ~10×
  • Why I Bought A.K. Spintex (Now Sunrakshakk Industries) — and Why It Multiplied ~10×
  • Why I Bought Solex Energy — and Why It Multiplied ~15×
  • Why I Bought Maithan Alloys — and Why It Multiplied ~29×
  • Why I Bought Sangam Advisors (Now Waaree Renewables) — and Why It Multiplied ~312×
  • Lease Liabilities and Right-of-Use Assets: How Ind AS 116 Dragged India’s Off-Balance-Sheet Debt Into the Open
  • The Share-Price Illusion: Why a ₹10 Share Is Not Cheap and a ₹1,00,000 Share Is Not Costly
  • The Cube of Gold That Cannot Grow: Warren Buffett’s Famous Lesson on Assets That Work and Assets That Just Sit
  • The Voting Machine and the Weighing Machine: Benjamin Graham’s Famous Lesson on Why Popularity Fades and Profits Win
  • Never Invest with Borrowed Money: Warren Buffett’s Simplest Rule for Surviving the Stock Market
Economic Times Industry Leaders Award for Manish Goel
In last 5 years, Out of my these shortlisted 30 companies, Hazoor Multiprojects Multiplied 21 Times in 2 Years, and Sangam Advisors (Waaree Renewables Technologies ltd) Multiplied 450 Times in 5 Years.
Copyright © 2026 Manish Goel Stocks. All rights reserved. Theme Spacious by ThemeGrill. Powered by: WordPress.
  • Home Page
  • Blogs
  • Past Performance
  • About
  • Multibagger® Trademark
  • Awards & Certificates
  • Contact/Subscribe Now
  • Latest News