Segment-Wise Revenue Breakdown

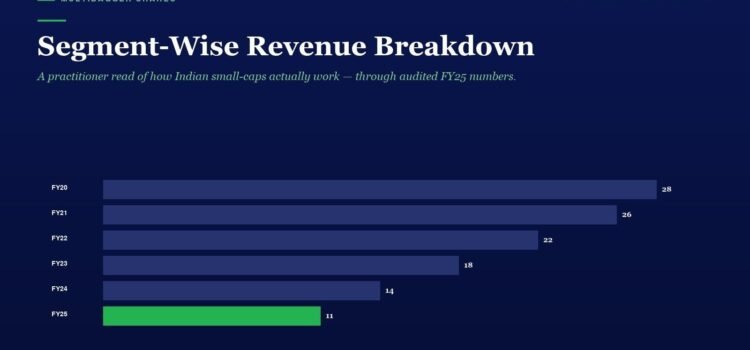
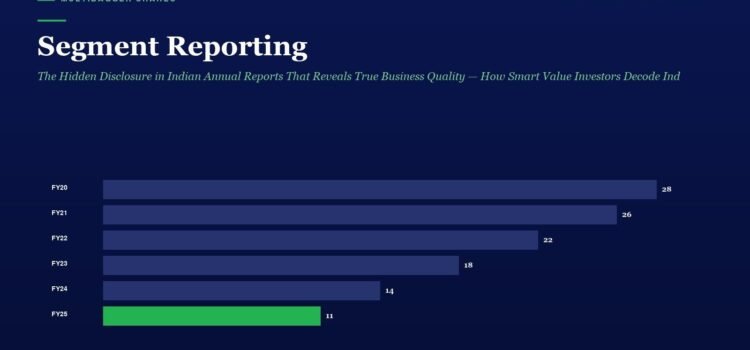
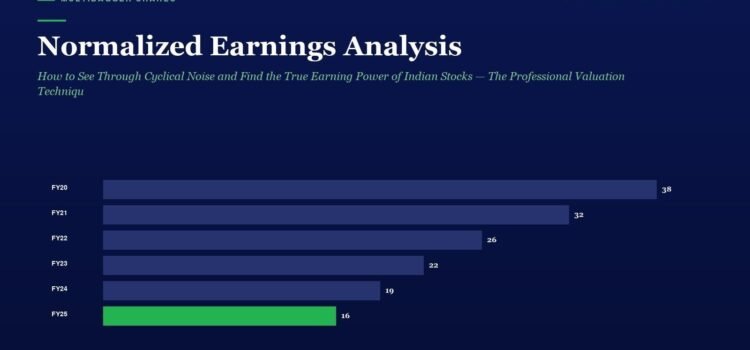
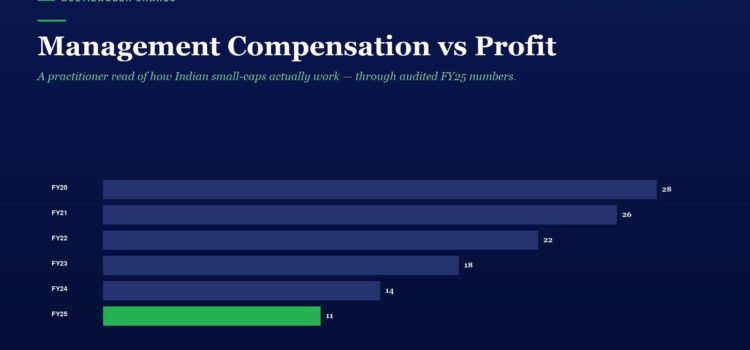
Segment-wise revenue breakdown bar chart from FY20 to FY25 showing values: 28, 26, 22, 18, 14, and 11 (FY25 in green) on a dark blue background.

Published 19 April 2026 (Sunday) MULTIBAGGER SHARES Table of Contents Toggle Segment-Wise Revenue Breakdown: Why Titan Biotech’s One-Segment Biological Products Model Makes the Business Easier to Trust – What It Means for Investors Why Segment Simplicity Matters More Than Investors

Overconfidence Bias: Why 93% of Indian F&O Traders Lose Money — How Barber & Odean’s Landmark Research, Validated by SEBI’s 2024 Evidence, Explains the Zerodha-Groww Revolution and the Anti-Overconfidence Checklist Every Serious Long-Term Investor Must Adopt

Overconfidence Bias page showing a dark blue background and a four-block infographic: Lucky (gray), Disciplined Investor (green), Confused (light gray), Bias-Trapped (orange).

How Barber & Odean’s Nobel-adjacent research, validated by SEBI’s own 2024 study of 93% losing retail F&O traders, explains the most expensive cognitive bias on Dalal Street — and the exact checklist long-term investors must adopt before ever placing another

Mental Accounting Bias: The Silent Wealth Destroyer That Makes Indian Investors Treat ‘Profits’ Differently From ‘Capital’ — How Richard Thaler’s Nobel-Winning Insight Explains Why Retail Investors Underperform the Sensex Year After Year

Hero image with a four-block color grid labeled Lucky (gray), Confused (light gray), Disciplined Investor (green), Bias‑Trapped (orange) under the title 'Mental Accounting Bias' and subtitle.

📅 Published 18 April 2026 (Saturday) Live market snapshot at time of writing (previous trading session, Friday 17 April 2026 close): SENSEX 78,493.54 (+504.86 pts, +0.65%), NIFTY 50 24,353.55 (+156.80 pts, +0.65%), FII net inflow ≈ ₹3,200 Cr. Titan Biotech

Contingent Liabilities

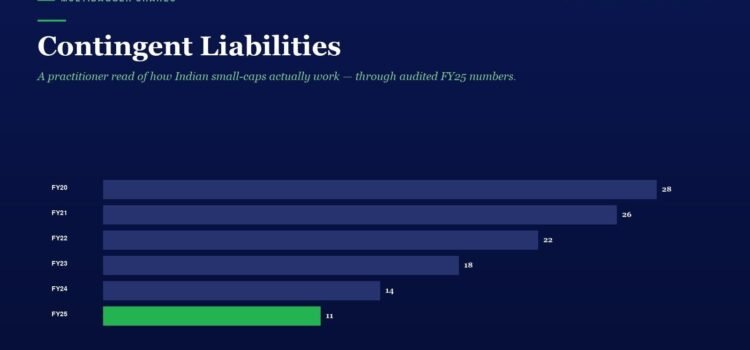
Bar chart titled Contingent Liabilities showing FY20 to FY25 values: FY20 28, FY21 26, FY22 22, FY23 18, FY24 14, FY25 11; the FY25 bar is highlighted in green.

Every investor obsesses over the Profit & Loss statement. A few smart ones dig into the Balance Sheet. But almost nobody — and I mean nobody outside of forensic accountants and seasoned value investors — reads the one disclosure that

Cement Sector Analysis Framework: The 8-Factor Checklist Every Indian Value Investor Must Use to Separate Multibagger Cement Stocks from Value Traps in India’s ₹2 Lakh Crore Super-Cycle

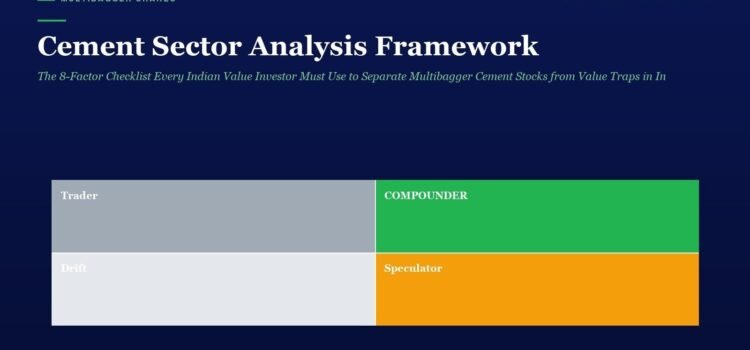
Two-by-two cement investment framework: Trader (left, gray), Compounder (right, green); Drift (left, light gray), Speculator (right, orange).

📅 Published 18 April 2026 (Saturday) Table of Contents Toggle Why Cement Is India’s Most Underrated Multibagger Hunting Ground in 2026 The 8-Factor Cement Sector Analysis Framework Factor 1 — Installed Capacity & Utilisation Ratio Factor 2 — Geographic Footprint

Price-to-Sales (P/S) Ratio: Ken Fisher’s Revolutionary Valuation Metric That Reveals Undervalued Indian Multibaggers When Earnings Temporarily Collapse — The Forgotten Formula Every Value Investor Must Master in 2026

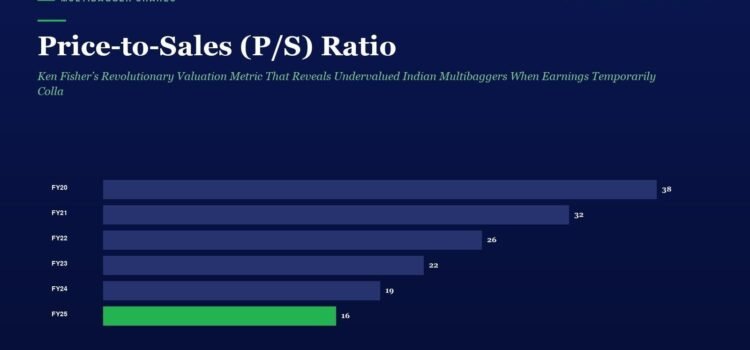
Chart showing price-to-sales ratio by fiscal year; FY20 38, FY21 32, FY22 26, FY23 22, FY24 19, FY25 16 with FY25 in green.

📅 Published 17 April 2026 (Friday) Every value investor eventually runs into the same painful question: how do you value a quality Indian business when its earnings have temporarily collapsed? Think of a pharma company hit by a one-time USFDA