India’s registered investor base has climbed from roughly 3 crore to more than 11 crore in less than six years, and a very large share of those new investors screen stocks the same way: they open a free screener, glance at the line marked “Total Borrowings”, see a small number, and mentally file the company under “debt-free”. That single habit is the most quietly dangerous shortcut in Indian retail investing — because since 1 April 2019, the Borrowings line has stopped being the whole story of what a company owes.
The Footnote That Became a Liability
For decades, lease accounting contained a loophole large enough to hide an entire balance sheet inside. Under the old standard, a lessee split its leases into two buckets. A finance lease — one that transferred substantially all the risks and rewards of ownership — was capitalised: the asset appeared on the balance sheet and so did the corresponding liability. An operating lease was treated as nothing more than a rental arrangement. The rent was charged to the profit and loss account as it was incurred, and the total future commitment was disclosed in a footnote that almost nobody read.
The consequence was structural, not accidental. A company operating four hundred leased retail stores, or an airline flying a fleet it did not own, could report a balance sheet that looked strikingly unlevered while being contractually obliged to pay out thousands of crores over the following decade. The obligation was real, legally enforceable, and largely non-cancellable. It simply was not on the balance sheet. When the International Accounting Standards Board finally moved to close the loophole, its own effects analysis published alongside IFRS 16 in January 2016 estimated that listed companies reporting under IFRS and US GAAP were carrying something in the order of three trillion US dollars of off-balance-sheet lease commitments between them.
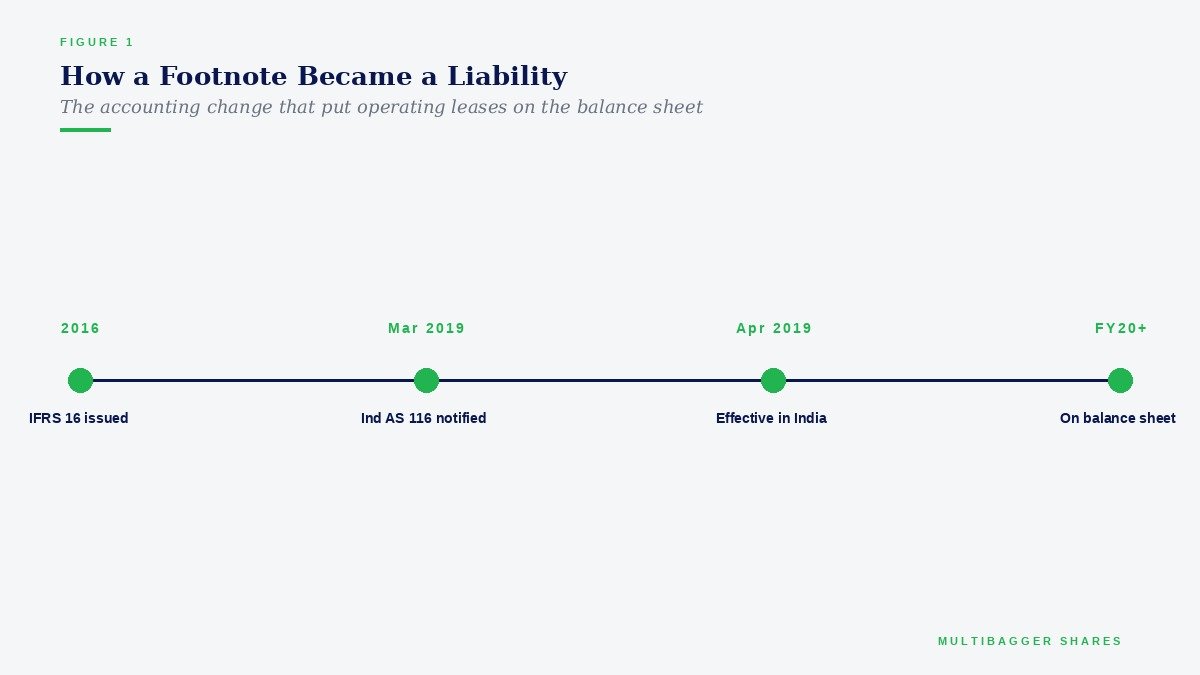
India followed. The Ministry of Corporate Affairs notified Ind AS 116 in March 2019, effective for annual reporting periods beginning on or after 1 April 2019. The standard abolished the operating-versus-finance distinction for lessees almost entirely. From FY20 onwards, a lessee recognises, for substantially every lease, two new items: a right-of-use (ROU) asset representing its right to use the underlying asset for the lease term, and a lease liability representing the present value of the payments it still owes.
The Formula, and What Each Piece Actually Means
The lease liability is not the sum of the rent cheques. It is a discounted figure. A company measures it as the present value of the lease payments still outstanding, discounted at the rate implicit in the lease — or, where that rate cannot readily be determined, at the lessee’s incremental borrowing rate, meaning the rate it would have had to pay to borrow the money to buy a similar asset over a similar term with similar security.
discounted at the incremental borrowing rate
Lease-Adjusted Debt = Total Borrowings + Current Lease Liabilities + Non-Current Lease Liabilities
Lease-Adjusted Debt-to-Equity = Lease-Adjusted Debt ÷ Net Worth
Disclaimer: This article is for educational and informational purposes only. It is not investment advice, and not a buy, sell, or hold recommendation on any stock mentioned, including Titan Biotech Limited. Equity markets carry risk; please do your own research or consult a qualified professional before making investment decisions.
Two derived numbers are worth computing every single time. The first is the lease-adjusted debt-to-equity ratio, which tells you what the leverage picture looks like once the hidden obligation is added back. The second is lease intensity — lease liabilities divided by lease-adjusted debt — which tells you what proportion of a company’s total funded obligation is contractual rent rather than borrowed money. A business with ninety per cent lease intensity is running an entirely different risk profile from one at five per cent, even if both report the same headline leverage.
Both numbers are sitting in the annual report already. The lease liability is split across current and non-current financial liabilities on the face of the balance sheet, and the notes carry a maturity analysis of undiscounted lease payments alongside the ROU asset movement schedule. Reading those two notes takes about four minutes.
Two Businesses, One Reported Leverage Number
Consider two companies that a screener would rank identically. Both report modest borrowings and both look conservatively financed on the surface.
The first is an owner-operator manufacturer. It has spent two decades buying land, constructing plant, and installing machinery from internal accruals. Its gross block is large relative to its revenue, its depreciation charge is steady and predictable, and its lease exposure amounts to a handful of small office and warehouse arrangements. When you add the lease liability back to borrowings, the leverage ratio barely moves. What you saw on the screener was, substantively, what the business owes.
The second is a lease-dependent multi-site operator — the generic shape of a retail chain, a diagnostics network, a co-working platform, or a restaurant group. It reports almost no borrowings, because it never needed to borrow: it rents its entire operating footprint. Add its lease liabilities back and the leverage ratio can multiply several times over. Crucially, the obligation behaves like debt in the one respect that matters in a downturn — it is contractual, it is largely non-cancellable, and rent falls due whether or not customers walk through the door. This is precisely the mechanism that turned lease-heavy business models into the most fragile category of company during the pandemic-era revenue collapse, when a great many operators discovered that their landlords, unlike their equity investors, were not sharing the risk.
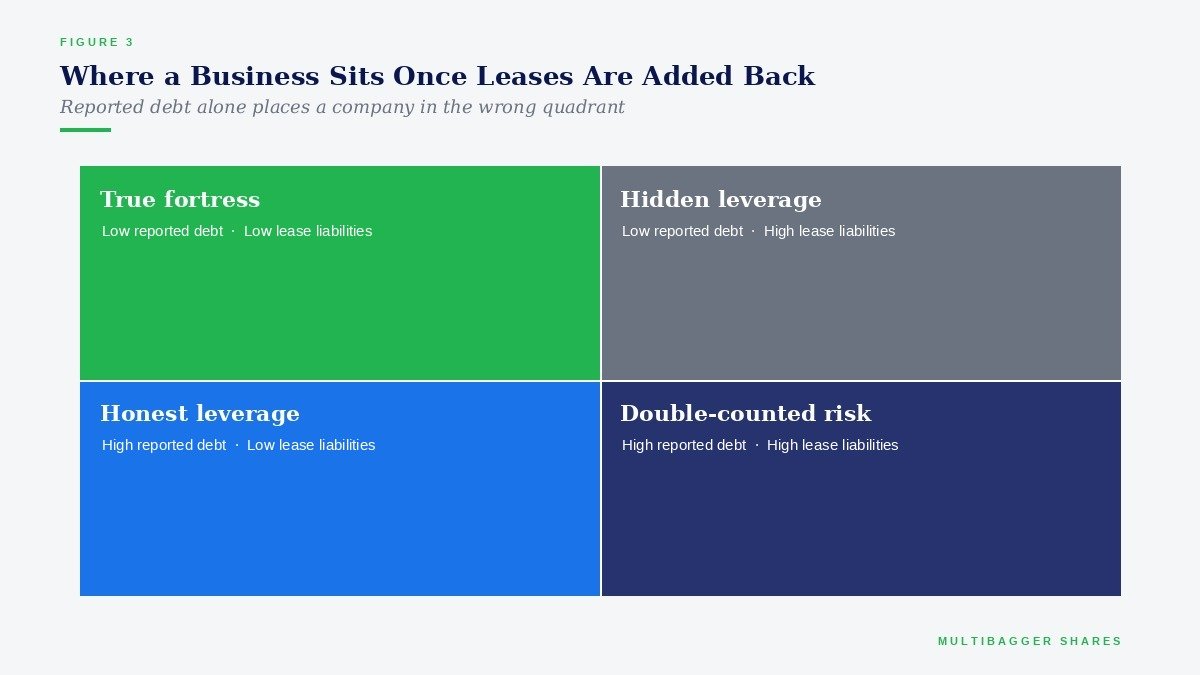
Neither profile is inherently superior. Leasing is a perfectly rational financing decision — it preserves capital, transfers obsolescence risk, and allows a business to test a location before committing to it. The analytical failure is not leasing; the analytical failure is not counting the lease.
Titan Biotech FY25: What the Numbers Reveal
Titan Biotech Limited, the Bhiwadi-based specialty biotechnology manufacturer producing peptones, microbial culture media, collagen and gelatin for pharmaceutical and biotech customers across more than sixty countries, offers a useful illustration of what the owner-operator profile looks like in audited numbers. The FY25 markers below are drawn from the company’s audited financial statements.
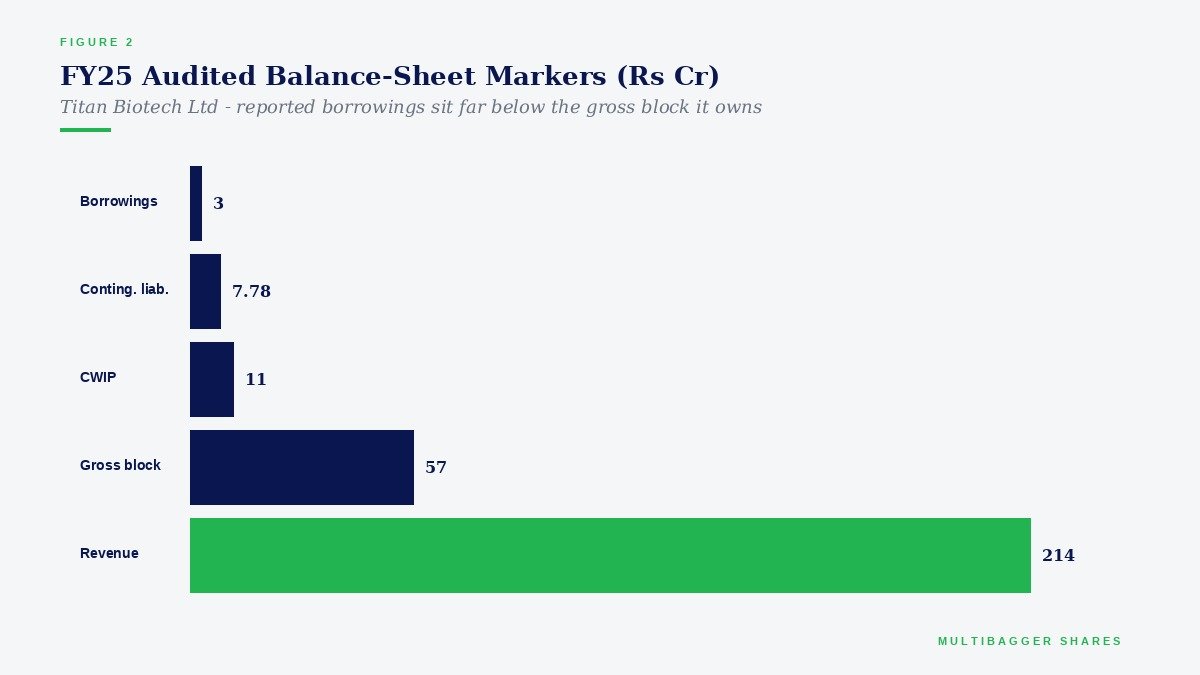
Read structurally rather than as a verdict, the combination is instructive. A gross block of roughly ₹57 Cr alongside ₹11 Cr of capital work-in-progress describes a company that has chosen to build and own its productive capacity, funding it without leaning on borrowings — total debt of ₹3 Cr against that asset base is the definition of self-funded expansion. The depreciation-to-gross-block ratio of about 7% reinforces the same reading: it implies a long average useful life, consistent with owned land, buildings and process plant rather than a portfolio of short-tenor rented facilities. For a business shaped this way, the lease-adjustment exercise is structurally less likely to change the leverage picture materially, because the assets that generate the revenue are already on the balance sheet at cost.
The second observation concerns cash. A CFO-to-operating-profit ratio of 103% in FY25 means the business converted slightly more than the whole of its operating profit into actual operating cash. This matters directly to the lease question, because Ind AS 116 also reshuffles the cash flow statement: the principal portion of lease payments moves out of operating activities and into financing activities, which mechanically flatters reported CFO at lease-heavy companies. A company with negligible lease liabilities does not receive that accounting tailwind — its cash conversion has to be earned the hard way. And to be explicit about the limits of this article: it deliberately puts no figure on Titan Biotech’s own lease liability. The disciplined next step for any reader is to open the FY25 annual report, find the lease note, and read that number directly rather than accept anyone’s characterisation of it — including this one. None of this is a buy, sell or hold recommendation on Titan Biotech Limited or any other security; it is an educational illustration of what a disciplined set of audited markers looks like.
How a Retail Investor Should Actually Use This
The metric is only useful if it changes what you do. Three steps, in order.
- Step one — locate the number. Open the consolidated balance sheet and find “Lease liabilities” under both current and non-current financial liabilities. Add the two. This is your off-screener debt. On the asset side, find “Right-of-use assets” in the non-current assets block.
- Step two — re-run the leverage ratio. Add the combined lease liability to reported borrowings and divide by net worth. If the ratio you get is materially different from the screener’s debt-to-equity, the screener was describing a different company from the one you are considering buying.
- Step three — check the maturity profile. The notes carry an undiscounted maturity analysis of lease payments. A liability weighted towards years one and two is a near-term cash claim; one stretched over fifteen years with renewal options is a different animal. Read the tenor, not just the total.
Run the same three steps across the peer set before drawing conclusions. Lease intensity is largely a function of business model, and comparing a manufacturer against a retailer on unadjusted leverage tells you almost nothing useful about either.
Four Traps That Catch Careful Readers
Trap one: the EBITDA illusion. This is the single most consequential distortion Ind AS 116 introduced, and it fools professionals as well as retail investors. Before the standard, operating-lease rent was an operating expense sitting above EBITDA. After it, that rent is replaced by depreciation on the ROU asset plus finance cost on the lease liability — both of which sit below EBITDA. The result is that a lease-heavy company’s reported EBITDA jumped materially in FY20 with no change whatsoever in its economics, its cash flows, or its competitive position. Any EBITDA-based multiple, margin trend or covenant that straddles the FY19-to-FY20 boundary is comparing two different measurement bases. Always check whether a long-run margin chart has been restated.
Trap two: front-loaded expense. Because the finance cost is computed on a declining liability balance, the combined charge to the profit and loss account is higher in the early years of a lease and lower in the later years, even when the cash rent is perfectly level. A company in an aggressive expansion phase, signing many new leases at once, will therefore report a P&L drag that is an artefact of lease-accounting mechanics rather than a deterioration in the underlying business. The reverse is equally true of a maturing lease portfolio, which can flatter reported profit growth.
Trap three: discount-rate discretion. The incremental borrowing rate is a management estimate, and it moves the answer. A higher assumed rate produces a smaller present value and therefore a smaller reported lease liability. Companies disclose the weighted-average rate used; when comparing two peers with similar lease footprints, a conspicuously higher discount rate at one of them is worth a moment’s attention.
Trap four: what stays off the balance sheet anyway. Ind AS 116 retains exemptions for short-term leases of twelve months or less and for leases of low-value assets. More importantly, the liability includes payments for optional renewal periods only where the company judges it “reasonably certain” it will exercise the option. A retailer that renews substantially every store lease in practice, but does not treat renewal as reasonably certain in its accounting, will report a lease liability that understates its economic commitment. The old footnote habit did not disappear entirely — it simply got smaller.
A liability does not become less real because it is measured in a different note of the same annual report. The Borrowings line tells you what a company chose to borrow. The lease liability tells you what it chose to promise.
Key Takeaways
- 01 · The “debt-free” tag on a screener is an incomplete sentence. Since FY20, Ind AS 116 has required lease liabilities to sit on the balance sheet alongside borrowings. Add both before you describe any company’s leverage.
- 02 · Lease intensity is a business-model fact, not a quality signal. Asset-light operators legitimately lease their footprint. The error is failing to count the obligation, not choosing to lease in the first place.
- 03 · Owned capacity changes the shape of the question. Titan Biotech’s FY25 audited numbers — total borrowings of just ₹3 Cr against a gross block of roughly ₹57 Cr and ₹11 Cr of capital work-in-progress — describe a business funding its own capacity rather than renting it, which is the profile least exposed to a lease-adjustment surprise. Verify the lease note yourself before concluding anything.
- 04 · Distrust any EBITDA series that crosses FY19 to FY20. The standard mechanically lifted reported EBITDA at lease-heavy companies without improving a single rupee of economics. Restated comparatives, or nothing.
The Wider Discipline
SEBI’s study of the equity derivatives segment found that roughly nine out of ten individual traders lost money, and the aggregate losses run into lakhs of crores. The gap between that outcome and the outcome available to a patient reader of annual reports is not intelligence or access to information — every number discussed in this article is free, public, and available to anyone who downloads a PDF. The gap is the willingness to spend four minutes on a lease note instead of four seconds on a screener tag.
Read the note. Add the liability. Re-run the ratio. It is the least glamorous work in investing, and it is where most of the edge actually lives.
Disclaimer: This article is for educational and informational purposes only. It is not investment advice, and not a buy, sell, or hold recommendation on any stock mentioned, including Titan Biotech Limited. Equity markets carry risk; please do your own research or consult a qualified professional before making investment decisions.
