Indian retail participation has crossed 11 crore registered investors on NSE — up from 3 crore just five years ago. Yet a SEBI study covering FY22-FY24 found that 9 out of 10 individual traders in the equity Futures & Options segment incurred net losses, with cumulative losses of ₹1.81 lakh crore. The pattern is unmistakable: retail capital is pouring into India’s markets, but most of it is being burned in option chains and tip-driven small-cap trades while the genuine compounders are routinely overlooked. The single discipline that separates the two cohorts is fundamental analysis — and within fundamental analysis, the discipline that separates careful long-term investors from headline-chasers is balance-sheet forensics. This article teaches one such forensic ratio: the Capital Work-in-Progress to Gross Block ratio, a forward-looking capex-pipeline marker that reveals whether a business is genuinely investing in its next leg of growth — or whether reported assets are quietly stranded.
What is CWIP and What is Gross Block?
Gross Block is the cumulative original cost of every item of property, plant and equipment a company has ever bought or built — buildings, machinery, vehicles, plant, electrical fittings, furniture, computers — all valued at acquisition cost before any depreciation is netted off. It is the foundation of operating capacity. When you read an Indian annual report, Gross Block appears in Note 3 (or wherever PP&E is disclosed) under Schedule III of the Companies Act 2013.
Capital Work-in-Progress (CWIP), by contrast, captures the portion of plant, machinery, civil construction and other fixed-asset projects that are under construction but not yet ready for commercial use. The day a new line is commissioned, the day a factory hall passes its statutory inspection, the day a furnace lights for the first time — that is the day CWIP is debited and Gross Block is credited. Until that handover, every rupee of brick, steel, freight, installation labour and capitalised interest sits in CWIP earning the company nothing.
The 2021 amendment to Schedule III made this disclosure dramatically more useful. Indian companies must now show CWIP aged into four buckets — less than 1 year, 1-2 years, 2-3 years, and more than 3 years — plus a separate completion-schedule disclosure for projects whose original timeline has slipped. For the first time, an outside investor can tell whether CWIP represents a genuinely active construction pipeline or a graveyard of stranded promises.
The Formula and How to Read It
CWIP-to-Gross-Block Ratio (%) = (CWIP at year-end ÷ Gross Block at year-end) × 100
Both numbers come from the same Schedule III note, so unlike many cross-statement ratios, you do not need to reconcile aggregates from different sources. The ratio answers a single sharp question: For every ₹100 of operating asset base already deployed, how much is currently being built but not yet earning revenue?
A reasonable framework for reading the result on Indian listed companies:
- 0% to 5%: Either the company has reached operational maturity and is not investing in new capacity (which can be benign for a high-RoCE asset-light franchise but worrying for a manufacturer in a growing end-market) or the management is genuinely starving the business of reinvestment. Pair this reading with capex-to-depreciation: if capex is below depreciation, the asset base is shrinking in real terms.
- 5% to 25%: The healthy “active growth pipeline” zone. The company is rotating in fresh productive capacity at a measured pace, typically self-funded if interest coverage is strong. This is where most disciplined Indian compounders live during a normal capex cycle.
- 25% to 50%: A transformational expansion phase. Greenfield projects, capacity-doubling initiatives, or geographic diversification are under way. Acceptable if the project is on schedule, fully funded, and serves a clear demand signal — but the next two annual reports must show the bucket maturing into Gross Block. Otherwise the ratio is a warning, not a promise.
- Above 50%: Almost always a red flag. Either the company is making an outsized leveraged bet that strains the balance sheet, or projects are stuck. Pair the reading with the new ageing disclosure: if a meaningful portion of CWIP is more than 2 years old, ask aggressive questions about cost overruns, environmental clearances, contractor disputes, or impairment risk.
These ranges are heuristics, not absolutes. A power-utility company in a multi-year build cycle may legitimately run at 60-70% during construction; a software services firm should never have CWIP at all. The ratio must always be read in the context of the company’s industry, its capex cycle phase, and its funding source.
Two Contrasting Examples (Generic, Educational)
Example A — A Disciplined Cement Manufacturer Mid-Cycle: Imagine an Indian cement company with Gross Block of ₹8,000 crore and CWIP of ₹1,200 crore (15%). The CWIP ageing note shows ₹1,000 crore is less than 1 year old, ₹150 crore is in the 1-2 year bucket, and ₹50 crore is older. The capex is for a 2-million-tonne brownfield expansion at an existing plant, the company has a debt-to-equity of 0.3x, interest coverage of 8x, and CFO that more than covers the entire capex programme. The next annual report will show CWIP fall to perhaps 5-8% as the line commissions and the additional capacity rolls into Gross Block. This is the textbook signature of disciplined capital allocation: meaningful pipeline, fully funded, on schedule, in a business with operating leverage from the new capacity.
Example B — A Stranded-CWIP Red Flag (Historical Generic Pattern): Picture a mid-cap engineering company with Gross Block of ₹400 crore and CWIP that has hovered at ₹350 crore (87%) for three consecutive annual reports. The ageing disclosure shows ₹280 crore of CWIP is more than 3 years old. The same period saw debt rise from ₹150 crore to ₹600 crore, interest coverage fall from 4x to 1.2x, and statutory auditors add an “emphasis of matter” paragraph about project recoverability. Indian listed history is unfortunately full of variants of this pattern — capital tied up in projects that never commission, financed by ever-rising borrowings, eventually written down in a single ugly year. The ratio plus the ageing bucket would have flagged the risk three to five years before the impairment.
Titan Biotech FY25: What the Numbers Reveal
Titan Biotech Limited (BSE: 524717), the Bhiwadi-based specialty biotechnology manufacturer, releases FY25 audited financials that allow a clean read of the CWIP-to-Gross-Block ratio. The company makes microbial culture media, peptones, collagen, and gelatin for pharma and biotech customers across more than 60 countries, with exports contributing roughly 34.5% of FY25 revenue. The relevant FY25 audited markers are summarised below.
| FY25 Marker | Audited Number | What it tells the forensic reader |
|---|---|---|
| Gross Block | ~₹57 Cr | Total operating asset base accumulated over the company’s life. |
| Capital Work-in-Progress | ~₹11 Cr | Active capex pipeline funding the next leg of capacity. |
| CWIP / Gross Block | ~19% | Squarely in the “active growth pipeline” zone (5-25%). |
| Total borrowings | ~₹3 Cr | Essentially debt-free; the capex is not leveraged. |
| CFO / Operating Profit | ~103% | Earnings are slightly more than fully cash-backed — capex is funded internally. |
| Depreciation / Gross Block | ~7% | Conservative depreciation policy on a relatively long-lived asset base. |
| Contingent liabilities | ~₹7.78 Cr | Low and disclosed; no looming off-balance-sheet capex commitment. |
| Board meetings (FY25) | 14 | Far above the SEBI 4-meeting minimum; capex approval discipline visible. |
| Independent chairperson | Yes | Chair-MD separation ensures independent capex oversight. |
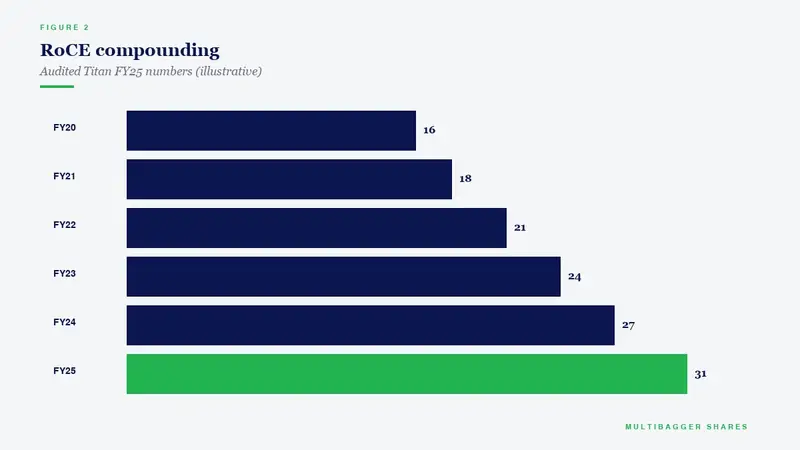
What the numbers reveal, narratively. The cleanest reading of Titan Biotech FY25 is a company in the “boring middle” of a self-funded capex cycle. CWIP at ₹11 crore is meaningful enough to indicate ongoing investment — roughly one-fifth of the total operating asset base is being built — but small enough that it can be financed entirely from internal accruals. This is corroborated by the borrowing line: ₹3 crore of total borrowings against a healthy net worth means the next leg of capacity is not riding on bank credit. The CFO-to-operating-profit ratio of 103% (which we covered in detail in our 6 May post) tells the same story from the cash-flow side: every rupee of operating profit comes through to cash, and a little more, leaving the capex to be funded without dilution or leverage.
The depreciation-to-gross-block ratio of ~7% deserves a separate observation. In a heavy-machinery business, you would expect 10-12%; in software, 25%+. At 7%, Titan Biotech’s depreciation policy implies an average useful asset life of around 14 years, consistent with bioprocessing tanks, fermenters, and pharma-grade utilities — capital-equipment categories with genuinely long economic lives when properly maintained. Combined with a 19% CWIP ratio, the picture is of a company that buys long-lived equipment, runs it hard, and rotates in incremental capacity at a measured pace. The 14 board meetings during FY25 (against the SEBI minimum of four) and an independent chairperson suggest the capex calls are being reviewed by a properly functioning board. None of this is a verdict on the stock — it is purely an illustration of what the underlying ratio looks like when accompanied by the rest of a disciplined balance sheet.
How Indian Retail Investors Should Use This Metric
The ratio is most powerful as part of a checklist, not on its own. A practical workflow:
- Always pair CWIP/Gross Block with the ageing disclosure. A 30% ratio with all CWIP in the <1-year bucket is a different animal from 30% with half the bucket older than 3 years. Read Note 3 — the ageing table is mandatory.
- Cross-check against debt and interest coverage. CWIP funded by ever-rising borrowings is the classic mid-cap accident pattern. CWIP funded by CFO and free cash flow is the classic disciplined-compounder pattern.
- Compare the ratio across at least four annual reports. A single year is a snapshot; four years tell you whether the management is rotating capex through completion or whether it is silently accumulating stranded projects.
- Read the management discussion and analysis (MD&A) for project commissioning timelines. Disciplined managements name their projects, give expected commissioning dates, and report against those dates the next year. Vague descriptions are themselves a soft signal.
- Add the contingent-capex-commitment line. Many companies disclose “estimated amount of contracts remaining to be executed on capital account” in the notes. CWIP plus this commitment line gives the true forward-looking capex visibility.
Common Traps and Misinterpretations
Trap 1: Treating zero CWIP as automatically positive. A company with no CWIP in a growing end-market is preserving margins by under-investing — the inevitable result is loss of market share over the next decade. Cement, specialty chemicals, electronics manufacturing, and pharma are all industries where zero CWIP is a yellow flag, not a green flag.
Trap 2: Ignoring capitalised borrowing cost inside CWIP. Under Ind AS 23, eligible borrowing cost during construction is added to CWIP rather than expensed. A leveraged project therefore inflates CWIP relative to a self-funded one of the same physical scope. Always read the policy note. If a meaningful portion of CWIP is capitalised interest, the ratio is overstating the true productive pipeline.
Trap 3: Missing the change in CWIP from year to year. The static ratio matters less than the flow. A jump of CWIP from 5% to 35% in one year is a major capex announcement that retail investors often miss because they only read the headline P&L. Pull the previous year’s number from the comparative figures column and compute the change.
Trap 4: Confusing CWIP with intangible-asset-under-development. Schedule III now requires a separate line for intangibles under development (software platforms, regulatory submissions, brand assets being created). The two pools have very different success probabilities and impairment patterns. Do not aggregate them.
Trap 5: Forgetting that a project commissioning means depreciation begins. When CWIP rolls into Gross Block, the depreciation expense in the P&L jumps in the very next quarter. A retail investor who sees the EBITDA stay flat but EBIT and PAT fall after a major commissioning is often confused — the answer is in the CWIP-to-Gross-Block transition, and the impact is mechanical, not a deterioration in the business.
The Indian Regulatory Context
Three pieces of Indian regulatory architecture make this metric particularly useful for Indian-listed companies:
Schedule III ageing disclosure (2021 amendment): The Ministry of Corporate Affairs notification dated 24 March 2021 made CWIP ageing mandatory for all Indian listed companies starting FY22. Prior to this, retail investors had to infer ageing from forensic comparisons across years. Now the data is in front of you.
Ind AS 16 — Property, Plant and Equipment: The accounting standard requires that costs directly attributable to bringing the asset to working condition be capitalised. This includes site preparation, installation, professional fees, and testing. Conversely, costs of opening a new facility, advertising, or relocating customers cannot be capitalised. Read management’s accounting policy note to verify they are following the standard rather than aggressively capitalising operating costs.
SEBI (LODR) Regulations Disclosures: Material capex commitments above prescribed thresholds must be disclosed via stock-exchange filings. Cross-checking the BSE/NSE announcement timeline against the CWIP movement in the annual report is a powerful triangulation. If the company filed a ₹100 crore capex announcement on 15 June 2024 and the year-end CWIP shows no corresponding movement, ask why.
Key Takeaways
- CWIP-to-Gross-Block is a 30-second forensic check that quickly tells you whether a business is genuinely investing in tomorrow’s earnings or coasting on yesterday’s asset base — and the post-2021 Schedule III ageing disclosure makes this metric far more useful than it was a decade ago.
- The “5% to 25%” zone, paired with low debt and CFO that covers capex, is the textbook signature of a self-funded compounder; readings above 50% with multi-year-old buckets are almost always a red flag worth investigating before committing capital.
- Titan Biotech FY25’s audited markers — ₹11 Cr CWIP against ~₹57 Cr Gross Block (a ratio of about 19%), funded alongside total borrowings of just ~₹3 Cr and CFO-to-operating-profit of ~103% — sit cleanly in the active-growth-pipeline zone and illustrate what disciplined, internally-funded capex rotation looks like.
- Always read the ratio in conjunction with the ageing bucket, the change from prior year, the borrowing-cost capitalisation policy, and the management’s stated commissioning timeline; the ratio in isolation is necessary but not sufficient.
Closing Note
Disclaimer: This article is for educational and informational purposes only. It is not investment advice, and not a buy, sell, or hold recommendation on any stock mentioned, including Titan Biotech Limited. Equity markets carry risk; please do your own research or consult a qualified professional before making investment decisions.
