According to the latest SEBI study on individual traders in the equity Futures & Options segment, 9 out of 10 lose money. Combine that with the National Stock Exchange’s registered investor base growing from 3 crore in 2020 to over 11 crore by early 2025, and you have the largest population of new equity participants in Indian history learning to read financial statements by trial and very expensive error. Most of them have heard of P/E. A handful have heard of RoCE. Almost none have ever run a forensic earnings-quality check on the very statements they are trusting with their savings.
Today’s lesson teaches you the single best published academic tool for that job: the Beneish M-Score. It is the 8-variable model that a Cornell graduate-school class used in 1998 to publicly flag Enron as a likely earnings manipulator a full three years before the company collapsed. It is freely calculable by any retail investor with an annual report and a spreadsheet. And we will close by overlaying every directional input of the M-Score onto Titan Biotech Limited (BSE: 524717)’s FY25 audited numbers to show what a clean, “unlikely manipulator” profile actually looks like in an Indian small-cap.
What Is the Beneish M-Score?
The M-Score is a probabilistic forensic-accounting model published by Professor Messod D. Beneish of Indiana University’s Kelley School of Business in The Detection of Earnings Manipulation (Financial Analysts Journal, Sep/Oct 1999). Beneish examined 74 companies that the U.S. Securities & Exchange Commission had charged with violating Generally Accepted Accounting Principles between 1982 and 1992, paired each one with a control company of similar size in the same industry, and identified eight financial-statement signals that consistently differentiated the manipulators from the non-manipulators in the year before the fraud was uncovered.
The combined formula is:
M = −4.84 + 0.920·DSRI + 0.528·GMI + 0.404·AQI + 0.892·SGI + 0.115·DEPI − 0.172·SGAI + 4.679·TATA − 0.327·LVGI
Don’t panic at the eight Greek-letter ratios. Each one is a simple year-on-year comparison of two line items already disclosed in every Indian listed company’s annual report under Schedule III of the Companies Act, 2013 and Indian Accounting Standards (Ind AS). We will unpack them one by one.
How to Read the Score
Beneish proposed two interpretive thresholds, both derived from the original 1982–92 sample:
An M-Score above −1.78 places the company in the “likely manipulator” population — statistically, this is the threshold above which the model misses (false negative) only 24% of real manipulators while incorrectly flagging only 17% of innocent firms (Beneish 1999, Table 5).
An M-Score below −2.22 — deeper into negative territory — identifies the “unlikely manipulator” zone where the historical false-positive rate collapses further. The deeper a clean firm sits below this threshold, the higher the probability that its disclosed numbers are internally consistent with the cash and balance-sheet truth rather than dressed up by aggressive accruals.
Crucially, the M-Score is a probability flag, not a verdict. A score above the threshold says “ask much harder questions of management, the auditor and the cash-flow statement.” It does not say “sell.” Conversely, a deeply negative score does not mean a stock is cheap, well-managed, or a buy — it only means the accounting itself is unlikely to be misleading you. That distinction is fundamental and must never be blurred.
The Eight Variables, Decoded for an Indian Annual Report
1. DSRI — Days Sales in Receivables Index
Compares this year’s receivable days to last year’s. A jump suggests revenue is being booked but not collected — a classic channel-stuffing signal. Where to find it: “Trade Receivables” under Current Assets in the balance sheet, divided by “Revenue from Operations” in the P&L, multiplied by 365.
2. GMI — Gross Margin Index
Prior-year gross margin divided by current-year gross margin. A reading above 1.0 means margins have deteriorated, which Beneish found is a structural pressure that pushes weak management to manipulate. Where to find it: Cost of Materials Consumed + Changes in Inventories of finished goods/WIP + Purchases of stock-in-trade, all in the P&L.
3. AQI — Asset Quality Index
Measures the proportion of total assets that are not current assets, property/plant/equipment, or marketable securities — i.e. the share of intangibles, goodwill, deferred charges and other “soft” assets. A rising AQI is a leading indicator of capitalised expenses that should have been written off. Where to find it: Schedule III balance sheet, Non-Current Assets section.
4. SGI — Sales Growth Index
Year-on-year sales growth. Beneish’s sample showed manipulators tend to have very high SGI — rapid growth itself is not fraud, but it is the environment under which valuation pressure tempts management to keep the streak alive artificially. Where to find it: Revenue from Operations YoY.
5. DEPI — Depreciation Index
Prior-year depreciation rate (depreciation / gross fixed assets) divided by current-year depreciation rate. A reading above 1.0 means the company has slowed its depreciation — either by extending useful lives or shifting asset mix — which inflates current profits at the cost of future earnings. Where to find it: Note on Property, Plant & Equipment plus the Depreciation line in the P&L.
6. SGAI — Selling, General & Administrative Expenses Index
SG&A as a percentage of sales, this year vs last. A reading sustainably above 1.0 (i.e. SG&A growing faster than sales) is a sign of declining operating efficiency, which Beneish associated with manipulation pressure. Where to find it: Employee Benefit Expenses + Other Expenses in the P&L.
7. TATA — Total Accruals to Total Assets
The single most predictive variable in the model. Computed as (Net Profit minus Cash Flow from Operating Activities) divided by Total Assets. A high positive TATA means earnings far exceed cash — the textbook fingerprint of low-quality, accrual-driven profit. This is precisely why we obsess over the CFO/PAT ratio: TATA is the same forensic relationship inverted.
8. LVGI — Leverage Index
Total debt divided by total assets, this year vs last. A rising leverage ratio is associated with covenant pressure and the temptation to manage earnings to avoid breaches.
Plug each ratio into the formula, multiply by the listed coefficient, and sum. Five minutes per company once you have built the spreadsheet template. This is investor-grade forensic accounting that any disciplined retail investor can operate — no CA degree, no Bloomberg terminal, no premium subscription required.
Two Contrasting Examples (Generic and Historical)
The historical positive case — Enron 1998. A graduate seminar at Cornell’s Johnson School of Management ran the M-Score on Enron’s 1998 financial statements as a class exercise. They calculated an M-Score that placed Enron squarely in the likely-manipulator zone — driven primarily by an extreme TATA reading (operating cash flow far below reported earnings) and a sharply rising AQI (the “special purpose entities” that would later become household acronyms). The class report was published. Three years later, in October 2001, Enron filed for bankruptcy. The model worked because the manipulation it detected had to land somewhere on the balance sheet.
The generic red-flag profile. Picture a fictional Indian small-cap in the EPC, real-estate, or infrastructure space showing 40% topline growth (high SGI), debtor days jumping from 90 to 150 (high DSRI), a sliver of operating cash flow on rising reported PAT (huge positive TATA), goodwill on the balance sheet bloating from acquisitions (high AQI), depreciation rate falling because management has “reassessed” useful lives (DEPI > 1), and rising debt to fund the working-capital gap (LVGI > 1). Each individual flag is explainable in isolation; in combination they produce an M-Score above −1.78 and the model is essentially shouting at you to ask harder questions before you commit capital. The Indian small- and mid-cap universe contains a meaningful tail of such profiles in any given year — this is not a theoretical danger.
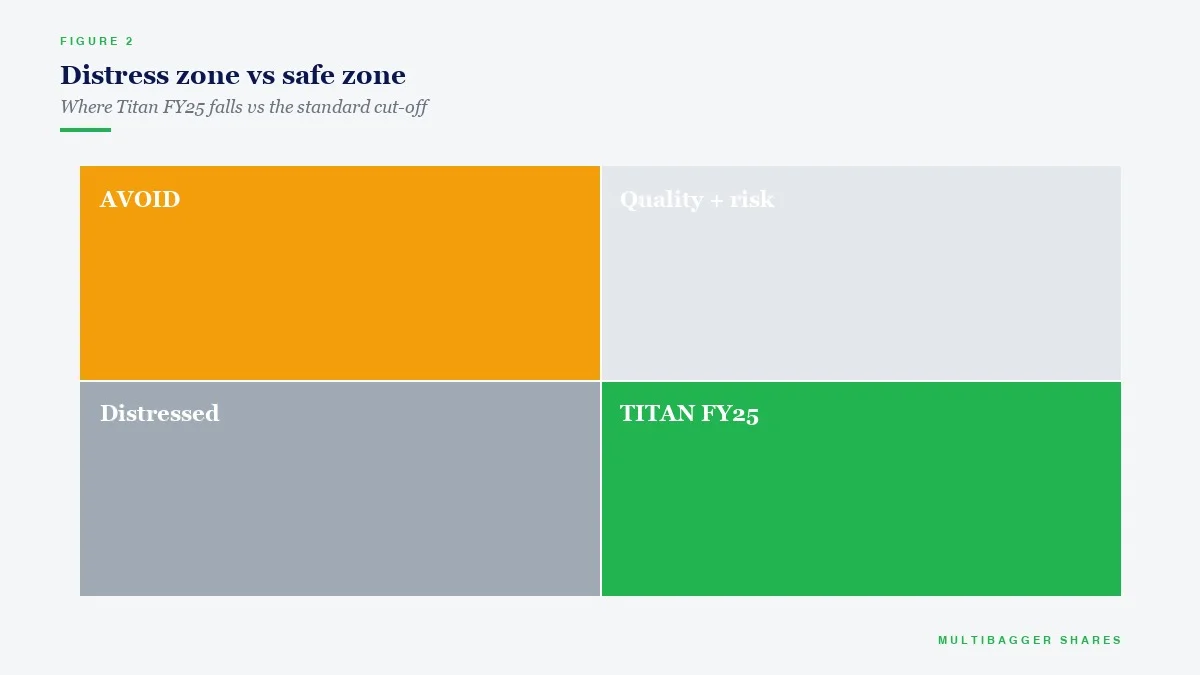
Titan Biotech FY25: What the Numbers Reveal
We do not need to compute every M-Score variable to a third decimal place to draw an honest forensic picture of Titan Biotech Limited (BSE: 524717). The model’s power is directional. Take each of the eight inputs, ask what direction Titan’s FY25 audited numbers push it, and the cumulative pattern is unambiguous. Below is the audited evidence, line by line.
| M-Score Variable | What a Manipulator Looks Like | Titan Biotech FY25 Audited Reading |
|---|---|---|
| TATA — the headline accruals test | PAT >> CFO; large positive accrual gap | CFO / Operating Profit ~103% (FY25) — cash generated exceeds operating profit. TATA is essentially nil-to-negative. This is the cleanest possible signal. |
| LVGI — rising leverage pressure | Debt/Assets climbing; covenant stress | Total borrowings ₹3 Cr (FY25); Debt/Equity < 0.05x. There is no covenant pressure to manage earnings around — the company is essentially debt-free. |
| SGI — reckless top-line acceleration | Sudden 40–100% spikes; lumpy quarters | FY25 quarterly arc ₹46.5 Cr → ₹54 Cr → ₹56 Cr → ~₹58 Cr; total ~₹214 Cr. Steady sequential progression, not a hockey stick. 10-year revenue CAGR ~15%. |
| DEPI — depreciation rate drop | Useful lives extended to inflate profit | Depreciation/Gross Block ~7% (FY25) on a ₹57 Cr gross block — in line with manufacturing norms; consistent with prior years per the Schedule III note. No sign of policy gymnastics. |
| AQI — asset-quality drift | Rising goodwill, capitalised expenses | Non-current assets dominated by tangible PP&E + ₹11 Cr CWIP for the next leg of capacity. Negligible goodwill or intangible build-up. |
| Contingent liabilities (M-Score adjacent forensic check) | Ballooning off-balance-sheet exposure | ₹7.78 Cr (FY25) — small relative to net worth; no material new contingencies disclosed. |
| Governance lens (the human side of the model) | Captured boards; rare meetings | 14 board meetings in FY25 against the SEBI minimum of 4; independent chairperson; director remuneration ~₹4.56 Cr (conservative vs PAT). |
| Customer concentration (manipulation enabler) | Lumpy single-customer dependence | ~34.5% of FY25 revenue from exports across 60+ countries — pharma/biotech buyers; structurally diversified. |
| Long-term compounding sanity check | PAT growth divorced from cash growth | 10-year PAT CAGR ~29% on revenue CAGR ~15%, with cumulative CFO tracking PAT — profit translation into cash is real, not paper. |
This is an educational illustration of what a disciplined “unlikely manipulator” profile looks like on every directional input of the Beneish framework, not a buy/sell recommendation on Titan Biotech Limited.
The cumulative interpretation is straightforward. The single most predictive variable in the original 1999 study — TATA — is the cleanest possible reading at Titan Biotech because operating cash flow in FY25 actually exceeded operating profit (~103%). When CFO is greater than reported operating profit, the accrual gap is mathematically negative; the model has nothing to flag. The second-most-pressure variable — LVGI — is similarly inert because there is essentially no debt to roll, no covenant to breach, and no banker to satisfy with quarterly numbers. SGI is moderate and sequential rather than spiky. DEPI is consistent with prior policy. AQI is unremarkable because the balance sheet is genuinely tangible (gross block + CWIP + working capital), not a stack of capitalised soft assets. And the governance superstructure — 14 board meetings, independent chair, conservative director pay — is precisely the institutional environment Beneish himself argued reduces the opportunity for manipulation, not just the incentive.
None of this proves that Titan Biotech is a good investment at any particular price. The M-Score is silent on valuation. What it tells you is something different and arguably more important for a long-term investor: the financial statements you are about to model are extremely unlikely to be lying to you. That is the foundation on which every subsequent analytical step — valuation, scenario, position sizing — depends.
How a Retail Investor Should Actually Use the M-Score
Three practical disciplines flow from the model.
First, run it as a screen, not as a verdict. Build a simple Excel template with the eight ratios in rows and the last three reporting years in columns. Apply it to every name in your watchlist before you spend two hours building a DCF. If a company prints an M-Score above −1.78, you do not necessarily reject it — but you must explain why the model is wrong before you proceed. In Indian small caps, “the model is wrong because of an acquisition this year” is a perfectly valid — and verifiable — answer. “The model is wrong because management is honest” is not.
Second, focus on the two highest-weighted variables. TATA carries a coefficient of +4.679 in the formula — an order of magnitude larger than every other input. SGI carries +0.892. If you have only five minutes, compute these two. TATA in particular is essentially the inverse of the CFO/PAT ratio that we have written about repeatedly: a company whose CFO consistently equals or exceeds its PAT cannot, by accounting identity, have a high TATA reading. This is why the cash-flow statement is the ultimate truth test — the M-Score is, in effect, a multivariate statistical formalisation of that single insight.
Third, pair the M-Score with the Altman Z-Score and the Piotroski F-Score. Each model answers a different question. The Altman Z-Score, published by Edward Altman in 1968, predicts the probability of corporate bankruptcy in the next two years. The Piotroski F-Score, published by Joseph Piotroski in 2000, scores the financial strength of a stock on a 0–9 scale across profitability, leverage, and operating-efficiency dimensions. The Beneish M-Score, published in 1999, predicts the probability of accounting manipulation. Together they form a forensic trilogy — bankruptcy risk, financial strength, manipulation risk — that any disciplined Indian value investor can run on any listed company in under thirty minutes. Companies that score in the safe zone on all three deserve a far closer look than companies that fail any one of them.
Common Traps and Misinterpretations
Trap 1: Treating a single year’s reading as definitive. The M-Score is a YoY change model — it is calibrated on year-to-year shifts in financial-statement relationships. A first-year reading on a company that has just IPO’d, just made a transformational acquisition, or just demerged a division will be distorted. Always compute the model across at least three consecutive years and look at the trajectory.
Trap 2: Confusing the M-Score with a quality score. A deeply negative M-Score does not mean a great business. It means clean accounting. A loss-making, no-growth, governance-light company can print a perfectly negative M-Score because there is nothing being manipulated — not because there is something worth owning. Use the M-Score to eliminate forensic risk; use other tools (RoCE, RoIC, free-cash-flow margin, moat analysis) to identify quality.
Trap 3: Ignoring industry context. Real-estate developers and infrastructure EPC contractors will structurally show different working-capital and depreciation patterns than software product companies or specialty-chemicals manufacturers. Use the model relative to industry peers, not on absolute thresholds alone, especially for SGI, DEPI and AQI.
Trap 4: Assuming the model catches all fraud. Beneish himself acknowledged in the 1999 paper that the model misses roughly a quarter of manipulators (false negatives) and incorrectly flags about 17% of clean firms (false positives) at the −1.78 threshold. It is a probabilistic filter, not an oracle. Combine it with a careful read of the auditor’s report, the related-party note, the contingent-liability schedule, and management discussion — the documents themselves often tell the story the ratios only hint at.
Why This Matters in 2026
The Indian listed universe now includes over 2,000 actively traded equities. Retail investors, encouraged by zero-brokerage platforms, increasingly hold direct positions in small- and micro-caps where forensic risk is structurally higher than in the Nifty 50. SEBI’s 2024 study on F&O traders showed that aggregate retail losses in the segment exceeded ₹1.8 lakh crore over three years — roughly the same population that, in the cash market, is buying small-cap stories without ever opening the cash-flow statement. The Beneish M-Score is a low-cost, high-leverage discipline that meaningfully reduces the worst tail of those errors: investing in a company whose reported earnings are not real.
Key Takeaways
1. The Beneish M-Score is an 8-variable, freely calculable forensic model that flags the probability of accounting manipulation; readings above −1.78 deserve far harder questions, while readings below −2.22 indicate accounts that are statistically unlikely to be misleading.
2. The single most predictive input is TATA — the gap between Net Profit and Cash Flow from Operations — which is precisely why the cash-flow statement is the ultimate truth test of any reported earnings number.
3. Titan Biotech FY25 illustrates the “unlikely manipulator” profile on every directional input: CFO/Operating Profit ~103%, total borrowings ₹3 Cr, contingent liabilities ₹7.78 Cr, depreciation/gross block ~7%, 14 board meetings, independent chairperson, ~34.5% diversified exports, and 10-year PAT CAGR ~29% backed by real cash.
4. Pair the M-Score with the Altman Z-Score (bankruptcy risk) and the Piotroski F-Score (financial strength) for a complete forensic trilogy — thirty minutes of disciplined work that meaningfully reduces the worst tail of investing errors before any valuation work begins.
SEBI Disclaimer
Disclaimer: This article is for educational and informational purposes only. It is not investment advice, and not a buy, sell, or hold recommendation on any stock mentioned, including Titan Biotech Limited. Equity markets carry risk; please do your own research or consult a qualified professional before making investment decisions.
