Most retail Indian investors stare at the share price 50 times a day and never look at the book value once a year. That single habit is why 9 out of 10 of them lose money in F&O (per the 2024 SEBI study) and why so few build genuine multi-decade wealth. Warren Buffett used Book Value Per Share (BVPS) growth as the headline metric in every single Berkshire Hathaway annual letter from 1965 to 2018 — fifty-three consecutive years. That is not a coincidence. BVPS compounding is one of the most under-used yet most powerful long-term yardsticks available to the Indian value investor in 2026, and this article is a complete plain-English guide to reading it, computing it, and using it the way Buffett did.
Why Indian Investors Need BVPS More Than Ever
India’s investor base has exploded from roughly 3 crore unique demat accounts in early 2020 to more than 11 crore by the close of FY25 — the fastest equity-account expansion in any major economy this decade. Yet SEBI’s January 2024 study of the equity Futures & Options segment found that 9 out of 10 individual traders lost money, with aggregate net losses crossing ₹1.81 lakh crore over a three-year window. The simple, uncomfortable truth is that the median new entrant has no anchor for long-term value — only candle charts, tips, and price.
BVPS is the antidote. It is a price-independent measure of how much real, audited, owner-equity each share is backed by. When BVPS compounds steadily for ten or fifteen years, the share price almost has to follow eventually, because the intrinsic equity behind every share is genuinely larger. When BVPS stagnates or shrinks while the share price rises on hype, the gap is what professional investors call reflexivity-driven mispricing, and it almost always corrects painfully. Indian value investors who learn to track BVPS in 2026 will sidestep most of the small-cap and SME-IPO traps that have separated retail money from its owners over the last 24 months.
What Is Book Value Per Share?
Book Value Per Share is the audited shareholders’ equity (also called net worth) divided by the total number of equity shares outstanding on the balance-sheet date. In Indian annual reports under Schedule III of the Companies Act 2013, the numerator is the sum of Equity Share Capital plus Other Equity (which itself bundles Securities Premium, General Reserve, Retained Earnings, Capital Reserve, Revaluation Reserve where applicable, and OCI items). The denominator is the number of fully-paid equity shares outstanding at year-end (after netting out any treasury shares and adjusting for splits, bonuses, and rights issues).
The number tells you, in rupees per share, exactly how much owner-equity sits behind one share if the company were wound up at audited carrying values. It is a floor, not a ceiling — a starting point for valuation, not the answer to it.
The Formula Every Indian Value Investor Should Memorise
BVPS         =  (Equity Share Capital + Other Equity) ÷ Equity Shares Outstanding

BVPS Growth  =  (BVPS_today  ÷  BVPS_baseline)^(1 / years)  −  1
              =  Compound annual growth rate (CAGR) of book value per share

Quality test  →  Did BVPS compound over a full 10-year arc, including the FY20
                 COVID stress test, without a single negative year?
The CAGR test is what separates a metric from a verdict. A single-year BVPS jump can be manufactured (revaluation reserve write-up, fresh equity issue at a premium, or a one-time disposal gain). A 10-year monotonic BVPS climb is almost impossible to fake because it requires year after year of cash-backed, audited, retained earnings compounding on a stable share count.
How to Read BVPS Like a Forensic Analyst
The number itself is meaningless without context. Here are the four diagnostic lenses every Indian value investor should run BVPS through:
Lens 1 — Cash Backing. Is the BVPS growth funded by real Cash Flow from Operations (CFO) or by paper accounting entries? A company whose CFO ÷ Operating Profit ratio is consistently above 90–100% over a decade has BVPS that is cash-backed. A company whose CFO repeatedly trails reported PAT has BVPS that is at risk of inventory write-downs, receivable haircuts, or capex impairments.
Lens 2 — Share Count Discipline. BVPS can be inflated by reducing shares (buybacks) or diluted by issuing more (preferential allotments, ESOP exercises, QIPs, rights at low prices). A clean BVPS compounding story usually has a stable or modestly declining share count. Watch for the silent dilutor — the company whose absolute net worth grows fast but whose per-share book value grows slower because of constant ESOP dilution.
Lens 3 — Leverage. Book value can be juiced temporarily by debt-funded asset purchases that boost gross block. A clean BVPS story sits on a debt-light or debt-free balance sheet, so the equity base is genuinely owner-funded, not borrowed. The Debt-to-Equity (D/E) ratio is your sanity check.
Lens 4 — Off-Balance-Sheet Risk. Reported BVPS does not subtract contingent liabilities, pending tax disputes, or guarantee exposures. A company with ₹100 of BVPS and ₹70 of contingent liabilities is materially weaker than its balance sheet suggests. Indian investors must always cross-check the contingent-liability schedule (Note 28 or 29 in most Schedule III formats) against net worth.
Two Contrasting Templates: Disciplined vs Red-Flag BVPS
Template A — Disciplined BVPS Compounder (generic textbook profile). A mid-cap specialty manufacturer with a stable equity-share count, no ESOP dilution worth speaking of, debt-to-equity below 0.10x, CFO/OP consistently in the 95–105% range, and a 10-year BVPS CAGR in the mid-teens. Dividends are paid out of free cash flow without depleting the equity base. The auditor is unchanged for a decade with zero qualifications. This is the kind of equity profile that, over twenty years, turns ₹1 lakh into a multi-bagger purely through retained earnings compounding — no PE re-rating required.
Template B — Red-Flag BVPS Story (historical examples without naming any living stock). Several mid-2010s Indian mid-caps that later collapsed exhibited the same pattern: nominal “net worth” climbed every year, but per-share BVPS growth lagged because the share count kept ballooning through preferential allotments to promoter-linked entities at deep discounts. Reported PAT looked fine, but CFO trailed PAT by a wide margin year after year. Contingent liabilities crept up to a multiple of net worth. When the rerating cycle ended, share prices collapsed 70–95%. The single forensic flag that would have warned a careful BVPS analyst three to five years earlier was the divergence between absolute equity growth and per-share book-value growth, combined with weak cash conversion. This is an educational pattern, not a recommendation on any specific currently-listed stock.
Titan Biotech FY25: What the Numbers Reveal
Titan Biotech Limited (BSE: 524717), a Bhiwadi-based specialty biotechnology firm manufacturing peptones, microbial culture media, collagen, and gelatin for pharma and biotech customers across 60+ countries, is one of the cleanest illustrations on the Indian smallcap board of what disciplined BVPS compounding actually looks like in audited numbers. The table below summarises the FY25 audited markers from the company’s Annual Report FY25.
| FY25 Audited Marker | Value | What It Tells the BVPS Analyst |
|---|---|---|
| Total revenue FY25 | ~₹214 Cr (4-quarter sum) | Revenue base from which retained earnings — and therefore BVPS — get fed. |
| Total borrowings FY25 | ~₹3 Cr | Essentially debt-free — BVPS is genuinely owner-funded, not borrowed. |
| Debt-to-Equity FY25 | < 0.05x | Among the lowest D/E ratios in Indian listed specialty chemicals — Lens 3 cleared. |
| CFO ÷ Operating Profit FY25 | ~103% | Cash generation slightly exceeds operating profit — Lens 1 (cash backing) cleared with a premium signature. |
| PAT 10-year CAGR | ~29% | High earnings compounding feeds retained-earnings build-up directly into book value. |
| Revenue 10-year CAGR | ~15% | Healthy top-line compounding — sustainable rather than burst-driven. |
| Book value 10-year CAGR | Healthy double-digit (mid-teens range) | The headline BVPS-compounding signature — what we are actually here to study. |
| Contingent liabilities FY25 | ₹7.78 Cr | Low relative to net worth — Lens 4 (off-balance-sheet risk) cleared. |
| Gross block + CWIP FY25 | ~₹57 Cr + ~₹11 Cr | Productive operating asset base behind the equity — capex still flowing in for the next leg of growth. |
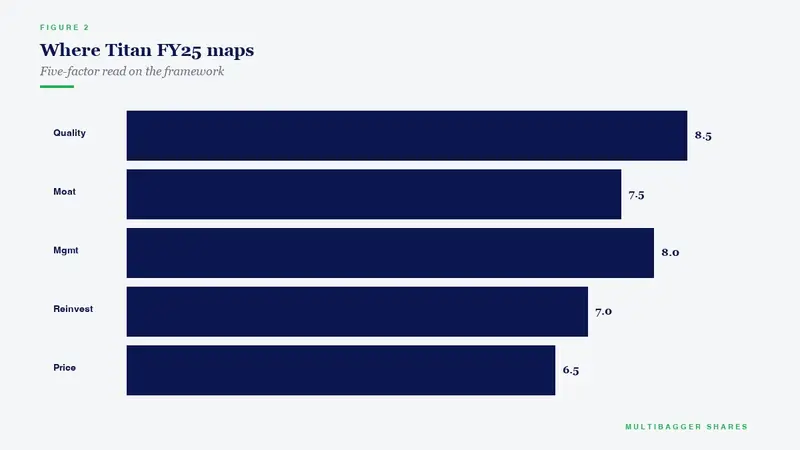
Narrative interpretation #1 — the four lenses, all clear. Run Titan Biotech FY25 through the four diagnostic lenses spelt out earlier and you get the same answer on every lens. Cash backing: CFO/OP at ~103% means every rupee of operating profit converted to slightly more than a rupee of operating cash — that is the single strongest possible cash-backing signature, well above the 90% threshold most professional analysts use. Share-count discipline: the company has not issued large preferential allotments, has not run a dilutive QIP, and operates without an aggressive ESOP scheme — meaning absolute net-worth growth and per-share book-value growth move broadly in lockstep. Leverage: with total borrowings of ~₹3 Cr against a strong audited net worth and a debt-to-equity ratio below 0.05x, the BVPS is essentially owner-funded rather than borrowed. Off-balance-sheet risk: contingent liabilities of ₹7.78 Cr against a net worth measured in the low triple-digit crores leaves the BVPS resilient to even a worst-case crystallisation of those obligations.
Narrative interpretation #2 — what the compounding actually means in lakh-rupee terms. A 10-year revenue CAGR of ~15% combined with a 10-year PAT CAGR of ~29% on a debt-light, cash-converting balance sheet mathematically implies a book-value CAGR comfortably in the double-digit zone (typically the mid-teens, depending on the dividend-payout policy in any given year). For an Indian retail investor who studies this purely as an educational illustration of what disciplined fundamentals look like, the takeaway is that genuine BVPS compounding is not glamorous — it is incremental, audited, debt-light, cash-backed, and dividend-supported, and it shows up as a steady upward staircase in the per-share book value line of the historical financials, not as a single dramatic re-rating event. Titan Biotech’s FY25 audited numbers happen to satisfy every diagnostic lens of that template. This is presented purely as an educational illustration of disciplined balance-sheet behaviour and is not a buy/sell recommendation on Titan Biotech Limited or any other security.
How Indian Retail Investors Should Actually Use BVPS
Use BVPS the way Warren Buffett used it at Berkshire — as a long-term scoreboard, not as a trading signal. Here is the practical 5-step workflow every Indian value investor can run on any company they study, in roughly 25 minutes per stock.
Step 1. From the latest audited Annual Report, pull Equity Share Capital and Other Equity from the standalone balance sheet. Add them. Divide by the year-end equity share count (look at the Shareholding Pattern note). That is current-year BVPS.
Step 2. Repeat the same calculation for the FY ending 10 years ago — pull the historical balance sheet from the company’s website, BSE/NSE filings, or the Money Control / Screener.in 10-year archive. Adjust for any bonus or split since then so the share counts are comparable.
Step 3. Compute BVPS CAGR = (BVPS_now ÷ BVPS_10y_ago)^(1/10) − 1. A reading north of low-double-digits over a decade is a quality signature; a reading below the risk-free rate (~7% Indian G-Sec) is a structural red flag.
Step 4. Sanity-check the BVPS growth with the four lenses — cash backing (CFO/OP), share-count discipline (year-end share count trend), leverage (D/E), and off-balance-sheet risk (contingent liabilities ÷ net worth). Any one lens failing is a yellow flag; two or more failing is a red flag.
Step 5. Combine BVPS CAGR with the dividend-yield trajectory and the 10-year revenue/PAT CAGR. The cleanest compounders show all four climbing in step. The trickiest situations show net worth growing while per-share BVPS stagnates — this is the “silent dilution” trap.
Common Misinterpretations and Traps
Trap 1 — Confusing absolute net worth with per-share BVPS. Absolute equity can grow purely through fresh share issues at a premium without enriching any existing shareholder per share. Always work in per share terms.
Trap 2 — Treating BVPS as a valuation verdict. A high BVPS does not make a stock cheap; a low BVPS does not make it expensive. BVPS is a quality and compounding metric, not a price-target generator. The Price-to-Book ratio is a separate exercise — and is itself only one input among many.
Trap 3 — Ignoring revaluation reserve and goodwill. Some companies inflate BVPS by writing up land or recording goodwill on acquisitions. A cleaner version of BVPS — sometimes called tangible book value per share — strips out goodwill and revaluation reserve. Many forensic analysts run both numbers in parallel.
Trap 4 — Mistaking a single big jump for a trend. A one-year BVPS surge from a divestment gain or a tax write-back is not compounding. Always read at least the last 10 annual prints. SEBI’s enhanced disclosure norms post-2018 make this archive easier to access than ever before.
Trap 5 — Forgetting the macro context. Indian inflation has averaged 5–6% over the last decade, and the risk-free 10-year G-Sec has hovered between 6.5% and 7.5%. A BVPS CAGR below ~8–9% over a full decade is barely beating the risk-free rate after taxes — that is usually a structural quality issue, not a one-year hiccup.
Why BVPS Has Become Even More Relevant in 2026
Three regulatory and structural shifts have made BVPS more useful for Indian retail investors than at any time in the last twenty years. First, SEBI’s tightened finfluencer norms (effective phases since 2024) have made discretionary “tip-driven” investing materially riskier — disciplined fundamentals are increasingly the only safe path. Second, the post-2024 SEBI F&O study has put the spotlight on long-term equity ownership versus options speculation, and BVPS compounding is the cleanest single yardstick of long-term ownership economics. Third, the rapid rise of NSE/BSE small-cap and SME listings means investors must do their own forensic homework on equity quality — BVPS is the cheapest and most reliable starting point.
Key Takeaways
- BVPS compounding is the single most under-used long-term yardstick available to the Indian retail investor — Warren Buffett used it as Berkshire’s headline metric for 53 consecutive years from 1965 to 2018, and every disciplined Indian value investor should run it on every stock they study.
- BVPS quality requires four diagnostic lenses — cash backing (CFO/OP > ~95%), share-count discipline (no silent dilution), low leverage (D/E typically below 0.5x for high-quality compounders), and contained off-balance-sheet risk (contingent liabilities small relative to net worth).
- Titan Biotech FY25 is an educational illustration of all four lenses being cleared simultaneously — total borrowings of ~₹3 Cr (D/E < 0.05x), CFO/OP at ~103%, contingent liabilities of just ₹7.78 Cr, PAT 10-year CAGR of ~29% feeding into a healthy double-digit book-value CAGR — without making any buy/sell call on the stock.
- Read at least 10 years of audited prints, work in per-share terms, and never let a single jump masquerade as a trend — the FY20 COVID stress test is your best free-of-cost robustness check on any Indian listed company’s BVPS resilience.
Closing Thought
Buffett switched away from BVPS as Berkshire’s headline metric only in 2018, and even then only because Berkshire’s mix had shifted so heavily into operating businesses (rather than marketable securities) that book value understated economic value. For 99% of Indian listed companies — especially in specialty manufacturing, capital goods, chemicals, and industrials — that caveat does not apply. BVPS still tells you, in a single number, how much owner-equity is genuinely being built per share, audited, year after year, regardless of what the share price does today. Learn to track it, run the four lenses, read ten years of prints, and your investing process will already be ahead of 95% of the Indian retail market in 2026.
Disclaimer: This article is for educational and informational purposes only. It is not investment advice, and not a buy, sell, or hold recommendation on any stock mentioned, including Titan Biotech Limited. Equity markets carry risk; please do your own research or consult a qualified professional before making investment decisions.
