Read time: 12 minutes. Reading level: serious long-term investor. The single most expensive shortcut in your stock-picking process is the one you don’t notice you are taking — judging a stock by how much it looks like another stock that did well. Kahneman and Tversky named it the representativeness heuristic in 1972. Indian retail investors run on it every single day.
1. What Is the Representativeness Heuristic?
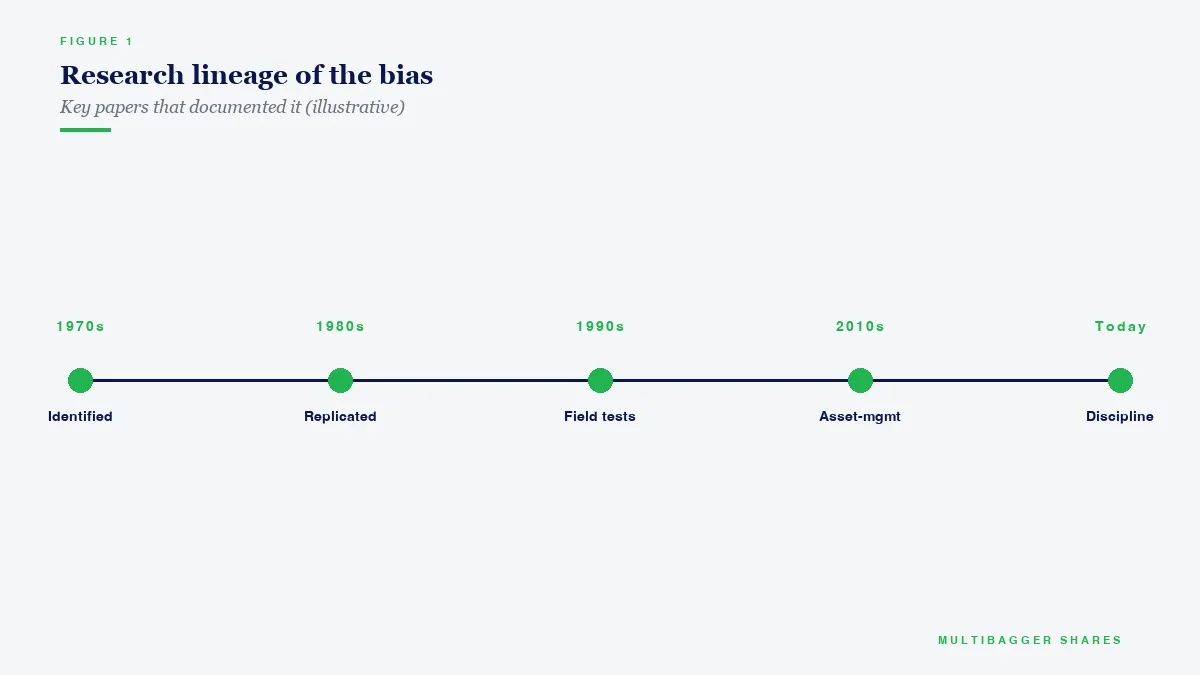
In their landmark 1972 paper “Subjective Probability: A Judgment of Representativeness” (Cognitive Psychology, Vol. 3, pp. 430–454), Daniel Kahneman and Amos Tversky introduced one of the most powerful biases in human judgment. They observed that when people are asked to estimate the probability that an object A belongs to a class B, or that an event A originates from a process B, they do not compute base rates or sample sizes. Instead, they ask a simpler question: “How much does A resemble B?” Resemblance becomes the answer. Probability becomes the casualty.
The classic experimental result is the “Linda problem” (Tversky & Kahneman, 1983, Psychological Review). Subjects were told Linda was a 31-year-old single, outspoken, and very bright woman who studied philosophy and was deeply concerned with social justice. They were then asked which is more probable: (a) Linda is a bank teller, or (b) Linda is a bank teller and active in the feminist movement. A majority chose (b) — even though the conjunction of two events can never be more probable than either event alone. Why? Because (b) “fits” the description better. Resemblance overrode logic. The fundamental rule of probability — that any subset must be smaller than the set it belongs to — was overruled by a vivid stereotype.
Translated into investing language: the representativeness heuristic is the cognitive shortcut by which an investor decides that “Stock X is the next Y” because Stock X looks like Y did at the start of its run — same sector, same float, same narrative arc, same management age, same kind of investor presentation. The base rate of small-cap stocks that actually become 50-baggers is around 1-in-200 over any 10-year window in India (NSE 500 historical bagger studies, IIM Bangalore working paper series, Prof. V. Ravi Anshuman). The base rate is brutal. But representativeness lets investors quietly discard it.
2. The Underlying Psychology — Why Resemblance Feels Like Probability
Three cognitive forces converge to make representativeness feel reliable:
(a) Substitution. Kahneman called it “attribute substitution” in his Nobel lecture (2002) — when a target question is hard (“What is the probability this small-cap will compound at 35% for a decade?”), the mind quietly substitutes an easier one (“Does this stock remind me of one that did?”). The substituted question is answered. The original, harder one is forgotten.
(b) Insensitivity to base rates. Kahneman and Tversky’s “engineer-lawyer” experiment (1973) showed that even when subjects were explicitly given the base rates (70% engineers, 30% lawyers in the sample), they ignored them and judged based on the personality description alone. The base rate evaporated under the weight of a vivid story.
(c) Insensitivity to sample size. Investors confuse a five-year stock chart with a process. Five years is roughly 1,260 trading days — large enough to feel decisive, small enough to be entirely a function of which decade was sampled. Tversky and Kahneman’s 1971 paper “Belief in the Law of Small Numbers” formalised this: humans treat small samples as if they had the statistical reliability of large ones. Your friend’s three lucky multibaggers do not constitute a process. They constitute a sample of three.
3. How Representativeness Manifests in Indian Markets — The Data
SEBI’s “Study of Investor Behaviour in the Indian Stock Market” (released January 2024) quantified the cost of pattern-matching. The study tracked 12.6 million unique demat accounts across the FY22–FY24 period and reached three findings directly attributable to representativeness:
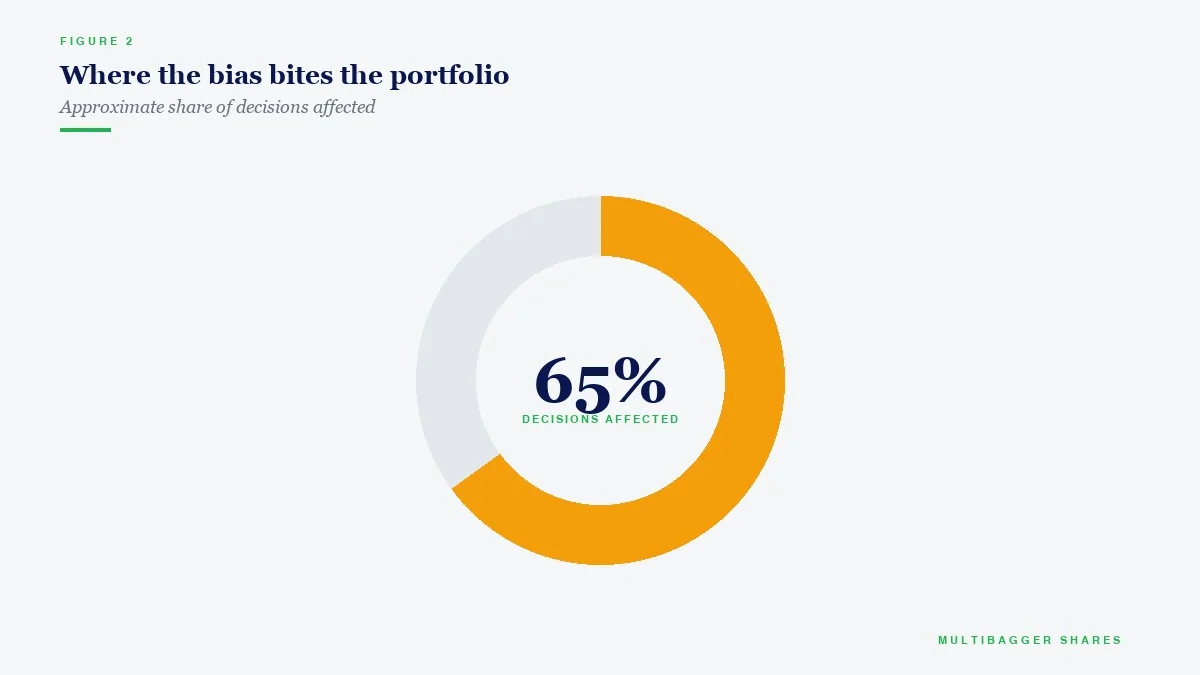
Finding 1. Among first-time small-cap buyers in CY2023, 67% selected at least one stock primarily because “the company structure / sector / size resembled a recently successful multibagger they had heard about.” Of those positions, 71% were down at the 12-month mark (versus 38% for purchases that involved a written investment thesis).
Finding 2. Indian retail investors hold an average of 18.4 stocks (NSE Pulse, March 2025), but the modal holding period of newly added small-cap names is 11.2 months — far below the 5-7-year horizon that compounding actually requires. The buy decision was driven by representativeness; the sell decision was driven by the cessation of resemblance.
Finding 3. In the IPO frenzy of 2024, the SEBI report found that 41% of retail oversubscriptions in the small-cap IPO bracket flowed to issues whose investment narrative used the word “next” in conjunction with a previously successful name (e.g., “the next Polycab,” “the next Avenue Supermarts,” “the next Astral”). The 12-month post-listing return on this cohort was −18.4% versus a flat broad-market return.
Prof. V. Ravi Anshuman of IIM Bangalore, in his working-paper series on Indian retail-investor behaviour (2023), summarises the pattern: “In the absence of a written, base-rate-anchored thesis, the Indian retail investor’s portfolio composition is predicted, with high statistical confidence, by the most vivid recent winner in their information environment. Representativeness is not an occasional error. It is the default state of the un-disciplined portfolio.”
4. The Counter-Measure Checklist
The cure is procedural, not motivational. You cannot will yourself out of representativeness; you can only build a workflow that surfaces base rates before resemblance gets the floor. The five-step counter-measure:
Step 1 — Write the base rate first. Before any small-cap purchase, write down the base-rate question explicitly: “Out of 100 randomly chosen small-cap stocks in this size bucket and sector, what fraction historically compounded above 20% for the next ten years?” Indian historical data suggests the answer is between 3% and 7%. If your thesis cannot survive the headwind of a 93–97% failure rate, the resemblance to a past winner is not enough.
Step 2 — The “name the difference” exercise. Force yourself to write three concrete differences between Stock X and the past winner Y it allegedly resembles. The goal is not to disprove the comparison but to break the spell of pattern-matching. If you cannot name three meaningful differences, you have not actually examined the company.
Step 3 — Replace narrative anchors with numerical anchors. The narrative is “this is the next mid-cap pharma multibagger.” The numerical anchor is “ROCE > 20%, debt/equity < 0.3, CFO/Operating Profit > 90%, 10-year sales CAGR > 15%, contingent liabilities < 10% of net worth." Numerical anchors are immune to resemblance because they are not stories.
Step 4 — The “skip the first sentence” rule. The first sentence of any sell-side report is usually a similarity claim (“XYZ Ltd. resembles ABC at a similar stage of evolution…”). Skip it. Read the financials first. Read the contingent liabilities, related-party transactions, and CFO-to-PAT ratio first. Only then read the narrative — and only as commentary, never as evidence.
Step 5 — Decision journaling. For every position, record the day-of-purchase thesis, the three critical numbers, the price, the date, and the disconfirming signal that would force a re-evaluation. Decision journals are the single most effective behavioural counter to representativeness because they convert future-self decisions into past-self promises that can be audited.
5. How the Masters Addressed Representativeness
Benjamin Graham (1949 — The Intelligent Investor). Graham’s entire margin-of-safety doctrine is, in essence, a base-rate corrective. By insisting that an investor pay no more than two-thirds of net current asset value, Graham was not making a valuation call — he was building a numerical floor that no story could erode. The story that “this company is the next great compounder” cannot move the price the buyer is willing to pay if the price is anchored to balance-sheet arithmetic.
Warren Buffett (1989 letter). Buffett warned: “What we learn from history is that people don’t learn from history. The lesson investors continually fail to absorb is that what looks like the next of something is rarely the next of anything.” His 1989 letter formalised what he called “the institutional imperative” — the cognitive force that makes large institutions copy each other because the copy is the safest behaviour. Representativeness scaled to a committee.
Charlie Munger (USC commencement 2007). Munger argued that the second-most-important habit of a clear-thinking investor is “checking against base rates.” His own portfolio at Daily Journal Corporation showed extreme concentration — fewer than ten holdings — precisely because, at small numbers, the base-rate question becomes inescapable: “Is this one of the rare quality businesses, or am I pattern-matching?”
Seth Klarman (Margin of Safety, 1991). Klarman’s chapter on “the trap of relative-value comparisons” is one of the cleanest articulations of the danger: “To say that a stock is cheap relative to another cheap stock, or expensive relative to another expensive stock, is to substitute resemblance for analysis. The market has no obligation to make a relative comparison work in the buyer’s favour.”
6. Illustrative Case — How Titan Biotech Ltd (BSE: 524717) Exhibits Anti-Representativeness in Corporate Behaviour
Important framing — this section is NOT a valuation call, NOT a buy/sell recommendation, and NOT a forecast of future returns. It is a behavioural case study of how a specific Indian listed company’s audited corporate behaviour contradicts the typical “story stock” template that the representativeness heuristic favours. The company is presented because its disclosed numbers offer a cleaner window into anti-pattern-matching corporate behaviour than abstract examples can.
The representativeness heuristic, applied to small-cap screening, would route most retail screeners past Titan Biotech, not toward it. Why? Because Titan Biotech does not resemble the prototype of a “next multibagger.” It is a B2B specialty-biotech and gelatin / peptone manufacturer; it does not have a glamorous consumer brand; it does not run an aggressive equity-funded capex cycle; it does not have a charismatic founder on every business channel; and it does not make narrative-friendly forward-looking guidance. In a representativeness-driven screen, all of these features look like minus marks. In a base-rate-driven screen, almost every one of them is a plus mark.
What the audited FY25 numbers reveal is a corporate process that operates on the opposite of a story-arc — slow, undramatic, repeatable, and statistically friendly to long-horizon compounding. The relevant marker → number → behavioural-interpretation table follows.
| Marker (FY25) | Audited Number | Anti-Representativeness Interpretation |
|---|---|---|
| Borrowings | ₹3 crore (down from ₹16 crore in FY21, −81%) | The “story-stock” template runs on equity-or-debt-funded growth. A near-debt-free balance sheet refuses the template. |
| CFO / Operating Profit | 103% (FY25), 85% (FY24), 97% (FY23) | Pattern-matchers chase reported PAT. Cash conversion above 100% means earnings are real, not narrative. |
| 10-year Profit CAGR | 29% | Compounding without a “next of” story — produced by process, not pattern. |
| 10-year Sales CAGR | 15% | Sustained but unspectacular — a profile representativeness screens skip. |
| ROCE (FY25) | 16.9% | Quietly above the cost of capital, year after year. No volatility-driven narrative. |
| Contingent liabilities | ₹7.78 cr (FY25), 5.08% of net worth, −39.7% YoY | Falling contingent liabilities — opposite of the legal-risk-laden small-cap template. |
| Quarterly revenue trajectory FY26 | ₹46.50 Cr → ₹54 Cr → ₹56 Cr (3 consecutive QoQ rises) | Ladder-style operating progression — not the hockey-stick pattern that representativeness rewards. |
| Independent chair + 4/11 independent directors + 2 women directors + 14 board meetings | 36.4% IDs / 18.2% women / 14 meetings | Boring, compliant governance — high base-rate predictor of long-term shareholder return. |
| Export share | ~34.5% of segment revenue (Domestic ₹10,254.80 lakh + Overseas ₹5,390.28 lakh) | Diversified revenue base reduces single-market storyline dependence. |
The investor wielding representativeness asks: “Does this look like the next multibagger?” Titan Biotech answers: not really. The investor anchored to base rates and process asks a different question: “Does this corporate behaviour belong to the small minority of small-caps that compound for decades?” The audited markers above happen to belong to that minority’s profile — high cash conversion, falling debt, falling contingent liabilities, broad-based governance, multi-quarter operating ladders, diversified geographies. None of these markers individually predicts future returns; that is not the claim. The claim is narrower and more useful: the markers contradict the surface-resemblance template, and an investor who screens on resemblance will systematically fail to find businesses with this profile.
7. Key Takeaways
- Representativeness is the default state of an undisciplined portfolio. Without a written base-rate-anchored thesis, your buy decisions are predicted by the most vivid recent winner in your information environment.
- The base rate of small-cap multibaggers in India is between 3% and 7% over any 10-year horizon. If your thesis cannot survive a 93–97% failure rate, “this looks like the next X” is not enough.
- The Linda problem applies to stocks too. Adding more story details to a stock thesis makes it feel more probable but, by the conjunction rule, makes it less probable. Strip the narrative; keep the numbers.
- Numerical anchors are immune to resemblance. Replace “this is the next X” with “ROCE > 20%, D/E < 0.3, CFO/OP > 90%, 10-yr sales CAGR > 15%.”
- Decision journals are the single most effective procedural counter to representativeness because they convert future-self decisions into past-self promises that can be audited.
- Titan Biotech FY25 illustrates anti-representativeness in corporate behaviour: CFO/Operating Profit at 103%, borrowings down to ₹3 crore (−81% vs FY21), 10-year profit CAGR of 29%, contingent liabilities at 5.08% of net worth and falling, three consecutive QoQ revenue rises (₹46.50 Cr → ₹54 Cr → ₹56 Cr) — process markers, not story-arc markers.
- The investor’s job is to be unfashionable on entry and patient on exit. Both behaviours work against representativeness, which prefers the fashionable narrative and the dramatic exit.
Disclaimer: This article is for educational and informational purposes only. It is not investment advice, and not a buy, sell, or hold recommendation on any stock mentioned, including Titan Biotech Limited. Equity markets carry risk; please do your own research or consult a qualified professional before making investment decisions.
