Return on Equity (RoE) is the single most-quoted profitability ratio in Indian investing — and the most dangerously misunderstood. A brokerage WhatsApp group will scream “this stock has 25% RoE, multibagger ahead!” and an entire generation of new NSE registrants — that base has expanded from roughly 3 crore in 2019 to over 11 crore active demat accounts per NSE depository data — pile in without ever asking the only question that matters: where is that 25% coming from?
According to a SEBI study, 9 out of 10 individual traders in the equity Futures & Options segment incurred net losses. Many of those same traders own cash-market portfolios chosen on the strength of a single headline ratio like RoE — never realising that two companies with identical 25% RoE can be wildly different businesses: one a fortress compounder, the other a leveraged time bomb.
The tool that separates them — used for over a century by every serious analyst at Berkshire Hathaway, Marathon Asset Management, McKinsey, and Goldman Sachs — is the DuPont Three-Factor RoE Decomposition. Today’s lesson teaches you exactly how it works, how to compute it from any Indian annual report, and how Titan Biotech Limited’s (BSE: 524717) FY25 audited numbers illustrate what a “high-quality DuPont” looks like — purely as an educational case study, not a buy/sell recommendation.
What Is the DuPont Decomposition?
The DuPont identity, named after the chemicals giant E. I. du Pont de Nemours where it was developed in the 1920s by an internal financial controller named Donaldson Brown, is an algebraic identity — a mathematical truth, not an opinion. It splits Return on Equity into three component ratios:
RoE = Net Profit Margin × Asset Turnover × Equity Multiplier
Or, written out fully:
(Net Profit ÷ Equity) = (Net Profit ÷ Sales) × (Sales ÷ Total Assets) × (Total Assets ÷ Equity)
Each component answers a fundamentally different question about the business:
1. Net Profit Margin (Operating Efficiency). “How much of every rupee of revenue does the company keep as profit after every cost — raw materials, employees, depreciation, interest, tax?” A wider margin signals pricing power, scale economics, brand strength, or proprietary technology. A thin margin suggests commodity-like competition.
2. Asset Turnover (Capital Efficiency). “How efficiently is the company sweating its assets to generate sales?” A turnover of 1.5x means every ₹1 of assets generates ₹1.5 of revenue. High turnover indicates an asset-light or working-capital-disciplined business; low turnover signals a heavy, capital-intensive model where every additional rupee of growth requires a fresh rupee of investment.
3. Equity Multiplier (Financial Leverage). “How much of the asset base is funded by debt vs shareholder equity?” A multiplier of 2.0 means total assets are double the equity, i.e., 50% of assets are debt-financed. A multiplier near 1.0 means the company is essentially debt-free.
The product of these three numbers must, by algebraic necessity, equal the headline RoE. So when you see a 25% RoE, the question is no longer “how high?” but “how was it achieved?”
The Formula in Practice — A Worked Indian Example
Imagine two hypothetical Indian small-caps, both reporting RoE of 25% in FY25:
Company A (the disciplined compounder):
- Net Profit Margin: 12.5%
- Asset Turnover: 1.6x
- Equity Multiplier: 1.25x
- Product: 12.5% × 1.6 × 1.25 = 25% RoE
Company B (the leveraged earner):
- Net Profit Margin: 5%
- Asset Turnover: 1.0x
- Equity Multiplier: 5.0x (heavy borrowings)
- Product: 5% × 1.0 × 5.0 = 25% RoE
The headline number is identical. The underlying reality could not be more different. Company A is generating its returns from genuine operational efficiency — fat margins and fast asset rotation — with almost no debt. Company B’s RoE is essentially borrowed: leverage is doing 80% of the work. In a downturn, Company A’s RoE compresses gracefully; Company B’s collapses as fixed interest payments crush thinner margins. This is precisely how India’s NBFC and infrastructure boom-bust cycles between 2018 (IL&FS) and 2024 unfolded — reasonable headline RoEs masking dangerous equity-multiplier addiction.
How to Compute DuPont From Any Indian Annual Report
You need three line items, all from the audited financial statements:
From the P&L: Net Profit (after tax, excluding exceptional items if you want a clean operating view) and Revenue from Operations.
From the Balance Sheet: Total Assets (the bottom line of the asset side) and Total Equity (Equity Share Capital + Other Equity, sometimes labelled “Total Shareholders’ Funds”).
Then:
- Net Profit Margin = Net Profit ÷ Revenue from Operations
- Asset Turnover = Revenue from Operations ÷ Average Total Assets (use the average of opening and closing balances to handle growth)
- Equity Multiplier = Average Total Assets ÷ Average Total Equity
Indian Ind AS-compliant balance sheets (mandatory under MCA notification for listed entities) make this trivially extractable from any annual report on the BSE or NSE filings page. There is no excuse for any retail investor to ever quote RoE without having decomposed it first.
Titan Biotech FY25: What the Numbers Reveal
Let’s apply the DuPont framework to Titan Biotech Limited (BSE: 524717) — a Bhiwadi-headquartered specialty biotechnology company manufacturing peptones, microbial culture media, collagen, and gelatin for pharma-biotech customers across 60+ countries. This is a pure educational illustration of what a high-quality DuPont structure looks like in an Indian small-cap; this is not a buy/sell recommendation on Titan Biotech or any other stock.
From Titan Biotech’s FY25 audited disclosures (Annual Report FY25, BSE filing reference 524717):
| FY25 Audited Marker | Reading |
|---|---|
| Total revenue FY25 | ~₹214 Cr (4-quarter sum: ₹46.5 Cr → ₹54 Cr → ₹56 Cr → ~₹58 Cr) |
| Total borrowings FY25 | ₹3 Cr (essentially debt-free) |
| Debt/Equity FY25 | < 0.05x |
| Equity Multiplier (estimated) | ~1.05x — almost a pure equity-financed asset base |
| Gross Block FY25 | ~₹57 Cr |
| CWIP FY25 | ~₹11 Cr (capex-in-progress for next leg of capacity) |
| EBITDA margin band FY25 | ~18–22% |
| Cash flow from operations / Operating profit (CFO/OP) | 103% (cash exceeds book profit — premium earnings-quality marker) |
| 10-year revenue CAGR | ~15% |
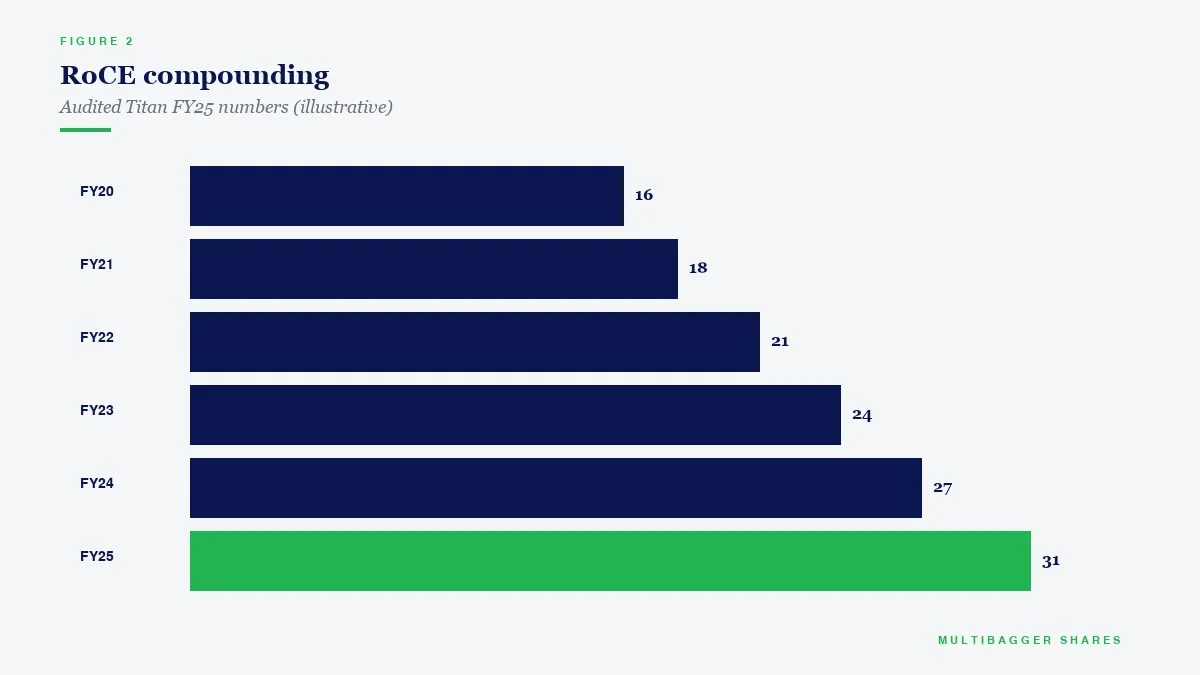
| 10-year PAT CAGR | ~29% (PAT compounding nearly 2x revenue rate signals operating leverage) |
| Director remuneration FY25 | ~₹4.56 Cr (conservative relative to PAT) |
| Board meetings FY25 | 14 (against SEBI’s 4-meeting minimum) |
| Exports % of FY25 revenue | ~34.5% across 60+ countries |
Now let’s read these numbers through the DuPont lens. The headline RoE of any company has to be decomposed into the three drivers we defined. For Titan Biotech, what jumps out is the structural quality of the decomposition rather than the absolute headline number:
Margin component (efficiency): An EBITDA band of 18–22% in a manufacturing business serving regulated pharma-biotech customers indicates pricing power earned through technical specification compliance and decades of customer qualification — Titan’s products go into culture media used in vaccine manufacturing, where the cost of switching suppliers is enormous because every alternate supplier has to be re-validated through a multi-month regulatory audit. That’s not a commodity margin; it’s a moat-protected margin. The 10-year PAT CAGR of approximately 29% — running nearly twice the revenue CAGR of about 15% — confirms that incremental sales are dropping disproportionately to the bottom line, the textbook signature of operating leverage on a fixed-cost manufacturing base.
Asset turnover (capital efficiency): A revenue of ~₹214 Cr against a gross block of ~₹57 Cr produces a fixed-asset turnover above 3.5x — meaning every ₹1 of plant generates ₹3.5+ of sales. For a regulated manufacturing setup that requires GMP-grade facilities, ISO certifications, and pharmaceutical-grade water systems, that is a genuinely lean capital footprint. The CWIP of ~₹11 Cr signals the company is currently extending its asset base for the next growth leg without disturbing current operations — which the cash-flow statement indicates is being financed entirely from internal accruals, not borrowings.
Equity multiplier (leverage): Total borrowings of ₹3 Cr against a healthy net worth means the equity multiplier sits at approximately 1.05x — for all practical purposes, this is a 100%-equity-funded balance sheet. None of Titan’s RoE is being manufactured by leverage. Whatever return shareholders earn comes purely from margins and turnover — the two components Warren Buffett, Charlie Munger, and Howard Marks all emphasise as the only sustainable sources of return.
The DuPont structural reading: Titan Biotech’s FY25 RoE is being driven by (a) protected manufacturing margins from regulated-customer pricing power, and (b) lean asset turnover from disciplined capital allocation — with leverage contributing essentially zero. That is the textbook profile of what disciplined small-cap fundamentals look like. Whether the stock is cheap, expensive, or correctly priced at any moment is a completely separate question — one this article deliberately does not answer.
How Retail Investors Should Use the DuPont Framework
The DuPont decomposition is most powerful when used in three specific ways:
1. Cross-company comparison within an industry. Take any two listed FMCG, two cement, two specialty chemical, or two biotechnology companies. Compute DuPont for both over five years. The company whose RoE is consistently driven by margin and turnover — with the equity multiplier flat near 1.0–1.5x — is structurally healthier than a peer where RoE is being inflated by a rising equity multiplier. This single test would have warned investors away from numerous Indian small-caps that imploded between FY18 and FY24 because their headline RoE looked respectable but was leverage-manufactured.
2. Time-series degradation detection. Compute DuPont for the same company across 5 to 10 years. If RoE is rising but margin and turnover are flat or falling — and the equity multiplier is climbing — it is a flashing red signal that growth is being bought, not earned. Conversely, if RoE rises while leverage is steady or falling, you are watching a real compounder at work.
3. Stress-test simulation. Ask yourself: if margin compressed by 200 basis points (a typical recession assumption) and turnover fell 10%, what would happen to RoE? For a low-leverage business, the impact is roughly proportional. For a high-leverage business with a 4x equity multiplier, RoE collapses far faster than the operating numbers, because fixed interest payments do not flex with revenue. This is exactly the dynamic that has destroyed Indian NBFC equity values in every credit cycle.
Common Traps and Misinterpretations
Trap 1: Treating RoE in isolation. A company can engineer high RoE temporarily through a buyback (which shrinks equity), through a write-down (which shrinks the equity base), or through a dividend payout funded by debt (the dreaded “leveraged recap” pattern occasionally seen in Indian holding companies). Always cross-check RoE against return on capital employed (RoCE) — if RoE is much higher than RoCE, leverage is doing the work; if they are close, real economics are.
Trap 2: Using a single year’s data. Tax holidays, exceptional gains, or one-time write-backs can inflate margin in any given year. Demand five years of consistent decomposition before making any inference about quality.
Trap 3: Ignoring sector context. Asset-heavy businesses like cement, steel, and infrastructure structurally have lower asset turnover than asset-light businesses like FMCG, software, or specialty chemicals. Comparing a cement company’s 0.6x asset turnover to an IT services 2.0x as if they were the same metric is a beginner’s error. Always compare like-to-like within sectors.
Trap 4: Confusing equity multiplier with debt-to-equity. The equity multiplier is total assets ÷ equity, which captures all liabilities — including non-interest-bearing trade payables and provisions. Debt-to-equity isolates only borrowings. Both matter; they answer different questions. The full DuPont uses the equity multiplier because it captures the entire leverage architecture.
Trap 5: Believing “high RoE = always good.” An RoE of 50% in a small business with no reinvestment opportunities is mathematically impressive but commercially limited — the company simply cannot deploy fresh capital at that rate. Always pair RoE with the incremental RoE on retained earnings; that is what determines compounding power, not the headline ratio.
Why the DuPont Framework Matters in Today’s Indian Market
India’s listed universe has expanded dramatically. SEBI’s regulatory perimeter now covers thousands of listed entities, including a long tail of small-caps and micro-caps where audit quality, disclosure granularity, and management ethics vary widely. The retail investor base has correspondingly exploded — NSE crossed 11 crore unique investors in 2025, up from roughly 3 crore in 2019 — and SEBI’s recent finfluencer regulations (which restrict unregistered persons from giving stock-specific recommendations) reflect the regulator’s awareness that millions of new entrants are being guided by social-media noise rather than statement reading.
In this environment, the DuPont identity is something better than an opinion: it is an algebraic check on reality. You cannot fake a margin × turnover × multiplier product. The arithmetic is unforgiving. Any time someone — a YouTuber, a Telegram operator, a brokerage research note — quotes a headline RoE without showing you the decomposition, you should mentally classify the source as unreliable until proven otherwise.
SEBI itself has, through multiple investor-education circulars, repeatedly emphasised the importance of reading audited annual reports rather than relying on tip-based investing. The DuPont framework is one of the most powerful, simplest, and least time-consuming applications of that principle. Twenty minutes per company per year is enough to compute it from the audited statements posted on the BSE/NSE filings page — a vanishingly small price for the ability to see through ratio illusions that destroy portfolios.
Putting It All Together
The DuPont decomposition is not a stock-picking formula. It does not tell you what to buy. It tells you what is true about the business behind the numbers. It separates real economics from accounting cosmetics. It reveals whether high RoE is a structural feature of a quality business or a temporary artefact of a leveraged balance sheet.
Two companies with identical RoE can have completely different DuPont profiles. The disciplined one tends to compound shareholder wealth through cycles. The leveraged one tends to deliver spectacular returns in good times and catastrophic losses when credit conditions tighten. The framework cannot predict which way any individual stock will move tomorrow — markets are dominated by short-term noise — but over five-, ten-, and fifteen-year horizons, the structural quality measured by DuPont is among the most reliable predictors of which businesses survive and which do not.
For every Indian retail investor sitting on a portfolio assembled from WhatsApp tips, Telegram screenshots, or “my CA uncle said so” reasoning, the single most productive afternoon you can spend this quarter is computing the DuPont decomposition for every holding in your portfolio across the last five years. The numbers will tell you, faster and more honestly than any newsletter, which of your stocks are real businesses and which are leverage-flavoured illusions.
Key Takeaways
- RoE without DuPont is a meaningless headline. Two companies with identical 25% RoE can be a fortress compounder and a leveraged time bomb — the difference shows up only in the three-factor decomposition of margin, turnover, and equity multiplier.
- The three drivers tell three different stories. Net profit margin reveals pricing power and operational efficiency; asset turnover reveals capital efficiency; equity multiplier reveals how much of the return is borrowed. A high-quality business earns its RoE primarily from the first two.
- Titan Biotech FY25 illustrates a structurally clean DuPont profile — total borrowings of ₹3 Cr (debt/equity below 0.05x) means the equity multiplier sits near 1.05x, so virtually 100% of the return is coming from margins and turnover, not leverage. This is the textbook signature of disciplined small-cap fundamentals — purely as an educational illustration, not a buy/sell call.
- Apply DuPont as a five-year time series, not a single-year snapshot. Time-series degradation in margin or rising leverage are the earliest warning signs of business deterioration, often visible 18–24 months before the stock price catches on.
SEBI Disclaimer
Disclaimer: This article is for educational and informational purposes only. It is not investment advice, and not a buy, sell, or hold recommendation on any stock mentioned, including Titan Biotech Limited. Equity markets carry risk; please do your own research or consult a qualified professional before making investment decisions.
