17 April 2026
(Friday)
The single most dangerous mistake in Indian value investing is valuing a company on a single year’s earnings. That year could be a cyclical peak. It could be a pandemic-era one-off. It could be the trough of a commodity downcycle. It could be inflated by a one-time land sale, a tax refund, or a write-back of provisions. If you build your valuation on top of that number, your entire margin of safety is an illusion — because the denominator is a lie.
This is why the best value investors in history — Warren Buffett, Bruce Greenwald, Howard Marks, Seth Klarman, Joel Greenblatt — do not value businesses on reported earnings. They value them on normalized earnings: the steady, through-the-cycle earning power of the business once the noise is stripped out.
Normalization is not optional. It is the single skill that separates an amateur retail investor from a professional analyst. And in a market like India, where small-cap and mid-cap companies routinely swing ±40% in reported profit from one year to the next thanks to raw-material cycles, forex, GST transitions, capex lumpiness, and one-time events, normalized earnings analysis is the only honest way to arrive at intrinsic value.
Today’s markets make this lesson especially urgent. As of the close on 17 April 2026, the BSE SENSEX stands at 78,493.54 (+504.86, +0.65%) and the NIFTY 50 at 24,353.55 (+156.80, +0.65%), with investors celebrating earnings beats and punishing earnings misses with extraordinary severity — often on the basis of a single reported quarter. Meanwhile, SEBI’s published study reminds us that 9 out of 10 individual traders in the F&O segment lose money, chasing short-term price moves driven by exactly the kind of earnings volatility this post teaches you to see through.
What Are Normalized Earnings?
Normalized earnings are what a business would have earned in a given period under mid-cycle, steady-state operating conditions — after adjusting for non-recurring items, cyclical extremes, accounting distortions, and capital-structure anomalies.
Put another way: normalized earnings answer the question, “If the next ten years were simply an average ten years for this business, what would the annual earnings look like?” That number — not the volatile reported number — is the correct input to any intrinsic value calculation, whether you are using DCF, earnings-power value, reverse DCF, or a simple earnings multiple.
Bruce Greenwald, at Columbia Business School, elevated this idea into a central pillar of modern value investing. His Earnings Power Value (EPV) framework begins with one step: normalize earnings. Every other step — cost of capital, reinvestment, growth assumptions — comes after. Skip normalization and the rest of the model is garbage in, garbage out.
The Five Categories of Adjustments You Must Make
1. Strip Out One-Time Items (Both Good and Bad)
The Indian reported income statement is riddled with items that have no bearing on future earning power. A sharp value investor strips them all out — the favourable ones and the unfavourable ones, so that intellectual honesty is preserved on both sides of the balance.
Common one-time items to remove: profit/loss on sale of land or fixed assets; insurance claim receipts; forex gains/losses on borrowings; reversal of provisions (impairment write-backs, tax write-backs); litigation settlements; restructuring costs; IPO-related advisory expenses; one-off government incentives; exceptional gains from subsidiary divestitures. In Indian reports these usually appear on the “Exceptional Items” line or deep in the notes — never trust the headline PAT figure until you have read the notes.
2. Adjust for Cyclical Positioning
This is the subtlest and most important adjustment. If the company operates in a cyclical industry — chemicals, metals, cement, sugar, paper, auto components, commercial real estate — you must ask: where in the cycle is this year’s reported number?
A specialty chemical company earning ₹100 crore in a euphoric 2022 (when China-plus-one was sending everyone’s order book to the moon) is not the same as the same company earning ₹100 crore in a depressed 2023 (when Chinese dumping collapsed margins). The honest normalized figure is a through-the-cycle average — typically the trailing seven- to ten-year average of operating margins applied to the most recent revenue base, adjusted for any permanent improvement in the business.
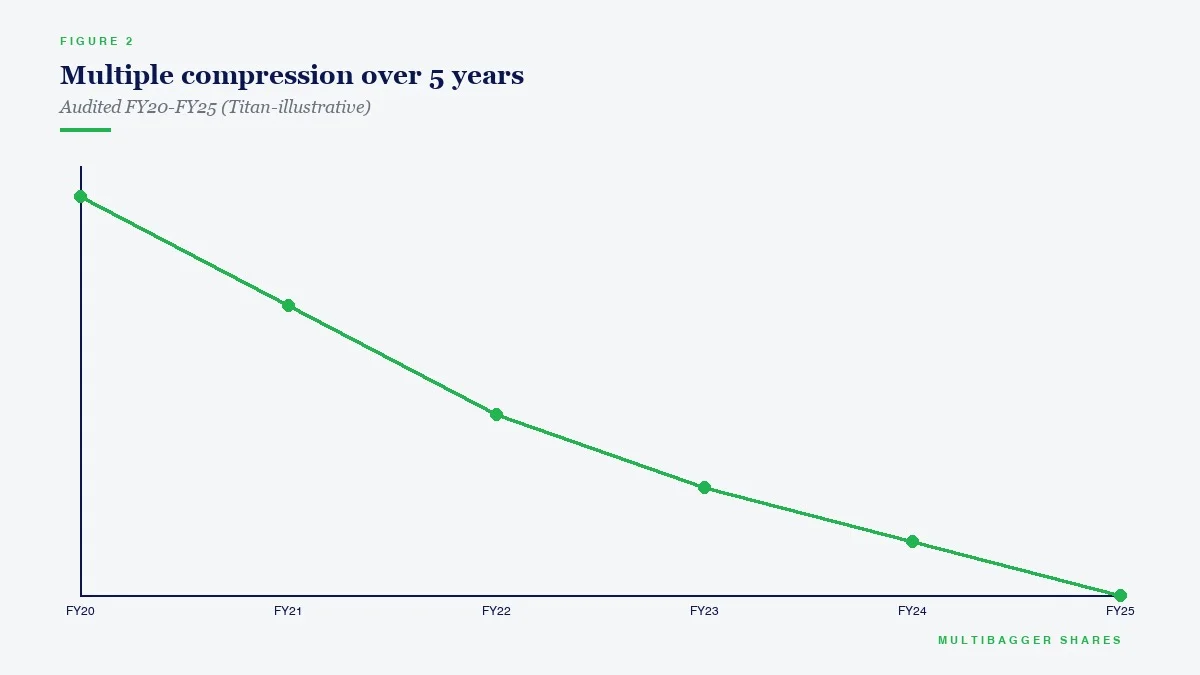
Contrast this with a company like Titan Biotech Ltd (BSE: 524717), which currently trades at ₹475 with a market cap of ~₹1,961 crore. Titan Biotech’s ten-year revenue CAGR of roughly 15% and its steady margin expansion from ~10% operating margin to 19% tell a very different story from a cyclical — these are not oscillations around a mean, they are a secular upward trajectory driven by product-mix improvement and operating leverage. When the cycle is replaced by a structural trend, normalization converges on the current run-rate rather than a historical average. That is one of the great compliments you can pay a business: “I cannot easily normalize it downward.”
3. Adjust for Capital Structure and Interest-Rate Anomalies
If a company has recently de-levered — paid off large debt — its reported PAT jumps not because the business is better, but because interest expense fell. Conversely, a newly indebted company will show depressed PAT even if operating performance improved. For a clean normalized view, analysts often compute normalized EBIT × (1 − steady-state tax rate), effectively stripping out leverage noise, and then re-introduce the current capital structure as a separate adjustment.
Similarly, unusually high or low cash balances earn unusually high or low other-income, distorting PAT. The fix: strip non-operating income (treasury income, dividend income from non-operating investments) out of the core number and value the surplus cash separately at face value.
4. Normalize the Tax Rate
Indian companies frequently report effective tax rates swinging between 15% and 35% year-to-year because of deferred-tax reversals, SEZ benefits expiring, MAT credit utilization, and litigation settlements with the income-tax department. For valuation purposes, apply the marginal statutory rate (25.17% under the new concessional regime for most Indian companies in 2026) to normalized pre-tax earnings. A company with a consistent 24–26% effective tax rate — such as Titan Biotech, which has run a remarkably steady ~25% effective tax rate over the past several years — already resembles a normalized tax profile and needs little adjustment. That consistency is itself a quality signal.
5. Normalize Depreciation to Replacement-Cost Capex
Reported depreciation is based on historical cost of assets. In a world of 5–6% rupee inflation on capital goods, the true economic depreciation — the amount the company must reinvest each year to simply maintain productive capacity — is typically 15–30% higher than book depreciation. This distortion is particularly severe for long-cycle, capex-heavy businesses: cement plants, paper mills, steel mills, pharma APIs, specialty chem. For a fair normalized earning, replace book depreciation with maintenance capex, which you can estimate as the trailing 5-year average of gross block additions less the portion attributable to capacity expansion.
A Simple, Three-Column Worksheet You Can Use Tonight
Open a spreadsheet. Create three columns: “Reported”, “Adjustments”, “Normalized”. List each line item of the income statement top to bottom. In the Adjustments column, apply the five categories above, one at a time, showing the rupee value of each fix and a one-line note explaining why. Total the Normalized column. Divide by the current share count. That is your Normalized EPS. That is the number to use in every valuation exercise going forward.
Do this for the trailing three years, not just the most recent year. A business whose Normalized EPS moves in a smooth upward line — small adjustments needed, minimal noise — is a quality business. A business where you are making enormous adjustments every year, where the adjustments themselves swing by multiples of reported EPS, is a business whose earning power you cannot confidently estimate. When in doubt, walk away. Uncertainty in the normalization is a direct signal to raise your required margin of safety — or not to invest at all.
Three Red Flags That Demand Aggressive Normalization
When you see any of these three patterns, the reported number is almost certainly misleading and demands serious adjustment work before you write a single valuation number:
Red Flag 1 — Operating margins wildly above industry median. If a company is reporting 25% OPM in an industry where the ten-year median is 12%, it is either a genuine quality outlier or it is enjoying a cyclical peak. Assume the latter until proven otherwise — the base rate of sustainable margin outperformance is low.
Red Flag 2 — “Other Income” > 20% of PBT. This almost always means one-time land sales, treasury gains, forex gains, or accounting write-backs are inflating reported profit. Strip them out. Value the core business separately. Value the cash separately.
Red Flag 3 — Reported EPS jumps > 40% year-on-year with no corresponding jump in revenue. That combination is mathematically impossible without either (a) extraordinary operating leverage, (b) one-time tax benefits, (c) interest expense falling sharply, or (d) accounting changes. In 90% of cases, it is category (b), (c), or (d) — and the earnings will revert.
What Normalized Earnings Cannot Fix
Normalization is powerful, but it is not omnipotent. It cannot rescue a business whose competitive advantage is eroding. It cannot fix a corporate governance problem. It cannot compensate for a promoter who pledges shares. It cannot substitute for understanding the industry structure. It gives you a cleaner number — it does not give you a better business.
This is where qualitative layers — promoter track record, audit quality, disclosure transparency, product moat, end-market demand durability — become essential companions to normalization. Again, a business like Titan Biotech Ltd illustrates the ideal: promoters holding 55.87% and steadily increasing their stake, zero pledging, fourteen-year unbroken dividend history, ROCE of 16.9%, ROE of 15.0%, book value of ₹40.3 per share compounding consistently over time — these qualitative characteristics are what give you confidence that the normalized earnings, once computed, will actually be realized in future years rather than proving to be a quantitative illusion.
The Practical Takeaway for Every Indian Value Investor
Stop looking at the headline PAT on screener.in. Stop building DCFs on trailing-twelve-month EPS. Stop congratulating a stock for a 50% earnings jump until you have asked — and answered — the question: how much of this is the business and how much of this is noise?
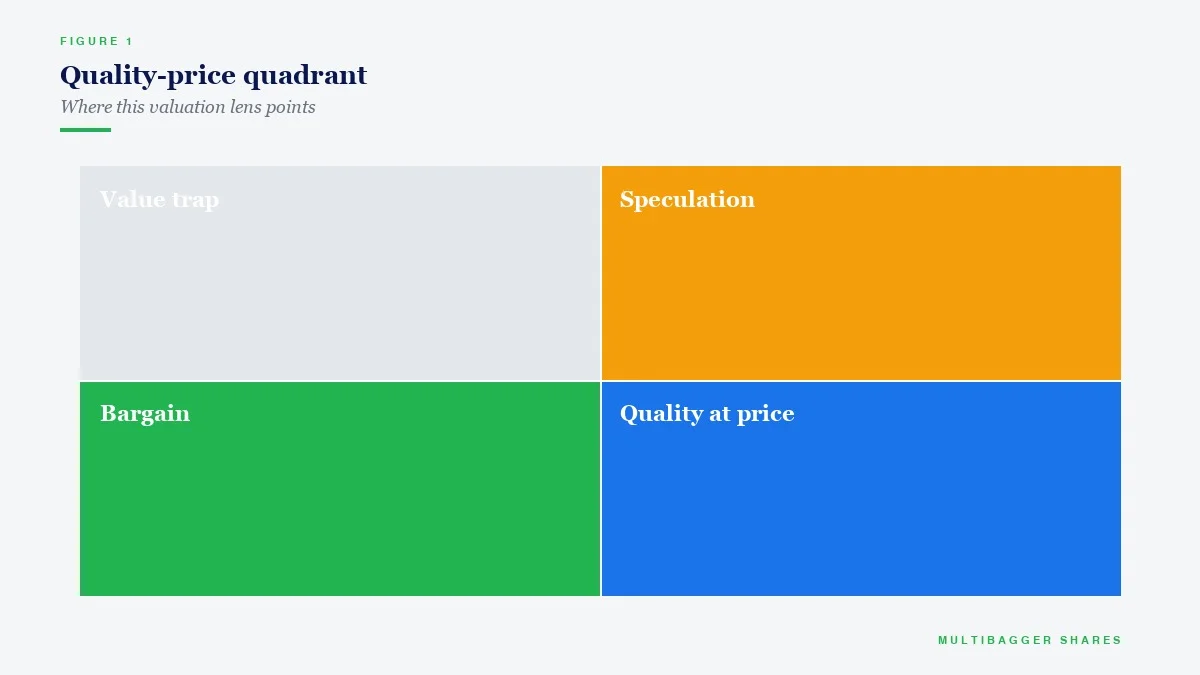
Normalized earnings is not academic jargon. It is the difference between buying a business at 15× true earning power (a bargain) and paying 15× a cyclical peak (a trap disguised as a bargain). In a market where the SENSEX is within touching distance of its all-time highs and every new IPO tries to price itself on the best possible trailing year, this discipline is what protects you. It is not glamorous. It is not quick. It will never give you a fifteen-minute thesis. But over two decades, it is the single largest determinant of whether you compound at 12% or at 18% — and for retail investors in India, that compounding difference is the difference between a comfortable retirement and generational wealth.
Do the worksheet. Do it tonight. Do it before you buy anything on Monday.
📢 Join Our Telegram Channel
Get daily value investing lessons, stock analysis & Titan Biotech updates — delivered straight to your phone!
✈️ Join @longtermequityy on Telegram
🔔 Free • No spam • Value investing insights daily
Disclaimer: This article is for educational and informational purposes only. It is not investment advice, and not a buy, sell, or hold recommendation on any stock mentioned, including Titan Biotech Limited. Equity markets carry risk; please do your own research or consult a qualified professional before making investment decisions.
