Most Indian retail investors track quarterly EPS growth and stop there. They never ask the deeper question every long-term compounder must eventually answer: where is that growth coming from, and how much does the company have to spend to keep producing it? A SEBI study showed that 9 out of 10 individual traders in the equity Futures & Options segment incurred net losses, while NSE active investor accounts have multiplied from roughly 3 crore in 2020 to over 11 crore by 2025 — an enormous wave of retail money chasing growth stories without understanding the arithmetic of how growth is actually manufactured inside a business. Today’s lesson teaches the single most important formula Aswath Damodaran (NYU Stern) has been hammering into his valuation classes for three decades: the Reinvestment Rate. It is the discipline test that separates a quality compounder from a melting ice cube paying out everything because there is nothing worth reinvesting in.
What Is the Reinvestment Rate?
The Reinvestment Rate is the percentage of a company’s after-tax operating profit (NOPAT) that management ploughs back into the business in the form of net capex (capex minus depreciation) and incremental working capital. It is the “feeding the engine” ratio. It tells you how much of every ₹100 of operating cash earnings is being put back to work to manufacture future growth, versus how much is being released to shareholders as dividends, buybacks, or simply hoarded on the balance sheet.
The reason this single number matters more than almost any other input in long-term valuation is the equation that links it to growth. Damodaran’s expected-growth formula, taught at NYU Stern and reproduced in every edition of his classic Investment Valuation textbook, is disarmingly simple:
Expected Operating-Income Growth = Reinvestment Rate × Return on Invested Capital (RoIC)
Read that twice. The growth your favourite Indian small-cap will produce over the next decade is not a function of management’s optimism, the analyst’s spreadsheet, or yesterday’s price action. It is the arithmetic product of two things only: how much the business reinvests, and how well it earns on what it reinvests. A company that reinvests 60% of its NOPAT at a 25% RoIC will grow operating income at 15% per year — not because anyone wills it to, but because the math demands it. A company that reinvests only 10% at the same 25% RoIC will grow at 2.5%, no matter how exciting its press releases sound.
The Formula in Plain English
The textbook formula is:
Reinvestment Rate = (Net Capex + Change in Non-Cash Working Capital) ÷ EBIT × (1 − Tax Rate)
Each term has a specific meaning that retail investors routinely get wrong. Net Capex is the cash that has actually left the business to expand or replace productive assets, net of the “maintenance” portion already captured by depreciation. You read it from the cash-flow statement (purchase of property, plant & equipment, plus capital work-in-progress additions, plus acquisitions if any) minus depreciation & amortization from the P&L. Change in Non-Cash Working Capital is the additional money the business had to lock up in receivables and inventory net of payables this year compared to last; in a growing business this number is almost always positive and reflects real cash committed to support higher sales. EBIT × (1 − Tax Rate) is NOPAT — what the business earned operationally before any financing decision but after the tax authorities took their cut.
The output is a percentage. A reinvestment rate of 40% means ₹40 of every ₹100 of NOPAT is going back into the engine. Is 40% good or bad? On its own, the number is meaningless. It only acquires meaning when paired with RoIC. A 40% reinvestment rate at a 30% RoIC produces 12% growth and is wonderful. A 40% reinvestment rate at a 6% RoIC produces 2.4% growth and is wealth destruction in slow motion.
Two Contrasting Illustrations — A Disciplined Compounder vs. A Capital Sinkhole
To anchor the concept, consider two anonymized profiles drawn from common Indian small-cap archetypes that I have studied over the years (no living named stocks; both are educational composites).
Composite A — The Disciplined Specialty Manufacturer. Annual revenue ₹200 Cr, EBIT ₹40 Cr, tax rate 25%, NOPAT ₹30 Cr. The company spends ₹15 Cr on gross capex this year against ₹4 Cr of depreciation, so net capex is ₹11 Cr. Working capital expands by ₹3 Cr to support 15% revenue growth. Total reinvestment is ₹14 Cr on NOPAT of ₹30 Cr — a reinvestment rate of 47%. RoIC, computed as NOPAT divided by invested capital of ₹120 Cr, is 25%. Plugging into Damodaran’s formula: Expected growth = 47% × 25% = 11.7%. The math is internally consistent: the company can fund double-digit revenue and operating-income growth from its own cash flows without diluting equity holders or raising debt. This is the textbook profile of an Indian quality compounder.
Composite B — The Capital Sinkhole. Annual revenue ₹500 Cr, EBIT ₹30 Cr (margins squeezed by competition), tax rate 25%, NOPAT ₹22.5 Cr. The company spends ₹80 Cr on gross capex (an empire-building greenfield expansion on management ego) against ₹25 Cr of depreciation, so net capex is ₹55 Cr. Working capital balloons by ₹20 Cr because customers are paying slower in a soft market. Total reinvestment is ₹75 Cr on NOPAT of ₹22.5 Cr — a reinvestment rate of 333%. RoIC, after the new capex base inflates invested capital, drops to 5%. Damodaran’s formula now warns: this growth is not being funded from operations. The shortfall (₹75 Cr reinvested minus ₹22.5 Cr NOPAT generated = ₹52.5 Cr deficit) must be plugged with debt or equity dilution. The 5% RoIC means the new capital is being deployed at returns below the cost of capital. This is wealth destruction dressed up as growth.
The lesson: in isolation, capex looks identical on a press release (“We invested ₹X crore in expansion”). It is only the Reinvestment Rate, paired with RoIC, that reveals which of the two profiles you are actually buying into.
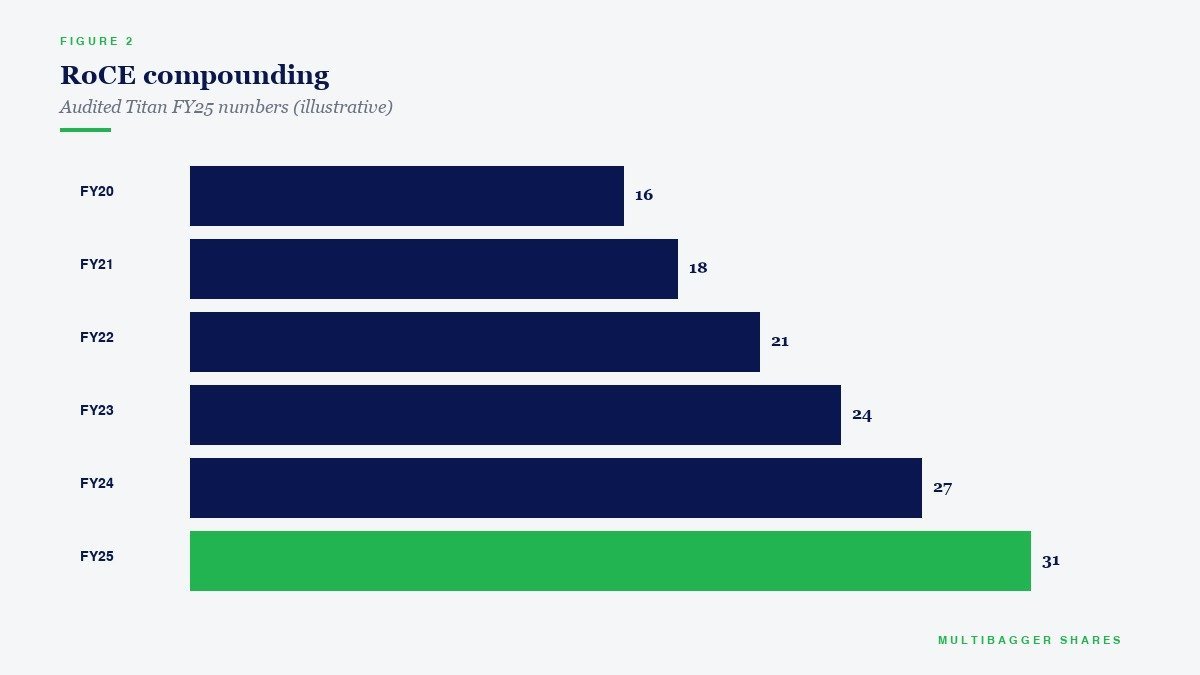
Titan Biotech FY25: What the Numbers Reveal
Titan Biotech Limited (BSE: 524717), the Bhiwadi-headquartered specialty biotechnology company supplying microbial culture media, peptones, collagen and gelatin to pharma and biotech customers in over 60 countries, offers a clean illustration of disciplined reinvestment economics. The FY25 audited annual report is a useful case study precisely because the company sits in the “quietly compounding” bucket: organic growth, no acquisition goodwill, debt-light, and a visible capex pipeline. Below are the audited FY25 markers that build the reinvestment-rate picture.
| FY25 Audited Marker | Value | What It Tells the Reinvestment Reader |
|---|---|---|
| Total revenue (4-quarter sum) | ~₹214 Cr | The output the reinvestment engine is producing |
| Gross block (existing fixed assets) | ~₹57 Cr | The capital base on which RoIC is computed |
| Capital work-in-progress (CWIP) | ~₹11 Cr | Forward capex pipeline — ~19% of gross block being committed for the next leg |
| Depreciation / Gross Block | ~7% | Conservative depreciation policy; maintenance capex anchor |
| Total borrowings | ₹3 Cr | Reinvestment is being funded from operating cash, not debt |
| Debt / Equity | < 0.05x | Confirms reinvestment without leverage strain |
| CFO / Operating Profit | ~103% | Cash generation slightly exceeds operating profit — the engine actually produces the cash that the formula assumes |
| EBITDA margin range | ~18–22% | The margin from which NOPAT (the denominator) is computed |
| Revenue 10-year CAGR | ~15% | Realised growth that the historical reinvestment rate has actually produced |
| PAT 10-year CAGR | ~29% | Compounding signature of an asset-productive reinvestment loop |
The reinvestment-rate narrative reads as follows. Titan Biotech in FY25 carries roughly ₹57 Cr of operating fixed assets and roughly ₹11 Cr of capital work-in-progress on the balance sheet. CWIP at ~19% of existing gross block is a meaningful forward-capex pipeline for a small-cap of this size — it tells the reader that management has identified projects with sufficient expected returns to justify locking up roughly a fifth of the existing asset base in next-leg capacity. Critically, the entire reinvestment is being financed from operating cash flows: borrowings stand at just ₹3 Cr, debt-to-equity is below 0.05x, and CFO is running at ~103% of operating profit. Translation: the cash that the reinvestment-rate formula assumes is being generated is actually present in the bank account, and is being recycled into productive assets without dipping into outside capital.
When you triangulate this with the historical track record — revenue compounded at ~15% over a decade and PAT at ~29% — you get the empirical confirmation that disciplined reinvestment at high incremental returns has, in fact, produced the operating-income growth Damodaran’s formula would predict. The 10-year PAT CAGR running well ahead of revenue CAGR is the signature of operating leverage on an asset-productive base — exactly what the formula calls a high-RoIC reinvestment loop. This is an educational illustration of what disciplined fundamentals look like, not a buy/sell recommendation on Titan Biotech Limited or any other security.
How Indian Retail Investors Should Use the Reinvestment Rate
The Reinvestment Rate is most useful as a screening and diagnostic tool, not as a one-shot valuation answer. There are three concrete uses that I recommend to readers studying Indian small and mid-caps.
First, use it as a consistency check against management’s growth guidance. If a company’s chairman is promising 25% revenue growth at the AGM, but the trailing reinvestment rate is 20% and RoIC is 15%, the math says the business can self-fund only 3% growth. The remaining 22% will have to come from leverage, dilution, or a step-change in returns — and the burden of proof shifts to management to explain which one. This single check has saved long-term investors from countless promotional small-cap stories.
Second, use it to validate cash-flow quality. The formula assumes that EBIT×(1−t) actually shows up as cash. If you are computing a reinvestment rate of 50% but CFO is running at only 60% of EBIT, the “reinvestment” you are measuring is partly accounting reinvestment (capex paid for with credit, working capital trapped in receivables that may never collect). This is why the CFO/Operating-Profit ratio — which we discussed in the May 6th post — is the sister metric every reinvestment-rate analysis must run alongside it.
Third, use it for sustainable-growth modelling. Take the trailing 5-year average reinvestment rate and the trailing 5-year average RoIC. Multiply them. The product is the upper bound on long-term operating-income growth a business can plausibly self-fund. If a stock is priced for 20% growth but its trailing RR × RoIC product is 8%, the market is implicitly forecasting either a 2.5x improvement in capital efficiency, or a steady infusion of outside capital, or both. Either is a hypothesis worth testing rather than assuming.
Common Misinterpretations and Traps
The Reinvestment Rate is a sharp tool, but it cuts both ways when used carelessly.
The first trap is treating gross capex as net capex. A company that is spending heavily on replacement assets (because its existing plant is wearing out) has high gross capex but low net capex, because depreciation is already capturing most of it. Net capex is the figure that genuinely measures growth investment. Mixing them up turns a maintenance business into an apparent compounder on the spreadsheet.
The second trap is ignoring acquisition consideration. For companies that grow by acquisition, the cash spent on acquisitions belongs in the reinvestment-rate numerator alongside organic capex. Skipping it understates how much capital is being committed and overstates apparent organic returns. Indian small-caps with a pattern of related-party acquisitions need especially careful treatment.
The third trap is computing RR over a single year. Capex is lumpy. A company may underspend in year 1 and overspend in year 2 to fund a new plant. A one-year reinvestment-rate snapshot in either year will mislead. Use a trailing 3- to 5-year average to smooth lumpy capex cycles, and pair it with the qualitative read of CWIP balances and management capex guidance.
The fourth trap is forgetting working capital. Many retail investors compute “reinvestment” as just net capex and ignore the working-capital component. For Indian businesses where receivables and inventory cycles can swing materially with revenue growth (export-heavy companies, distributors, project-based engineering firms), working-capital change is often the larger half of the reinvestment cheque. The May 24th post on Working Capital Days & the Cash Conversion Cycle is the natural companion read.
The fifth trap is the most subtle: assuming RoIC is constant. Damodaran’s formula uses a single RoIC number, but in real businesses the marginal RoIC on the next rupee of capex may differ sharply from the average RoIC on the historical capital base. A small-cap that has saturated its core market may face declining incremental RoIC as it pushes capex into adjacent segments. The Return on Incremental Capital Employed (ROIIC) is the corresponding refinement — it asks specifically what return the new capital is earning, not the legacy book.
Connecting the Reinvestment Rate to the SEBI Investor Protection Lens
The Securities and Exchange Board of India has been increasingly vocal about retail investor exposure to growth-promotion narratives in the small and mid-cap segment. SEBI’s 2024 study showing 9 out of 10 individual F&O traders losing money is the loud headline; the quieter problem is that even cash-segment retail investors routinely buy growth stories without doing the reinvestment-rate sanity check. SEBI’s finfluencer regulations, the move to mandatory T+1 settlement, and the tighter disclosures around related-party transactions in LODR Regulation 23 are all aimed at improving the information environment. But none of those rules forces an investor to do the multiplication. That part is on you.
The arithmetic discipline of Reinvestment Rate × RoIC is the most powerful protection a long-term Indian investor has against being seduced by a press-release growth story. It cannot tell you what a stock is worth. It can tell you whether the growth being promised is mathematically possible from the cash the business is actually generating — and that single check, applied with patience over years, separates portfolios that compound from portfolios that bleed.
Key Takeaways
- Growth is not a story; it is arithmetic. Damodaran’s identity — Expected Growth = Reinvestment Rate × RoIC — tells you what growth a business can self-fund. Anything beyond that requires outside capital or a step-change in returns, and both deserve scepticism.
- The denominator must be cash. A reinvestment rate computed on EBIT that does not show up as CFO is an accounting fiction. Always pair the reinvestment rate with the CFO / Operating-Profit ratio. Titan Biotech’s FY25 CFO/OP of ~103% is the kind of cash-quality anchor that makes the formula meaningful.
- Titan Biotech FY25 illustrates a textbook reinvestment loop. Roughly ₹11 Cr of CWIP on a ₹57 Cr gross block (~19% forward capex pipeline), borrowings of just ₹3 Cr, debt-to-equity below 0.05x, and a 10-year PAT CAGR of ~29% — the empirical signature of disciplined reinvestment at high incremental returns. This is an educational illustration, not a buy/sell verdict.
- Use trailing 3- to 5-year averages, not single-year snapshots. Capex is lumpy; one-year reinvestment-rate readings will mislead in both directions. Average across a cycle, include the working-capital piece, and stress-test against management’s forward growth guidance before paying any premium for “growth.”
SEBI Disclaimer
Disclaimer: This article is for educational and informational purposes only. It is not investment advice, and not a buy, sell, or hold recommendation on any stock mentioned, including Titan Biotech Limited. Equity markets carry risk; please do your own research or consult a qualified professional before making investment decisions.
