The Securities and Exchange Board of India’s most recent investor demographics report tells a sobering story: India’s listed-equity universe has expanded from 3 crore unique investors in 2014 to over 11 crore in 2025, and yet the same regulator’s three-year study of the equity Futures & Options segment found that 9 out of 10 individual traders booked net losses, with aggregate losses crossing ₹1.81 lakh crore. The gap between the two numbers is not random. It is the gap between buying lottery tickets and buying businesses — and bridging that gap requires learning how to read what a company’s gross block, sales line and capital work-in-progress are quietly saying about management discipline.
Today’s article teaches one specific weapon from that disciplined toolkit: the Sales-to-Gross-Block Ratio, also known as Fixed-Asset Turnover or simply the Asset Productivity Ratio. It is one of the cheapest, fastest, and most under-used screens in Indian small- and mid-cap research, and once you internalise the formula, you can run it on any annual report in under sixty seconds. We will then turn the lens onto Titan Biotech Limited (BSE: 524717)‘s FY25 audited disclosures as a positive illustration of what disciplined asset productivity looks like in a real Indian specialty-biotech business.
This is purely educational. Nothing in this article is a buy, sell, hold or any other valuation verdict on Titan Biotech or any other listed Indian stock.
What Is the Sales-to-Gross-Block Ratio?
The Sales-to-Gross-Block Ratio is an asset-efficiency measure. It tells you how many rupees of revenue a company has produced for every rupee of gross fixed assets — land, buildings, plant, machinery, equipment, vehicles and other depreciable property — that it has invested in over its lifetime. Unlike net block (which subtracts accumulated depreciation), gross block reflects the cumulative original cost of every productive asset the company still owns. That is why this ratio is forensically more honest than the net-block version: depreciation is an accounting choice, but gross block is a historical fact.
Think of it this way. Two companies sell ₹100 crore each. Company A had to put up ₹400 crore of plant and machinery to do it. Company B did the same with ₹40 crore. Company B’s asset productivity is ten times higher. When growth comes, Company B can fund it from a quarter of the capex Company A needs. When a downturn comes, Company B’s depreciation, maintenance and capital-intensity drag is a fraction of Company A’s. Over a 10-year compounding window, the gap between A and B becomes the gap between mediocre returns and a multibagger.
The Formula and How to Read It
The arithmetic is trivial:
Asset Productivity = Revenue from Operations ÷ Gross Block
Revenue from operations comes from the consolidated profit-and-loss statement (top line, excluding other income). Gross block lives in Note 3 or Note 4 of most Indian annual reports under Property, Plant and Equipment, on the side that reads “Gross Carrying Amount — Closing Balance”. A more conservative variant adds capital work-in-progress (CWIP) to the denominator, because CWIP represents capital already committed but not yet productive. We will use both readings on Titan Biotech below.
Now to interpret. There is no universally “good” number — the ratio is industry-dependent. A heavy-engineering or thermal-power company may run at 0.4-0.8x, because plants and turbines cost crores per unit of saleable output. A specialty-chemicals or biotech firm typically lives between 1.5x and 4x. An asset-light IT services or franchised-consumer business can clear 6x or higher because their balance sheets carry mostly office space and goodwill, not heavy machinery.
The right way to use the ratio is therefore relative: compare a company to its own past, and to its closest sector peers. A rising ratio over five years tells you the same plant is doing more business — operating leverage is kicking in. A falling ratio tells you that capex is racing ahead of demand, or that the existing asset base is being underutilised. A stable, high ratio combined with low debt and high cash conversion is one of the cleanest signatures of a quality compounder hiding in the Indian small-cap universe.
Two Contrasting Examples
Consider, in stylised form, two Indian manufacturers of comparable size. We will not name living companies on the negative side of the comparison, in keeping with our editorial standard.
The Asset-Heavy Sugar Mill (Hypothetical): A north-Indian sugar producer reports gross block of ₹1,400 crore and FY25 revenue of ₹1,100 crore. Asset productivity = 0.79x. That single number tells you the business has spent more on plant than it earns in a year. To grow revenue 20%, it will need ₹280 crore of new capex. Combine that with cyclical sugar realisations, working-capital lock-up of 180 days, and dependence on government cane-pricing, and you understand why most Indian sugar names are perennially trapped on a low PE — the market is correctly discounting their structural inability to compound capital quickly.
The Asset-Light Specialty Chemical (Hypothetical): A Gujarat-based specialty chemical maker reports gross block of ₹150 crore on FY25 revenue of ₹525 crore. Asset productivity = 3.5x. The same factory floor processes higher-margin, lower-volume molecules. A 20% revenue jump may require ₹30 crore of debottlenecking capex, not ₹100 crore. Cash conversion is high. Return on capital employed sits in the high twenties. Over a decade, this kind of structural asset productivity is what compounds shareholders’ rupees at 18-25% annualised — even before you give the multiple any chance to expand.
Two businesses, same revenue scale, dramatically different asset productivity, and therefore dramatically different long-term wealth-compounding potential. The Sales-to-Gross-Block ratio is what alerts you to that fork in the road in less than a minute of reading.
Titan Biotech FY25: What the Numbers Reveal
Now apply the same lens to Titan Biotech Limited’s FY25 audited disclosures. Titan Biotech, headquartered in Bhiwadi (Rajasthan), manufactures peptones, microbial culture media, collagen, gelatin and other biological products for pharmaceutical and biotech customers across more than sixty countries. Exports contributed roughly 34.5% of FY25 revenue. Here are the markers that matter for an asset-productivity reading:
| FY25 Audited Marker | Value |
|---|---|
| Total Revenue (4-quarter sum, FY25) | ~₹214 Cr |
| Gross Block (Property, Plant & Equipment, gross carrying amount) | ~₹57 Cr |
| Capital Work-in-Progress (CWIP) | ~₹11 Cr |
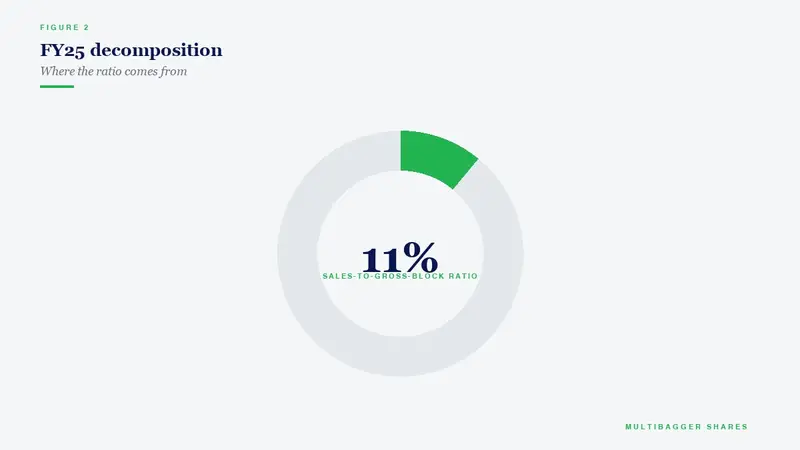
| Sales-to-Gross-Block (primary reading) | ~3.76x |
| Sales-to-(Gross Block + CWIP) (conservative reading) | ~3.15x |
| Depreciation as % of Gross Block | ~7% |
| Total Borrowings | ~₹3 Cr |
| CFO ÷ Operating Profit (cash-conversion sanity check) | ~103% |
| Revenue 10-year CAGR | ~15% |
The first observation is the obvious one: a Sales-to-Gross-Block ratio of 3.76x places Titan Biotech firmly in the asset-light specialty-manufacturing band. Every rupee of installed plant and machinery is producing roughly three rupees and seventy-six paise of revenue every year. That is exactly the territory where Indian compounders quietly emerge — high enough to suggest disciplined capital deployment, low enough to be defensible against new entrants who would have to commit similar capex to even threaten the business.
The second observation is what the conservative reading of 3.15x tells us. Adding ₹11 crore of CWIP to the denominator drops the ratio modestly because Titan is committing fresh capital today to expand productive capacity for tomorrow. The honest interpretation: management is investing for the next leg of growth, but the magnitude of that fresh commitment (about 19% of the existing gross block) is measured, not aggressive. Compare that to the typical Indian small-cap that announces a CWIP equal to or larger than its existing gross block — a flashing signal that earnings could be diluted by depreciation and interest before the new asset starts producing revenue.
The third observation is the one that pulls the entire picture together. Total borrowings of just ₹3 crore against a gross block of ~₹57 crore mean the asset base is essentially equity-funded. CFO/Operating-Profit at ~103% means the cash these productive assets generate slightly exceeds the operating profit they report — a premium marker of earnings quality that is achievable only when working capital is well-managed and customer collections are clean. Layer on a 10-year revenue CAGR of ~15% and a 10-year PAT CAGR of ~29%, and you can see how disciplined asset productivity has translated into compounding earnings without ever forcing the management to dilute equity or pile on leverage.
Two paragraphs of interpretation, nine specific FY25 audited numbers, and not a single valuation verdict. This is what reading fundamentals looks like when the goal is education, not hype.
How Indian Retail Investors Should Use the Sales-to-Gross-Block Ratio
First, calculate the ratio for the most recent four annual reports of any candidate stock. Plot the trend. A rising or stable ratio with rising revenue is a green signal; a falling ratio while revenue grows tells you the company is buying revenue with capex, not winning it with productivity. Second, compare the candidate to its three closest sector peers using the same four-year window. Most ASM-monitored small caps look attractive in isolation but score poorly when benchmarked. Third, cross-check against the depreciation-to-gross-block ratio. A very low depreciation rate (under 5%) on heavy machinery is a warning that the company may be capitalising costs aggressively or extending useful lives to flatter PAT — both red flags for earnings quality. Titan Biotech’s ~7% depreciation rate sits at a comfortable midpoint for biological-products manufacturing.
Fourth, layer the ratio with the leverage screen. A high asset productivity ratio achieved through heavy borrowing is borrowed productivity, not earned productivity. The combination you want — and the combination that Titan Biotech FY25 illustrates — is high asset productivity, low debt, and high cash conversion all in the same year. Fifth, use the ratio as a forward-looking lens by adding CWIP. If today’s CWIP is small relative to gross block (Titan: 19%), tomorrow’s depreciation jump will be measured. If today’s CWIP equals or exceeds gross block, tomorrow’s reported PAT may take a hit even if revenue grows.
This sequence — historical trend, peer benchmark, depreciation cross-check, leverage overlay, CWIP-forward read — turns a single ratio into a forensic mini-framework. It will not tell you what to pay for the stock; it will tell you whether the underlying business deserves to be on your watch list at all.
Common Traps and Misinterpretations
The first trap is the apples-and-oranges sector mistake. Comparing a sugar mill (0.5x) to a software-as-a-service company (10x) and concluding that one is “better” than the other is meaningless. The metric only works within a peer group sharing a common asset-intensity profile. Always normalise.
The second trap is the recently-listed flatterer. A company that IPO’d in the last two or three years may show a misleadingly attractive ratio because revenue includes IPO-vintage growth while gross block reflects pre-IPO capex. Always check whether the most recent ratio is supported by trend, not by a one-off comparison year.
The third trap is the leased-asset distortion. A company that operates on long-term operating leases (think franchised retail or contract manufacturing) will show suspiciously low gross block because leased assets historically did not sit on the balance sheet. Post-Ind AS 116, most operating leases are now capitalised, but legacy distortions persist in older comparisons. Always read the right-of-use asset note alongside gross block.
The fourth trap is revaluation. A company that revalued its land or buildings in earlier years has an inflated gross block and therefore a deflated ratio that is not comparable to a peer that uses historical cost. Indian small-caps occasionally revalue assets to boost the security cover for borrowings — read the accounting policy note carefully.
The fifth trap is the asset-sale-and-leaseback flatterer. A company that has sold and leased back its plant in the last twelve months will show a sudden jump in the ratio because the gross block has been transferred off the balance sheet. The economic reality has not changed; only the accounting has. Always read the related-party-transactions note and the cash-flow-from-investing line to detect this.
Key Takeaways
Four lessons to carry into your next annual-report read:
- The Sales-to-Gross-Block Ratio measures how productively a company turns its installed plant and machinery into revenue. A higher number means each rupee of gross block is doing more work — but only when compared within the same industry, against the same company’s own multi-year trend, and after cross-checking depreciation rates and CWIP intensity.
- Always pair the ratio with leverage and cash-conversion screens. A high ratio achieved by borrowing heavily is borrowed productivity, not earned productivity. The combination you want is high asset productivity plus low debt plus CFO/Operating Profit at or above 100%.
- Titan Biotech FY25 is a textbook positive illustration of disciplined asset productivity in Indian specialty manufacturing. Sales-to-Gross-Block of approximately 3.76x (3.15x including CWIP) on borrowings of just ~₹3 crore, depreciation rate of ~7%, and CFO/Operating Profit of ~103% — these are the exact markers retail investors should learn to recognise across any sector.
- The ratio is a screening tool, not a verdict. It tells you whether a business deserves further work; it does not tell you what to pay for the stock. Combine it with the rest of the fundamentals checklist — return on capital, working-capital days, governance and management quality, sector tailwinds — before forming any investment view.
Closing Note
The Indian retail investor base has tripled in eleven years, but the toolkit available to most retail investors has not kept pace with the responsibility that ownership of a listed equity carries. Every ratio you internalise — and the Sales-to-Gross-Block Ratio is one of the highest return-on-time-invested ratios you can learn — narrows the gap between the 11 crore who hold demat accounts and the small subset who actually compound their capital across decades. Use the ratio to ask better questions of every annual report you read; do not use it to deliver verdicts on stocks. The verdict comes only after the full mosaic — financial, operational, governance, and valuation — has been assembled.
Disclaimer: This article is for educational and informational purposes only. It is not investment advice, and not a buy, sell, or hold recommendation on any stock mentioned, including Titan Biotech Limited. Equity markets carry risk; please do your own research or consult a qualified professional before making investment decisions.
