The number of registered investors on the National Stock Exchange has crossed eleven crore in 2026, up from roughly three crore in 2020 — a 3.7x expansion in a single market cycle. Yet a 2024 SEBI study found that nine out of ten individual traders in equity Futures & Options lost money, with aggregate net losses crossing ₹1.81 lakh crore over a three-year window. A separate set of investor-protection notices from SEBI has repeatedly flagged the same root cause: retail investors evaluate businesses through price charts, tip-driven narratives, and quarterly EPS surprises rather than through the slow, audited fundamentals that actually compound wealth over a decade.
One of the quietest, most under-appreciated of those fundamental markers is Export Revenue Mix — the percentage of a company’s total turnover that comes from customers outside its home country. For a small-cap Indian manufacturer, the export ratio is far more than a trade-data curiosity. It is a forensic quality marker that simultaneously tests three of the deepest risks every retail investor must evaluate: customer concentration, currency exposure, and product competitiveness against global benchmarks. A company that consistently sells 30–50% of its output to international buyers across many geographies has, by definition, passed quality, regulatory and pricing tests that a purely domestic-focused peer never has to face.
This article walks through the Export Revenue Mix metric in plain English, shows you how to read it from an Indian annual report, illustrates the discipline-versus-red-flag spectrum with two contrasting examples, and uses Titan Biotech Limited (BSE: 524717) FY25 audited disclosures as a positive teaching illustration of what disciplined geographic diversification looks like in practice. This is not a buy/sell recommendation on Titan Biotech or any other named stock. It is an educational illustration of disciplined fundamentals.
What Is Export Revenue Mix?
Export Revenue Mix is simply the share of a company’s total revenue from operations that is earned by selling goods or services to customers located outside India. In Indian annual reports it is disclosed under several conventions:
Under Ind AS 108 — Operating Segments, listed companies must disclose revenues from external customers attributed to (a) the entity’s country of domicile and (b) all foreign countries in total, with separate disclosure for any individual foreign country whose revenue is material. Many companies go further and break out export sales by major geography or by product category. The figure is also visible inside the Notes to Accounts on Revenue Recognition, the Schedule of Foreign Exchange Earnings & Outgo mandated by the Companies Act, and inside the management’s MD&A narrative.
In its most commonly used form, the metric is computed as:
Export Revenue Mix (%) = (Revenue from foreign customers) ÷ (Total Revenue from Operations) × 100
The numerator is the total of all sales invoiced to non-Indian buyers, irrespective of whether the goods physically moved from an Indian factory or from an overseas warehouse. The denominator is total revenue from operations — that is, sales of products and services net of trade discounts, but before adding non-operating items like interest income, dividend income, or one-off gains. This consistency between numerator and denominator is critical: comparing “export sales” to “total revenue including other income” inflates the ratio and is one of the most common amateur mistakes in retail screening tools.
How To Read the Number — Discipline Versus Red Flag
There is no single “correct” export ratio. A pure software product company servicing American hyperscalers will run at 95%+ exports and that is normal; a regional cement producer will sit near 0% and that too is normal. The signal is not the absolute level — it is the combination of three interpretive lenses you apply to the level you observe.
Lens 1 — Customer Concentration Embedded Inside the Export Number. A 40% export ratio that comes from a single Fortune-500 buyer is fundamentally riskier than a 40% export ratio spread across forty mid-sized buyers in twenty countries. Always read the export disclosure alongside the “revenue from major customers” note inside Ind AS 108. If the top customer accounts for more than 10% of revenue, segment standards require disclosure of that fact. A diffuse export book is a moat; a concentrated one is a single-point-of-failure dressed up as diversification.
Lens 2 — Currency Mix and Natural Hedge. Indian exporters typically invoice in US dollars, euros, or pounds, while their cost base is largely in rupees. A rising export share generally improves operating leverage on a depreciating rupee and compresses it on an appreciating rupee. The disciplined exporter discloses its forex hedging policy clearly — usually a layered hedge book covering 30–60% of the next six months of receivables — and discusses unhedged exposure in the management discussion. The red-flag exporter buries its forex sensitivity behind a single line that simply says “the company periodically hedges foreign-currency exposure”.
Lens 3 — Pricing Power Against Global Benchmarks. Sustained export competitiveness is, in itself, evidence of pricing power. International pharma, chemical, and biotech buyers run formal vendor-qualification processes, audit supplier facilities, and benchmark every quote against three or four global alternatives. If a small-cap Indian manufacturer keeps winning that business year after year, it has implicitly cleared a quality, regulatory, and cost test that no domestic-only competitor has had to clear. The corollary: a sudden surge in export sales without a corresponding capex programme or new approvals is suspicious — it is often “deemed exports” routed through related parties for the purpose of revenue recognition.
Two Contrasting Examples — Disciplined vs Red Flag
The Disciplined Example — A Generic Specialty Chemicals Exporter. Consider a hypothetical Indian specialty-chemicals company with FY25 revenue of ₹400 Cr, of which ₹160 Cr (40%) is exports. The annual report breaks the export book into Europe (~15%), North America (~10%), Latin America (~7%) and South-East Asia (~8%), with the largest single customer accounting for 6% of revenue. The forex schedule shows ~50% of forward export receivables hedged through one-month and three-month forwards. The MD&A explains a three-year journey from US-FDA inspection to EUGMP approval to two new Japanese customer qualifications. This is what disciplined geographic diversification looks like — granular disclosure, customer diffusion, currency awareness, and a paper trail of regulatory effort.
The Red-Flag Example — A Hypothetical Mid-Cap That Cratered. Now consider a hypothetical mid-cap that reported export sales of ₹120 Cr on total revenue of ₹300 Cr (40%) — the same headline ratio as the disciplined example. But on closer reading, ₹95 Cr of those exports went to a single related-party trading subsidiary in a tax-friendly jurisdiction. The forex schedule disclosed gross export earnings but no hedging policy. There were no manufacturing-facility approvals from any major regulator. Two years later, the receivables from the foreign subsidiary were impaired, the auditor qualified the financials, and the company eventually went under restructuring. The same headline number — 40% exports — was a moat in the first case and a wealth-destroyer in the second. Read the granularity, not the percentage.
Titan Biotech FY25: What the Numbers Reveal
Now apply the three-lens framework to Titan Biotech Limited (BSE: 524717), the Bhiwadi-based specialty biotechnology manufacturer that produces microbial culture media, peptones, collagen, gelatin, and related fermentation inputs for global pharma and biotech customers. The FY25 audited disclosures give us a clean dataset to work with:
| Titan Biotech FY25 Audited Marker | Reading |
|---|---|
| Total Revenue (FY25, four-quarter sum) | ~₹214 Cr |
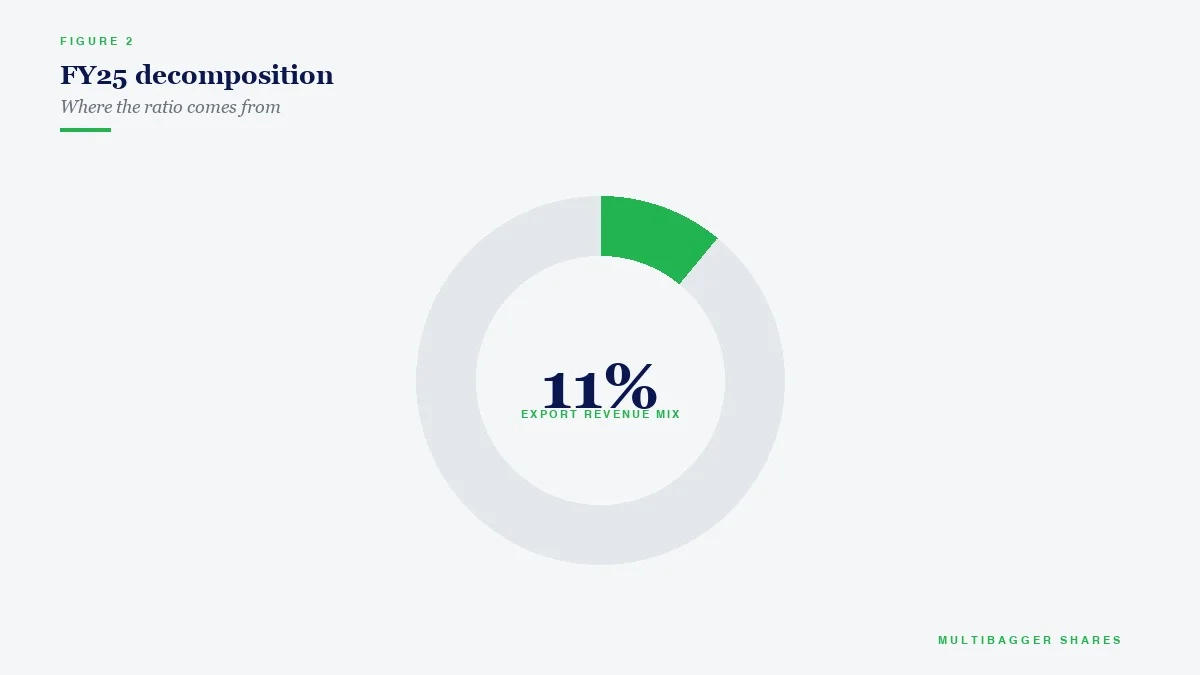
| Export share of FY25 revenue | ~34.5% |
| Implied FY25 export turnover | ~₹74 Cr |
| Geographic spread of customers | 60+ countries |
| FY25 Quarterly revenue arc (QoQ) | ₹46.5 Cr → ₹54 Cr → ₹56 Cr → ~₹58 Cr |
| FY25 CFO / Operating Profit | ~103% (cash-backed earnings) |
| FY25 Total Borrowings | ~₹3 Cr (essentially debt-free) |
| FY25 Contingent Liabilities | ~₹7.78 Cr (low) |
| FY25 Gross Block / CWIP | ~₹57 Cr / ~₹11 Cr |
Apply Lens 1 — Customer Concentration. A 34.5% export share dispersed across 60+ countries is structurally diffuse. Even in the optimistic case where the top three foreign markets contribute 50% of export revenue between them, the implied top-customer concentration sits well below the 10% Ind AS 108 disclosure threshold for Titan Biotech. For a small-cap with a ~₹214 Cr top line, the absence of a single dominant export customer is exactly the kind of structural diversification that protects a long-term shareholder from quarterly demand shocks in any one geography.
Apply Lens 2 — Currency Mix and Natural Hedge. Titan’s input cost base — fermentation feedstocks, utilities, manpower, and depreciation on its ~₹57 Cr Indian gross block — is overwhelmingly rupee-denominated. The export receivables, by contrast, are largely USD- and EUR-denominated. This creates a natural rupee-depreciation tailwind on roughly a third of revenue, partially offset by the cost of imported feedstocks. The conservative balance-sheet posture (~₹3 Cr borrowings, < 0.05x debt-to-equity, ~₹7.78 Cr contingent liabilities) means there is no foreign-currency debt servicing obligation that could turn the FX exposure into a leveraged loss. In other words, FX moves through Titan’s P&L but cannot ambush its solvency.
Apply Lens 3 — Pricing Power Against Global Benchmarks. Selling fermentation inputs and biotech raw materials into 60+ countries is, by itself, third-party validation. Pharma-grade microbial culture media, peptones, and collagen go through formal vendor-qualification, sterility, and endotoxin specifications before any global biotech buyer signs a recurring purchase order. The fact that Titan Biotech has reached 60+ country reach with a sub-₹250-Cr revenue base — while simultaneously generating ~103% FY25 CFO/Operating Profit and a ~15% revenue / ~29% PAT 10-year CAGR — tells you the export book is not “deemed export” round-tripping; it is genuine global commercial traction. The CWIP of ~₹11 Cr against a ~₹57 Cr gross block additionally signals that management is reinvesting to expand capacity for further export-led growth.
This is an educational illustration of disciplined fundamentals. It is not a buy/sell recommendation on Titan Biotech or any other listed stock.
How Indian Retail Investors Should Use the Export Revenue Mix Metric
For an investor working through the Indian small-cap and mid-cap universe, Export Revenue Mix should be used as a first-pass screen and a quality-of-business sanity check, not as a standalone decision rule. A practical workflow:
Step 1 — Pull the number from the segment note. Open the latest annual report, search for “geographical information” or “revenue by geography”, and read the rupee figure for “outside India” alongside total revenue from operations. Calculate the ratio yourself rather than trusting third-party screener apps, which often inadvertently mix up “foreign exchange earnings” (a Companies Act schedule) with “revenue from foreign customers” (the Ind AS 108 segment number). The two are usually similar but not identical, and the segment number is the cleaner one for fundamental analysis.
Step 2 — Read the granularity. Does the company break the export number down by region, country, or major customer? Granular disclosure correlates with disciplined management; opaque disclosure correlates with risk. If the entire export disclosure is a single line, downgrade your conviction.
Step 3 — Cross-check against the forex schedule. The “Foreign Exchange Earnings & Outgo” schedule under the Companies Act gives you actual realised FX inflow. If declared exports in the segment note materially exceed FX inflow over a multi-year window, ask why — the gap may reflect pure rupee-denominated invoicing to overseas SEZs, or it may reflect collection delays that warrant deeper scrutiny.
Step 4 — Pair the number with the customer-concentration disclosure. Ind AS 108 requires disclosure of any single external customer contributing more than 10% of revenue. Read that note. A 35% export ratio with a 25% single-customer dependency is a fundamentally different risk than a 35% export ratio diffused across 60 countries.
Step 5 — Track the trend. Look at the export ratio over five and ten years. Steady-state 25–40% with rising granularity is excellent. Sudden spikes — say from 5% to 30% in a single year without a corresponding capex programme, regulatory approval, or customer-acquisition disclosure — should trigger forensic suspicion.
Common Traps and Misinterpretations
Trap 1 — Treating exports as automatically high-margin. Many retail investors assume that exports always carry higher margins than domestic sales because of currency arbitrage. In reality, exports often carry lower gross margins because of competitive global benchmarking, but they pay back through volume, customer stickiness, and the regulatory moat earned along the way. Always read the segment-margin disclosure where available, and never assume export = premium margin.
Trap 2 — Ignoring the working-capital impact of export receivables. International receivables typically run 60–120 day collection cycles versus 30–60 days domestically. A rising export ratio without a corresponding rise in working-capital deployment is suspicious; a rising export ratio with a proportional rise in receivables and a stable cash conversion cycle is normal. Read the Cash Flow Statement’s working-capital change line in tandem with the export disclosure.
Trap 3 — Confusing “deemed exports” with real exports. Indian SEZ legislation classifies sales to certain domestic SEZ units as “deemed exports”. These are domestic transactions for forex-collection purposes but appear under different accounting buckets. A company whose “export revenue” is heavily skewed toward deemed exports is not enjoying a global moat — it is enjoying a tax structure. Always read the auditor’s note on the composition of export revenue.
Trap 4 — Overweighting the SEBI F&O headline narrative. The SEBI study showing 9 out of 10 individual F&O traders losing money has — rightly — entered the public consciousness. But many retail investors then over-rotate into “any small-cap exporter must be quality” as a heuristic. Do not. The quality test is in the granularity of disclosure, the customer diffusion, the regulatory paper trail, and the cash-flow conversion — not in the export percentage alone.
Trap 5 — Letting the rupee narrative dominate fundamental analysis. A weakening rupee improves exporter P&Ls in the short run, but currency cycles reverse. A great exporter is one whose underlying business economics — gross margins, customer retention, capacity utilisation — work even at an unfavourable currency. The disciplined investor reads exports as a structural moat, not as a leveraged FX bet.
The Indian Context — Why This Matters in 2026
India’s listed-equity universe has expanded from roughly 5,000 active scrips in 2015 to over 7,000 today, and the share of revenue earned by Indian companies from foreign customers has been rising every decade. The MSCI India universe today derives an average of around 18% of revenue from outside India. The mid-cap and small-cap segments — where retail investors hunt for multibaggers — exhibit a much wider distribution: a small fraction of small-caps run at 50%+ export ratios with 30+ country reach, while the majority hover near 0–10%. The disciplined value investor uses this distribution as a screen.
SEBI’s ongoing tightening of finfluencer regulations — the 2024 amendments to the Investment Adviser Regulations and parallel rules for advisory professionals — has explicitly emphasised the difference between “telling investors what to buy” and “teaching investors how to evaluate”. This article belongs squarely in the second category. The Export Revenue Mix metric is not a buy signal; it is a quality-of-business question that every retail investor should be capable of asking and answering before deploying capital into any small-cap manufacturer.
For Titan Biotech, the FY25 audited dataset shows what disciplined geographic diversification looks like in practice: a ~34.5% export share across 60+ countries, supported by a ~₹3 Cr borrowing book, ~₹7.78 Cr contingent-liability tail, ~103% CFO/Operating-Profit conversion, and a 14-board-meeting, independent-chair governance posture. None of those numbers individually constitutes a buy thesis. Together, they constitute an educational illustration of the kind of fundamental discipline that long-term Indian value investors should be trained to recognise.
Key Takeaways
- Export Revenue Mix is a structural quality marker, not a percentage to maximise. A 35% export ratio with diffuse customers, layered hedging, and regulatory paper trail is fundamentally stronger than a 60% export ratio concentrated in one related-party buyer. Read the granularity, not the headline number.
- Apply three lenses every time: customer concentration inside the export book (Ind AS 108 customer disclosure), currency mix and natural-hedge posture (forex schedule and hedging policy), and pricing power against global benchmarks (regulatory approvals and customer-qualification trail). All three must align for the export ratio to count as a moat.
- Titan Biotech FY25’s ~34.5% export share dispersed across 60+ countries — paired with ~₹3 Cr borrowings, ~₹7.78 Cr contingent liabilities, ~103% CFO/Operating Profit conversion, and a ~₹57 Cr gross block / ~₹11 Cr CWIP capex pipeline — is an educational illustration of what disciplined geographic diversification looks like in an Indian small-cap context. This is not a buy/sell recommendation.
- The retail investor’s job is not to chase the highest export ratio; it is to combine the export disclosure with customer concentration, working-capital trend, forex hedging, and regulatory disclosure. When all four point in the same direction, the export number becomes a forensic moat marker. When they diverge, it is a red flag dressed in a moat’s clothing.
SEBI Disclaimer
Disclaimer: This article is for educational and informational purposes only. It is not investment advice, and not a buy, sell, or hold recommendation on any stock mentioned, including Titan Biotech Limited. Equity markets carry risk; please do your own research or consult a qualified professional before making investment decisions.
