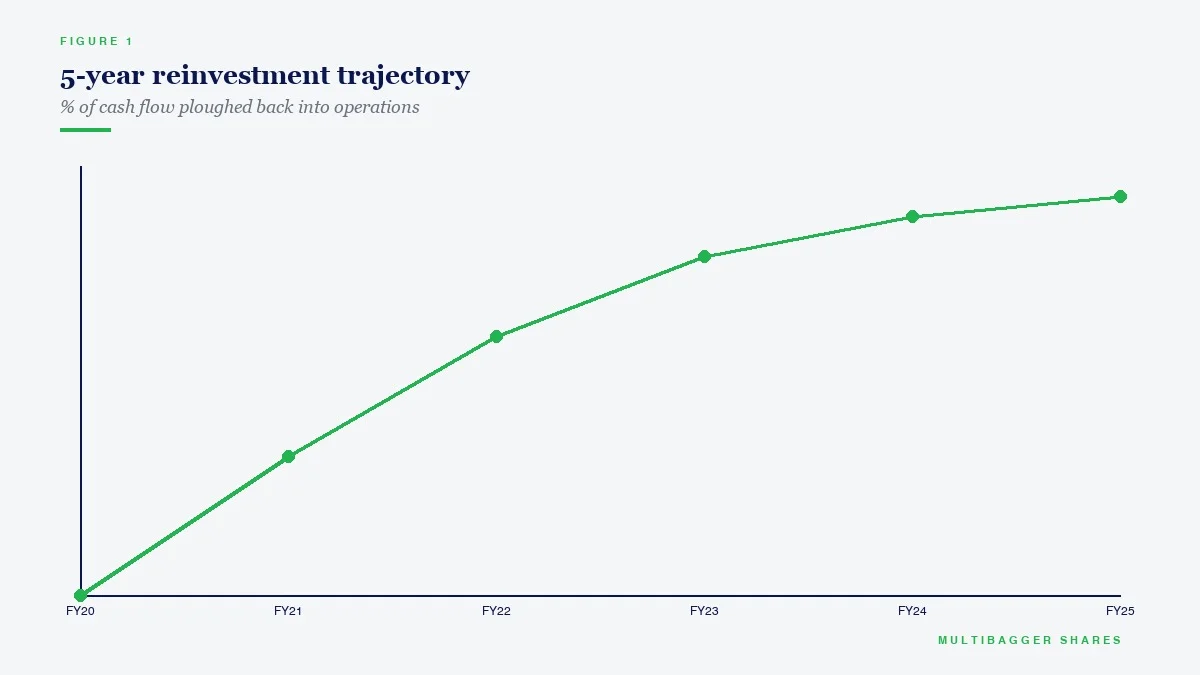
Every Indian investor has heard Warren Buffett’s famous line that “the most important number in financial statements is the one we never see.” That number is reinvestment. Specifically: how much capital a business is putting back into the ground each year, relative to how much it is wearing out. The ratio that captures this in 60 seconds is the Capex-to-Depreciation Ratio — and once you start using it, you will never again confuse a genuine compounding machine with a quietly harvesting business in slow decline.
The numbers from SEBI’s 2024 study on individual traders are now familiar to every serious investor — 9 out of 10 individual traders in the equity Futures & Options segment incurred net losses, and aggregate F&O losses for individuals crossed roughly ₹1.8 lakh crore in a single year. Meanwhile, NSE registered investor accounts have surged from around 3 crore in 2019 to more than 11 crore by 2024. New investors arriving every day need filters that work, not opinions that sound clever. Capex-to-Depreciation is one of the simplest filters that consistently does work — and disciplined Indian small-cap manufacturers like Titan Biotech Limited (BSE: 524717), with FY25 audited capital-work-in-progress (CWIP) of ~₹11 Cr sitting on a gross block of ~₹57 Cr and depreciation running at only ~7% of gross block, illustrate exactly what disciplined reinvestment looks like on the ground in India.
This article is purely educational. It is not a buy/sell recommendation on Titan Biotech or any other stock. The objective is to teach you the ratio, the formulas, the traps, and how to use it as part of a long-term value-investing framework that actually compounds capital.
What Is the Capex-to-Depreciation Ratio?
Plainly stated, the Capex-to-Depreciation Ratio measures how aggressively a business is investing in its productive base relative to how fast that productive base is wearing out. In any given year, depreciation is a non-cash accounting estimate of the consumption of fixed assets — buildings, plant, machinery, equipment, vehicles. Capital expenditure (capex) is real cash going out the door, into new gross block or capital-work-in-progress (CWIP).
If a company spends exactly the same amount on new fixed assets as it depreciates each year, the ratio is 1.0x — the asset base is being maintained but not expanded. Below 1.0x sustained over many years, the company is in harvest mode: it is allowing the asset base to shrink, harvesting cash, and at some point either pays it out, buys back stock, or the business model is genuinely shrinking. Above 1.0x, the business is actually growing its productive footprint — and the gap between capex and depreciation is, in effect, growth capex.
This single ratio is the cleanest decoder of Warren Buffett’s 1986 Berkshire shareholder letter where he introduced “owner earnings” — defined as reported earnings plus depreciation/amortisation, minus required maintenance capex. The whole framework collapses to the recognition that depreciation is an accounting proxy for maintenance capex, and the gap between actual capex and depreciation is therefore growth capex. A business growing its productive base ought to be reinvesting; a business with no incremental opportunities ought to be returning cash. The ratio tells you, instantly, which one you are looking at.
The Formula and How to Read It
The basic formula is straightforward:
Capex-to-Depreciation Ratio = Capital Expenditure (current year) ÷ Depreciation & Amortisation (current year)
For a more robust read in cyclical Indian businesses, smooth both numerator and denominator over a 3- to 5-year window — single-year capex can be lumpy because plants are commissioned in chunks. Capex itself is most accurately read straight from the cash-flow statement under “purchase of property, plant and equipment” (often plus additions to CWIP). Some practitioners prefer the balance-sheet method: change in gross block + change in CWIP + depreciation = capex. Both approaches converge over 3 years. Depreciation is reported on the face of the P&L and again in the fixed-assets schedule.
How to read the resulting number:
Below 0.5x for many years: active liquidation. The business is not even maintaining the asset base. Either the industry is dying, or capital is being deliberately starved. Sometimes legitimate (e.g., a tobacco-style cash cow returning capital), but always a red flag in growth-oriented sectors.
0.5x–1.0x: maintenance-only mode. Depending on the industry, this can be a healthy “harvester” if the company is buying back shares aggressively or paying out heavy dividends. In commodity manufacturing, a sustained reading below 1.0x usually means slow share-loss to better-invested competitors.
Roughly 1.0x: steady-state. The asset base is being replaced as it wears out — neither growth nor decline.
1.5x–3.0x: the sweet spot for a compounding manufacturer. The business is reinvesting roughly 50–200% above maintenance, building visibly observable growth capex. CWIP on the balance sheet should be visibly populated, and revenues 2–3 years out should reflect the new capacity.
Above 5x: aggressive expansion — verify carefully. High readings can mean a multi-year megaproject, a bona-fide step-change opportunity, or, in the wrong hands, empire-building, related-party leakage, or capital being burned. The higher the ratio, the more important it is to inspect where the money is going (segment notes, related-party schedules, contractor concentration).
Two Contrasting Examples
Example 1 — Disciplined Indian Compounder (generic): consider a profitable specialty-chemicals manufacturer that historically ran at gross block ₹100 Cr, depreciation ₹8 Cr, and annual capex ₹16 Cr. Capex-to-Depreciation = 2.0x. CWIP on the balance sheet sits at ₹15–20 Cr — a clear signal that capacity is being added. Three years later, gross block has grown to ₹160 Cr, revenue has risen ~70%, and PAT has compounded faster because operating leverage has kicked in. The 2.0x ratio held steady; depreciation rose alongside the bigger asset base; capex stayed disciplined. This is the textbook profile of a value-creating Indian manufacturer.
Example 2 — Historical Red-Flag Pattern: India’s small-cap graveyard is full of companies that ran capex-to-depreciation at 4x–8x for several years, with CWIP ballooning, while reported revenue from new capacity stayed conspicuously absent. In hindsight, segment notes revealed inflated supplier billings, related-party leakage in EPC contracts, and CWIP that never actually translated into commissioned plants generating sales. The classic forensic markers were: capex consistently 4x–8x depreciation, no corresponding revenue lift after 3–4 years, related-party transactions disproportionately concentrated in the construction/contracting line, and statutory auditor changes mid-project. None of these by themselves prove anything, but the cluster — with capex-to-depreciation as the entry-point alarm — has flagged most of the worst Indian small-cap accidents of the past two decades. The lesson is not that high reinvestment is bad; it is that high reinvestment without a matching long-term revenue trajectory is a red flag.
Titan Biotech FY25: What the Numbers Reveal
Titan Biotech Limited (BSE: 524717) is a Bhiwadi-based specialty biotechnology manufacturer of microbial culture media, peptones, collagen and gelatin, exporting to more than 60 countries. The FY25 audited financials provide a near-textbook illustration of disciplined reinvestment in an Indian small-cap manufacturer.
| FY25 Audited Marker | Value | Capex-Discipline Reading |
|---|---|---|
| Gross block (FY25) | ~₹57 Cr | Tangible productive base supporting ~₹214 Cr revenue — high asset turnover |
| Capital-Work-in-Progress (CWIP) FY25 | ~₹11 Cr | ~19% of gross block sitting in CWIP — visibly populated growth capex pipeline |
| Depreciation/Gross Block FY25 | ~7% | Implied annual depreciation ~₹4 Cr; conservative useful-life assumptions consistent across years |
| Total revenue FY25 (4-quarter sum) | ~₹214 Cr | Revenue is ~3.7x gross block — capital-light operating model |
| Total borrowings FY25 | ~₹3 Cr | Reinvestment funded internally, not by leveraging the balance sheet |
| CFO / Operating Profit FY25 | ~103% | Cash generation slightly exceeds operating profit — premium earnings-quality marker that fully funds the capex programme |
| Revenue 10-year CAGR | ~15% | Past reinvestment translated into durable top-line compounding |
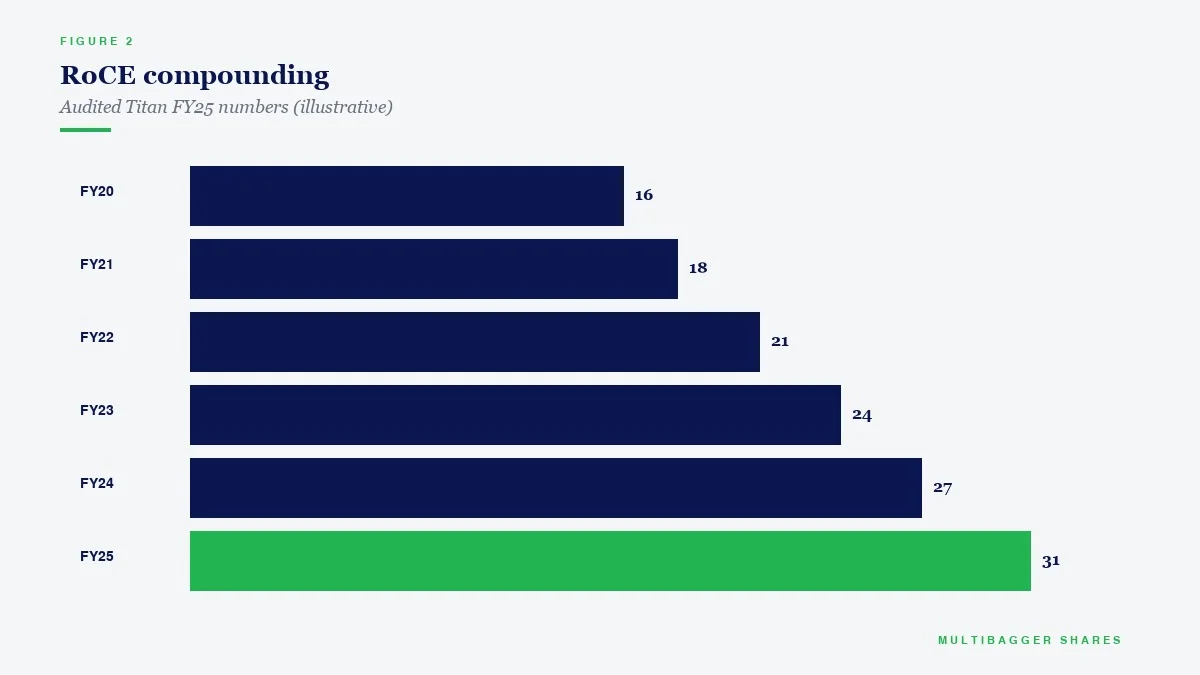
| PAT 10-year CAGR | ~29% | Operating leverage on each capex cycle — the test that “growth capex” actually generated incremental returns |
| Total exports / Revenue | ~34.5% | Capacity additions monetised across 60+ country export base — low customer concentration |
Interpretation: Putting the FY25 figures together, the Capex-to-Depreciation profile of Titan Biotech tells a coherent story. With implied annual depreciation around ₹4 Cr and ~₹11 Cr of capital-work-in-progress already on the balance sheet — i.e., capex being committed substantially in excess of annual depreciation — the company is unambiguously investing above maintenance. Crucially, it is doing so without leverage (total borrowings of just ~₹3 Cr) and with cash generation (CFO/Operating Profit of ~103%) that fully funds the programme. The 10-year revenue CAGR of ~15% and PAT CAGR of ~29% are the rear-view evidence that previous capex cycles actually translated into incremental earnings, not just empty asset additions.
The numbers thus pass the three tests every Indian value investor should apply when analysing reinvestment discipline. First, is reinvestment happening above maintenance? Yes — the CWIP-to-gross-block ratio of ~19% indicates capex meaningfully above the ~7% annual depreciation rate. Second, is the reinvestment internally funded, or debt-financed? Internally — borrowings remain near zero at ~₹3 Cr, and CFO/Operating Profit of ~103% covers capex with surplus. Third, has prior reinvestment compounded into earnings? Decisively yes — 29% PAT CAGR over 10 years is a stronger compounding rate than nearly any large-cap and demonstrates that historical capex cycles earned incremental return on capital, not destroyed it. None of this is a valuation verdict. It is simply what disciplined reinvestment, illustrated with FY25 audited numbers, looks like in an Indian small-cap manufacturer.
How Retail Investors Should Use the Capex-to-Depreciation Ratio
The ratio is most useful as a quick filter at the top of your funnel. If you are screening Indian small-caps from the BSE/NSE universe, a 30-second pull of capex (cash-flow statement) divided by depreciation (P&L) over the most recent 3 years quickly partitions the universe into harvesters, steady-states, and aggressive reinvestors. Combine that with the qualitative question — “Is the industry growing?” — and you get a powerful first-pass filter.
For positions you actually own or are studying deeply, run the ratio every quarter alongside CWIP, gross block growth, and revenue growth. The combination tells you whether the capex programme is being executed on time. If CWIP keeps building but gross block is not being commissioned, the project is delayed — sometimes for legitimate reasons, sometimes for forensic ones. Pair the ratio with the SEBI-mandated related-party-transactions schedule. If the bulk of capex is flowing to related parties, the ratio is signalling something very different from disciplined reinvestment.
Use the ratio in dialogue with management. Annual report Q&A, AGM questions, and concall transcripts are the right venues to ask: “Capex was X times depreciation in FY25 — what is the expected revenue contribution from this capex 24 months out, and on what timeline will commissioning happen?” Quality managements answer this with specifics. Vague managements deflect. The ratio gives you the question; the answer gives you the assessment.
Finally, put the ratio in dialogue with returns on incremental capital. A 3x reading is meaningless if incremental return on capital employed is 5%. A 2x reading is golden if incremental return on capital employed is 25%. The point is reinvestment at adequate returns. Capex-to-Depreciation is the entry filter; incremental RoIC (covered separately) is the verdict.
Common Traps and Misinterpretations
Trap 1 — Mistaking high capex for value-creation. Spending money is easy. Earning a return on it is the test. Always pair Capex-to-Depreciation with multi-year revenue and PAT growth, not just single-year capex.
Trap 2 — Ignoring cyclicality. Cement, steel, sugar, and many capital goods companies run capex-to-depreciation at 4x–6x at the start of a cycle and 0.3x–0.5x at the bottom. Smooth over 5 years, and read the cycle. Single-year readings mislead.
Trap 3 — Confusing capex with M&A. Strategic acquisitions are not the same as organic capex. Many cash-flow statements lump them together under “investing activities.” Read the line items carefully, and treat acquisition spend separately.
Trap 4 — Mixing intangible-heavy and asset-heavy businesses. Software, IT services, and asset-light consumer brands have very low capex needs by design. A 1.0x reading there does not mean stagnation — it means the model is rightly capital-light. The ratio is most useful within sectors, not across.
Trap 5 — Forgetting that depreciation policy itself is a management choice. Companies on conservative useful-life policies will show higher depreciation and a lower Capex-to-Depreciation ratio mechanically. Always read the depreciation note in the fixed-assets schedule. The Indian Companies Act 2013 schedule II provides indicative useful lives — a company depreciating significantly faster than schedule II is conservative; significantly slower is aggressive.
Trap 6 — CWIP that never commissions. A CWIP balance that grows year after year without movement into gross block is one of the strongest forensic signals available. The Beneish M-score, Piotroski F-score, and Altman Z-score will not catch this; only direct inspection of the CWIP schedule will.
Trap 7 — Capex without a clear customer pipeline. Capex done in a vacuum, without a contractually visible export order book, captive customer, or stated capacity-utilisation roadmap, is faith-based. Indian small-cap history is full of “world-class plants” that never found end-customers.
Key Takeaways
- Capex-to-Depreciation Ratio is the cleanest 60-second filter for whether a business is genuinely reinvesting (above 1.0x) or quietly harvesting (below 1.0x). Pair it always with a 3–5 year average to neutralise lumpiness.
- The ratio is the operational decoder of Buffett’s “owner earnings” framework — depreciation is the accounting proxy for maintenance capex, and the gap between actual capex and depreciation is, in effect, growth capex.
- Titan Biotech FY25 audited numbers — ~₹11 Cr CWIP, ~₹57 Cr gross block, ~7% depreciation/gross block, ~103% CFO/Operating Profit and only ~₹3 Cr total borrowings — illustrate disciplined, internally funded reinvestment in an Indian small-cap manufacturer. This is an educational illustration, not a recommendation.
- The ratio is necessary but not sufficient. Always pair it with incremental return on capital, related-party scrutiny, CWIP-to-commissioning movement, and revenue/PAT compounding to confirm that capex is being deployed at adequate returns.
SEBI Disclaimer
Disclaimer: This article is for educational and informational purposes only. It is not investment advice, and not a buy, sell, or hold recommendation on any stock mentioned, including Titan Biotech Limited. Equity markets carry risk; please do your own research or consult a qualified professional before making investment decisions.
